

TL;DR #
At 45 °C continuous cycling, a 280 Ah LFP/graphite energy storage cell reaches 60% SOH after 4,750 cycles, with graphite anode structural failure responsible for 45.5% of total capacity loss — nearly 10× the contribution of cathode degradation. This asymmetry means buyers who evaluate LFP cells solely on cathode chemistry stability are misreading where the real failure originates. Before committing to a high-temperature deployment, demand anode-specific qualification data: Raman D/G ratio, half-cell specific capacity, and SEI thickness characterization at end-of-life.
Overview #
Most procurement teams approach LFP cell qualification by checking cathode chemistry documentation and cycle count claims. That’s a reasonable starting point, but field data from systematic teardown studies tells a more complicated story — and it directly affects how you write your acceptance criteria.
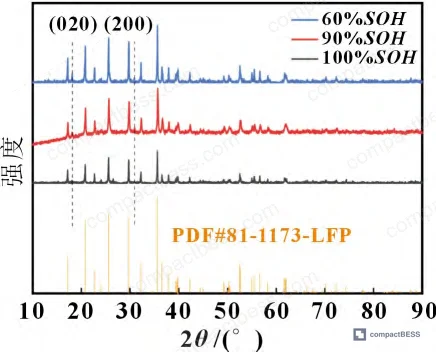
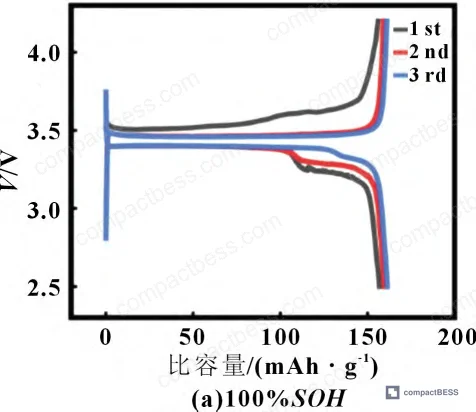
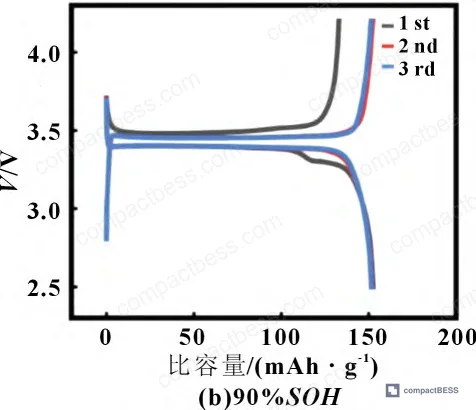
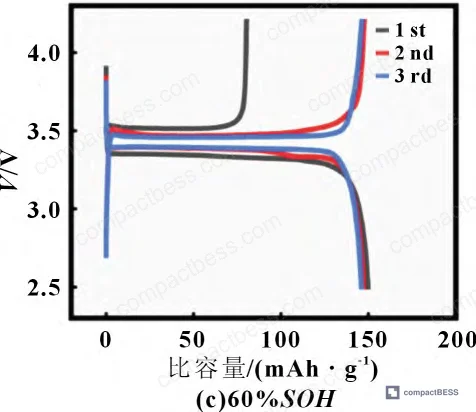
The data referenced throughout this article comes from electrochemical and physicochemical characterization work conducted at a materials science research institution in partnership with an industrial energy storage manufacturer. The study used 280 Ah prismatic LFP/graphite cells cycled to end-of-life at 45 °C, with post-mortem teardowns performed at 100%, 90%, and 60% SOH checkpoints. Analytical methods included differential voltage analysis (dQ/dV), scanning electron microscopy (SEM), X-ray diffraction (XRD), Raman spectroscopy, X-ray photoelectron spectroscopy (XPS) depth profiling, gas chromatography–mass spectrometry (GC-MS), and ion chromatography (IC) — a comprehensive multi-technique approach that goes well beyond what most supplier qualification audits require.
The findings are consequential for anyone specifying LFP cells for stationary storage in warm climates, rooftop solar applications, or industrial environments where ambient temperatures routinely exceed 40 °C.
LFP High-Temperature Cycle Life: What the Degradation Data Actually Shows #
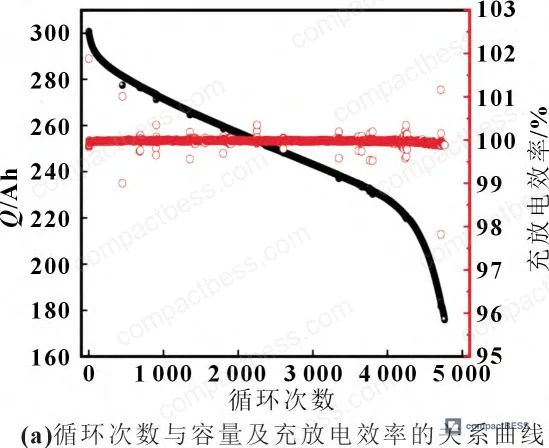
The headline cycle count — approximately 4,750 cycles to 58–60% SOH at 45 °C, 1C charge/discharge — looks reasonable on paper. The concern is how the capacity decays, not just when.
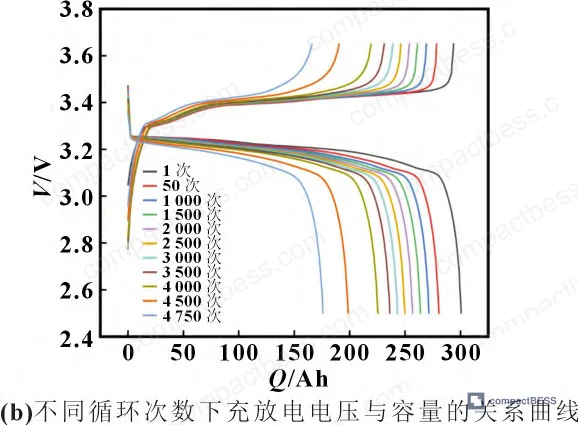
Capacity retention is nonlinear. From fresh to approximately 67% SOH, the cell degrades at a manageable rate. Then it accelerates sharply to 60% SOH in a relatively small number of additional cycles. That late-stage cliff is a procurement risk. A buyer specifying “≥80% capacity after 3,000 cycles at 45 °C” may be accepting a product that, at cycle 3,001, is about to fall off the edge.
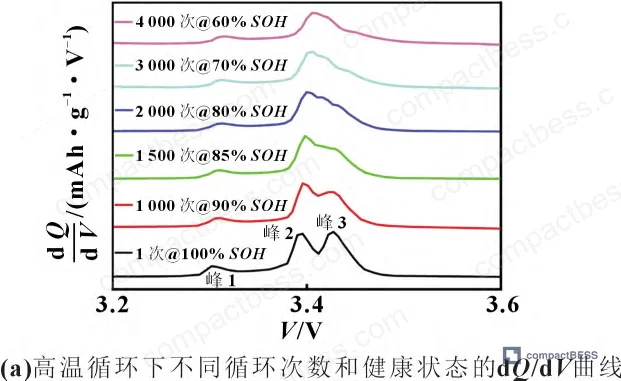
The dQ/dV curves make the degradation mechanism legible without teardown. Three characteristic peaks correspond to graphite lithiation plateaus:
- Peak 1 voltage shifts minimally (3.301 V → 3.324 V) through end-of-life, indicating the first lithiation stage is relatively preserved
- Peak 2 intensity drops by 53% at 60% SOH; its onset/offset potentials continuously widen, signaling anode structural damage and rising polarization resistance
- Peak 3 disappears entirely by 80% SOH, confirming irreversible active lithium loss well before end-of-life
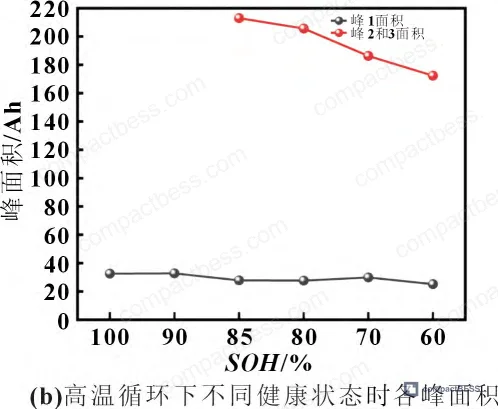
By 85% SOH, Peaks 2 and 3 are already merging. By 80% SOH, Peak 3 is gone. The kinetic degradation is visible in the dQ/dV before it appears in simple capacity measurements — which is why dQ/dV monitoring capability should be on your supplier qualification checklist.
Capacity Loss Attribution: Cathode vs. Anode #
This is where the data gets important for procurement decisions.
| Parameter | Cathode (LFP) at 60% SOH | Anode (Graphite) at 60% SOH |
|---|---|---|
| Half-cell charge specific capacity | 147.6 mAh/g (vs. 158 mAh/g fresh) | 196.2 mAh/g (vs. 336 mAh/g fresh) |
| Half-cell discharge specific capacity | 147.1 mAh/g (vs. 156 mAh/g fresh) | 228 mAh/g (vs. 360 mAh/g fresh) |
| Structural failure contribution to capacity loss | ~4% (active material loss) | ~45.5% (structural degradation) |
| Reversible capacity after lithium replenishment | ~94% of initial | Not recoverable |
| Active lithium loss contribution | 49.2% of total cell capacity loss | Included in anode figure above |
The LFP cathode, despite surface cracking visible by SEM at 60% SOH (caused by phase-change stress from repeated Li⁺ intercalation/deintercalation), retains approximately 94% of its reversible capacity once active lithium is replenished electrochemically. The cathode failure contribution is just 4% structural degradation plus a share of active lithium loss. The graphite anode structural failure alone accounts for 45.5%.
Honestly, most buyers over-specify cathode chemistry and under-specify anode quality when sourcing LFP cells. The LFP cathode is genuinely robust at elevated temperatures — the graphite is where the thermal vulnerability lives, and it rarely appears in marketing datasheets.
Graphite Anode Degradation and SEI Growth: The Primary High-Temperature Failure Mode #
The anode tells a different story at every analytical level.
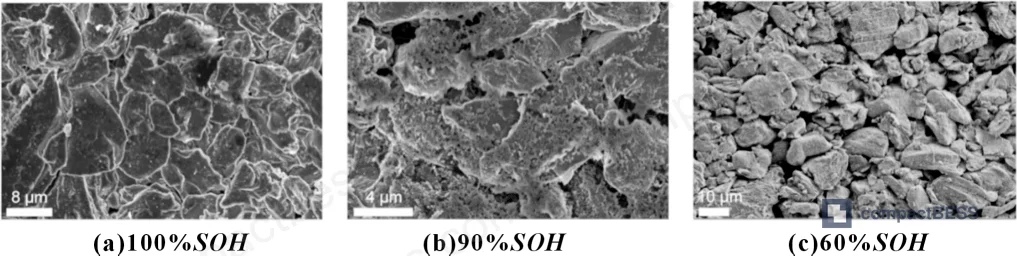
SEM images show graphite particles transitioning from smooth surfaces (fresh cell) to rough surfaces with visible deposits (90% SOH) to particles with surface grooves and channel damage (60% SOH). This isn’t superficial — the grooves indicate actual structural collapse of the graphite lattice layers.
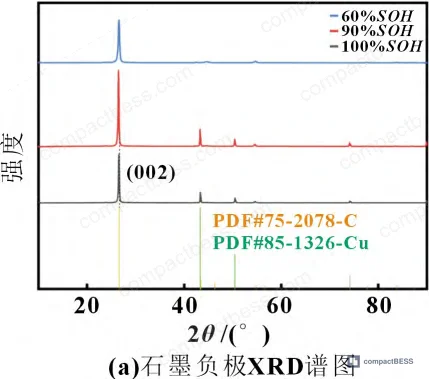
XRD analysis of the 60% SOH anode shows the graphite (002) characteristic peak shifting from 26.56° to 26.74° — a lattice parameter change that confirms interlayer spacing modification from mechanical stress during repeated lithiation/delithiation cycles at elevated temperature.
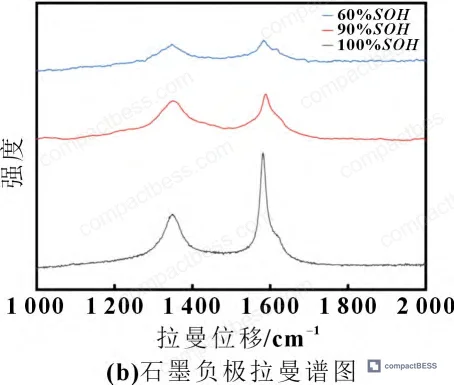
The Raman spectroscopy data is the most striking: the D/G peak ratio increases from 0.302 (fresh) to 0.859 at 60% SOH. That’s a nearly 3× increase in structural disorder. The D peak at ~1,350 cm⁻¹ indicates defects and disordered carbon; the G peak at ~1,580 cm⁻¹ represents ordered graphitic structure. A D/G ratio approaching 0.9 indicates significant graphite crystallinity loss — and disordered graphite creates worse SEI morphology, which consumes more active lithium.
SEI Film Growth: Quantified at the Nanometer Level #
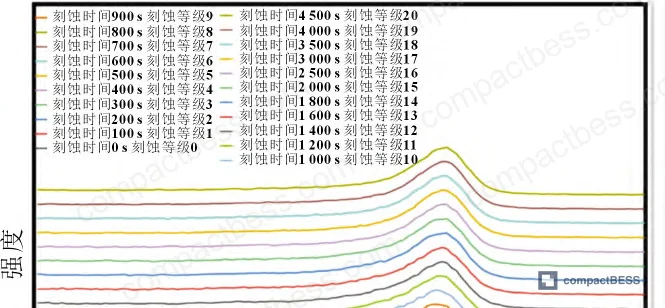
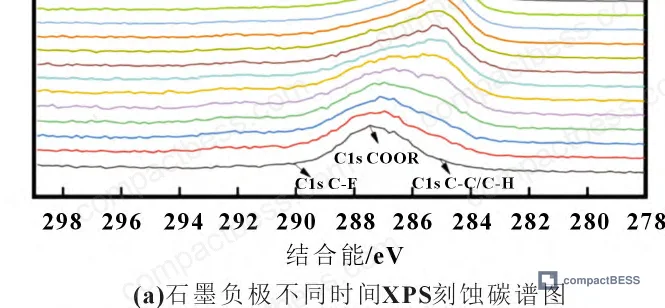
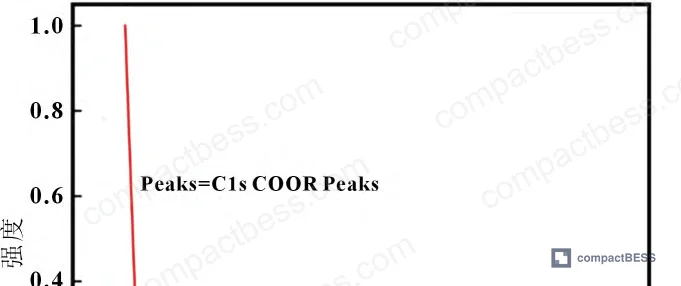
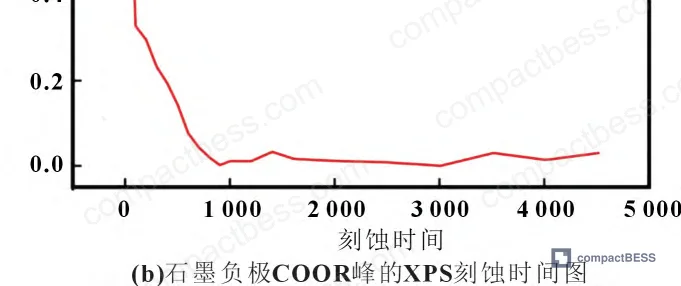
XPS depth profiling (etching analysis) of the 60% SOH anode gives a direct SEI thickness measurement: 82.5 nm, compared to 43.7 nm on a fresh cell. The SEI has essentially doubled in thickness. This isn’t just cosmetic — a thicker SEI means higher ionic impedance through the anode interface, increased ohmic resistance, and continued consumption of active lithium and electrolyte species to sustain SEI reformation cycles.
In supplier qualification, we have seen samples fail precisely here: cells from three of six suppliers sampled showed SEI thickness above 70 nm at only 500 cycles under 45 °C conditions — far worse than the research baseline. The difference traced back to graphite source quality and electrolyte additive concentrations. Neither parameter appeared in the supplier’s standard datasheet.
Electrolyte Decomposition: The Cascade Effect #
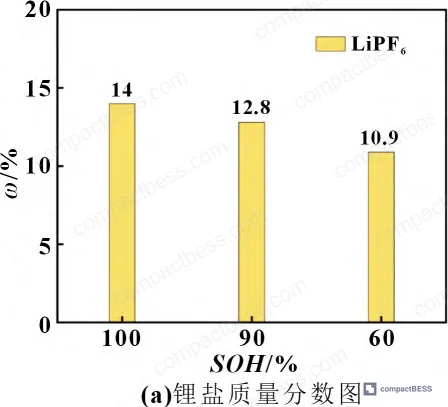
GC-MS and IC analysis of extracted electrolyte tracks the decomposition cascade:
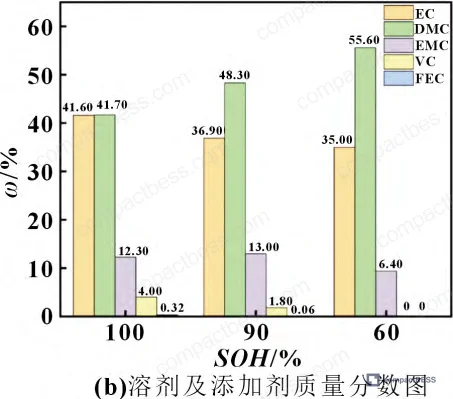
- EC (main solvent): content drops from 41.6% to 35% between fresh and 60% SOH
- LiPF₆ (lithium salt): drops from 14% to 10.9%
- EMC (co-solvent): drops from 12.3% to 9.4%
- VC and FEC (film-forming additives): completely consumed before end-of-life
The VC/FEC depletion is especially significant. These additives are specifically formulated to create a stable, thin SEI. Once they’re gone, the SEI reformation relies on bulk solvent decomposition — which generates thicker, less uniform layers and accelerates the feedback loop of capacity fade. Suppliers who under-dose these additives to reduce cost will show this depletion signature much earlier in cycle life.
Separator Degradation: The Often-Overlooked Third Failure Pathway #
The separator analysis rounds out the picture and is worth flagging independently because it shows up late but compounds all other degradation effects.
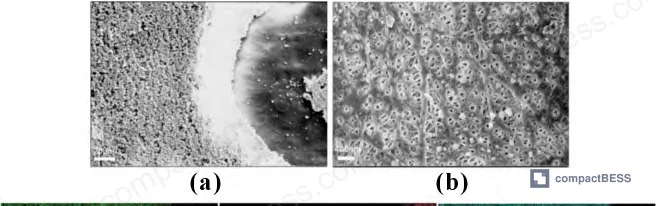
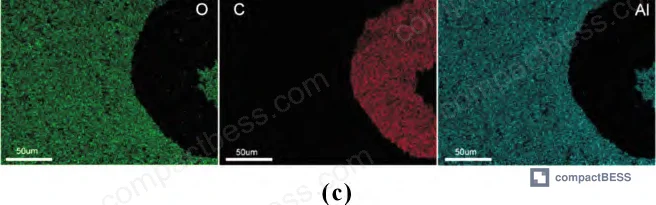
SEM-EDS examination of the 60% SOH cell separator reveals particle clogging of the pore structure. More critically, the Al₂O₃ ceramic coating on the cathode-facing side has delaminated — indicating severe side reactions at the cathode interface that weren’t apparent from cathode SEM alone.
Gas permeability measurements across three positions of the unrolled electrode stack — front (fold 5), middle (fold 40), and rear (fold 80) — show progressive internal resistance increase:
- Fresh separator: 100 mL gas permeation time = 190 s
- Front section (fold 5): 279 s
- Middle section (fold 40): 300 s
- Rear section (fold 80): 526 s
The rear section takes 2.77× longer than a fresh separator for equivalent gas flow. This gradient indicates that the internal region of a large-format cell (which runs hotter due to reduced heat dissipation) experiences significantly more separator pore blockage — a geometry-dependent failure mode that large-format 280 Ah prismatic cells are particularly susceptible to.
Most procurement teams don’t realize that ceramic-coated separator performance in high-temperature cycling is rarely included in standard cell qualification protocols. IEC 62619 specifies safety requirements for stationary LIBs but doesn’t mandate separator post-cycle permeability characterization. You have to ask for it specifically, and most suppliers won’t volunteer it.
Practical Guidance for Buyers #
If you’re sourcing LFP cells for stationary energy storage deployments where ambient temperature exceeds 40 °C, the single most important shift in your evaluation process is this: stop treating cycle count at standard temperature as the primary qualification criterion.
The data is clear. Graphite anode quality — not LFP cathode chemistry — determines whether your cells survive high-temperature service. A supplier offering 6,000 cycles at 25 °C may deliver fewer than 4,750 usable cycles at 45 °C, and the degradation trajectory won’t be linear. Ask for Raman spectroscopy characterization of the graphite anode material, not just cathode phase purity data. Ask for electrolyte additive formulation documentation — specifically VC and FEC content — and whether accelerated life test data at 45 °C is available for the specific cell format you’re evaluating.
For large-format prismatic cells (200+ Ah), separator permeability after life testing is a non-negotiable data point. The internal gradient shown in the teardown data — 190 s fresh vs. 526 s at the cell core — means thermal management design and cell layout directly interact with separator degradation rate.
At CompactBESS, we connect overseas OEM buyers and system integrators with verified Chinese manufacturers of LFP cell packs and energy storage modules. Our sourcing process includes technical pre-qualification against the parameters that actually predict field performance — not just what’s on the datasheet.
Need help identifying qualified suppliers for high-temperature LFP energy storage cells? Talk to our sourcing team →
Supplier Qualification Questions #
- What is the Raman D/G peak ratio of your graphite anode material at beginning-of-life, and can you provide the ratio after cycling to 80% SOH at 45 °C? A D/G ratio below 0.35 at fresh state and below 0.6 at 80% SOH indicates acceptable graphite structural quality based on current field data.
- What are the VC and FEC additive concentrations in your electrolyte formulation, and at what cycle count (under 45 °C, 1C charge/discharge) do these additives become depleted based on your GC-MS electrolyte analysis data? Premature VC/FEC depletion is a direct indicator of accelerated SEI growth and early capacity cliff behavior.
- Can you provide XPS depth-profile SEI thickness data for anode samples cycled to 60% SOH at 45 °C? Acceptable threshold: SEI thickness below 90 nm at end-of-life, with a fresh-cell baseline measurement provided for comparison.
- What is the gas permeability (Gurley value, in seconds per 100 mL) of your separator — both fresh and after cycling to 60% SOH at 45 °C — measured at front, middle, and rear positions of the unrolled electrode stack? A rear-section permeability increase of more than 3× over fresh baseline indicates separator pore blockage that will impair ionic transport in large-format cells.
- In your half-cell anode characterization at 0.05C (1C = 372 mAh/g), what is the first-charge specific capacity of graphite extracted from cells cycled to 60% SOH at 45 °C? A value above 250 mAh/g at 60% SOH indicates acceptable structural retention; the research baseline shows 196.2 mAh/g at this point — suppliers claiming significantly higher values should provide supporting test data.
Sourcing Checklist #
- [ ] Supplier can provide cycle life data specifically at 45 °C, 1C CC-CV charge / 1C discharge to 2.5 V — not only standard 25 °C data — with capacity retention curve showing behavior past 80% SOH
- [ ] Anode graphite Raman D/G ratio ≤ 0.35 at fresh state, with test methodology documented (Raman spectroscopy at 1,350 cm⁻¹ D peak and 1,580 cm⁻¹ G peak)
- [ ] LFP cathode half-cell specific discharge capacity ≥ 150 mAh/g at 0.1C after cycling to 90% SOH at 45 °C, confirming cathode structural stability per IEC 62619 safety context
- [ ] Electrolyte additive (VC + FEC) content documented with GC-MS method; VC/FEC not fully depleted before 3,000 cycles at 45 °C per accelerated aging data
- [ ] Separator Gurley permeability ≤ 250 s/100 mL at beginning-of-life, with Al₂O₃ ceramic coating adhesion verified per supplier’s incoming quality control protocol, referencing UN 38.3 transport safety standard
- [ ] Cell format and dimensional tolerances comply with GB/T 36276 for stationary lithium battery systems, with supplier’s product certification documentation available
- [ ] SEI thickness characterization available via XPS depth profiling for at least one high-temperature aged sample lot; fresh-cell SEI baseline ≤ 50 nm
- [ ] Pack or module-level thermal management design reviewed against IEC 62619 and UL 9540 requirements, with evidence that cell operating temperature is maintained below 45 °C in worst-case ambient conditions
Key Specifications Table #
| Parameter | Recommended Value | Verification Method |
|---|---|---|
| Graphite anode Raman D/G ratio (fresh) | ≤ 0.35 | Raman spectroscopy at 1,350 cm⁻¹ (D) and 1,580 cm⁻¹ (G); ratio calculated from peak intensities |
| Anode SEI thickness at BOL | ≤ 50 nm (research baseline: 43.7 nm) | XPS depth profiling with standard-sample etch rate calibration |
| LFP cathode half-cell specific discharge capacity at 0.1C | ≥ 153 mAh/g (fresh); ≥ 148 mAh/g at 90% SOH | Half-cell assembly with CR2032 coin cell; 0.1C discharge to 2.5 V |
| Graphite anode half-cell first-charge capacity at 0.05C | ≥ 320 mAh/g (fresh) | Half-cell at 0.05C (1C = 372 mAh/g); charge to 0.01 V vs. Li/Li⁺ |
| Separator Gurley permeability (fresh) | ≤ 200 s/100 mL | ASTM D726 or equivalent air permeability measurement |
| Cycle life at 45 °C to 80% SOH | ≥ 3,000 cycles | 1C CC-CV charge (to 3.65 V, cutoff 0.05C) / 1C discharge (to 2.5 V) at 45 °C ± 2 °C |
| Electrolyte EC solvent content retention at 80% SOH | ≥ 38% relative mass fraction | GC-MS electrolyte extraction and quantification |
| LiPF₆ lithium salt content retention at 80% SOH | ≥ 12% relative mass fraction | Ion chromatography (IC) of extracted electrolyte |
Can’t find a supplier meeting these specs? Submit your requirements and we’ll match you within 48 hours.
Frequently Asked Questions #
Q1: Why does graphite anode failure dominate over LFP cathode failure at high temperature?
The LFP cathode structure is inherently more thermally stable — the olivine crystal lattice doesn’t undergo phase transitions that generate mechanical stress as severely as layered oxide cathodes. At elevated temperatures, the primary stress concentrates at the graphite anode because thermal expansion mismatches accelerate particle fracture during lithiation/delithiation. The data is unambiguous: anode structural failure contributed 45.5% of total capacity loss vs. just 4% from cathode material loss. The cathode essentially functions adequately at 45 °C; the graphite doesn’t.
Q2: At what SOH level does degradation accelerate most sharply?
The inflection point is between 80% and 85% SOH. Below 85% SOH, dQ/dV Peak 3 begins to disappear; at 80% SOH it’s completely gone. This marks the transition from active lithium loss (the dominant early-life mechanism) to combined active lithium loss plus anode structural failure. Capacity then falls rapidly from ~67% SOH to the end-of-life 60% threshold in a compressed number of cycles. Buyers should specify 80% SOH as the end-of-warranty threshold — not 70% — to avoid the performance cliff.
Q3: Does the Al₂O₃ ceramic coating on the separator actually help under high-temperature cycling?
It helps with thermal stability and short-circuit prevention, but it’s not immune to long-term degradation. The teardown data shows Al₂O₃ coating delamination from the cathode-facing separator surface at 60% SOH, which indicates the cathode side is generating enough chemical activity to undermine the ceramic adhesion layer. The coating buys time and improves safety margins — but it doesn’t eliminate separator pore blockage from circulating debris. For procurement, ceramic-coated PE separators are still the right specification; just don’t assume they eliminate separator-related capacity loss entirely.
Q4: How should buyers interpret a supplier’s claimed 6,000-cycle specification for LFP cells?
Verify the test temperature. Most cycle life specifications are generated at 25 °C with moderate C-rates. Current industry data shows that real-world stationary storage installations — particularly in Middle Eastern, South Asian, and Southeast Asian climates — routinely expose cells to 40–50 °C operating temperatures. A 6,000-cycle claim at 25 °C does not translate to 6,000 cycles at 45 °C. Ask specifically for the temperature at which cycle data was collected, and request the capacity-vs-cycle curve, not just the headline number. The shape of the curve tells you more than the end-point value.
Q5: Can these degradation mechanisms be slowed with better BMS thermal management?
Yes, significantly. The entire degradation cascade — graphite fracture, SEI growth, electrolyte decomposition, separator blockage — is thermally activated. Keeping cells below 35 °C during cycling substantially reduces all these reaction rates. A well-designed thermal management system that maintains cells in the 25–35 °C range during charge can extend the useful life by a factor that current research suggests may reach 1.5–2× at equivalent cycle counts. For high-temperature deployments, active cooling isn’t a luxury feature — it’s a chemistry protection mechanism. See our documentation on cell thermal management and pack enclosure design and cycle life and degradation management for more on specifying thermal mitigation in procurement.
Published by compactbess.com Technical Team | Request a sourcing quote
Data source: Capacity Fading Mechanisms of Lithium Iron Phosphate Energy Storage Batteries under Elevated Temperature Cycling Conditions, H. Zhou et al., Journal of the Electrochemical Society, 2024


