

TL;DR #
Annular dual-beam laser welding of 1060 aluminum busbars achieves optimal tensile strength at a precise parameter window: 80/20 inner-to-outer energy ratio, 4,000 W total power, 80 mm/s welding speed, and 0 mm defocus — validated across 10,000+ production modules with a first-pass yield of ≥99.95%. For buyers, this means the difference between a structurally sound busbar joint and one that looks acceptable but contains subsurface thermal cracks is entirely a process parameter question — not a material one. When qualifying a supplier’s busbar welding capability, demand their documented process window data and metallographic cross-section samples before approving any production run.
Overview #
Most procurement teams approach busbar welding as a secondary concern — something handled by the module assembler with whatever laser system they have on the floor. That assumption is expensive. The busbar-to-terminal joint is the single highest-current connection in the module stack, and a weld that passes visual inspection but contains subsurface porosity or micro-cracks will degrade conductivity, generate localized heat, and eventually fail under vibration.
The data in this article draws from controlled welding trials conducted at an industrial automation equipment facility in eastern China, using 2 mm thick 1060 aluminum busbars welded onto 280 Ah battery top covers of the same alloy — a setup that closely mirrors production-scale energy storage module assembly. The test protocol isolated four key variables — energy ratio, total power, welding speed, and defocus amount — using an IPG YLS-4000/2000-AMB-P continuous-wave annular dual-beam laser system. Metallographic cross-sections, weld depth/width measurements, and tensile pull tests were performed on each parameter combination. Over 10,000 production modules were subsequently assembled under the optimized parameters, providing a meaningful yield data set.
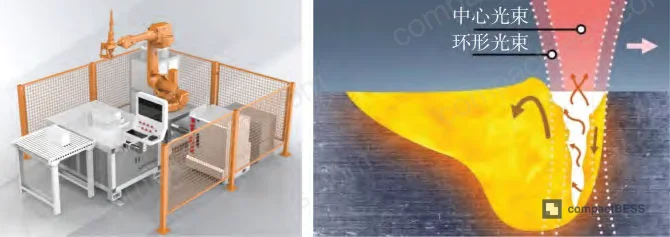
Annular Dual-Beam Laser Welding: Why It Matters for Busbar Interconnect Quality #
Traditional single-fiber laser welding of 1060 aluminum has a persistent problem: the material’s high thermal conductivity and low melting point create unstable keyhole dynamics that produce spatter, porosity, and highly variable fusion depth. Conventional MIG or TIG processes make this worse — gas shielded arc welding on aluminum alloy busbars routinely generates cracking, porosity, and weld bead collapse.
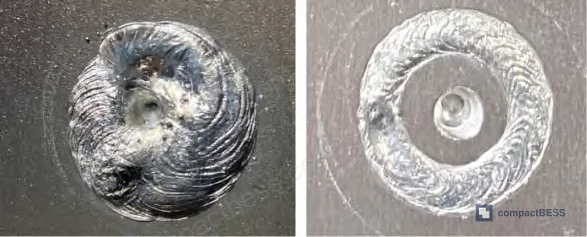
Annular dual-beam laser welding resolves this by co-axially combining two fiber lasers: a small-diameter inner beam (50 μm core fiber) that drives deep keyhole penetration, and a larger outer ring beam (150 μm core fiber) that provides thermal conduction stabilization around the melt pool. The two axes are spatially coincident, and the result is a larger, more stable keyhole with significantly reduced spatter and better gap-bridging capability compared to single-beam fiber laser.
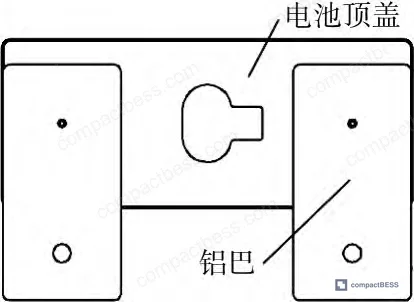
The welding pattern used in these trials is a spiral trajectory: 11 mm center circle diameter, inner spiral radius 0.8 mm, inner circle diameter 9.4 mm, outer circle diameter 12.6 mm. Before welding, surfaces are cleaned with a 200 W IPG laser cleaner at 80% power to remove the oxide layer, then wiped with alcohol. A nitrogen shielding gas flow of (10 ± 2) L/min is maintained throughout.
Energy Ratio: The Most Sensitive Parameter #
The inner-to-outer energy ratio is the parameter that most procurement engineers have never been asked about — and it has a non-linear effect on joint strength that catches suppliers out regularly.
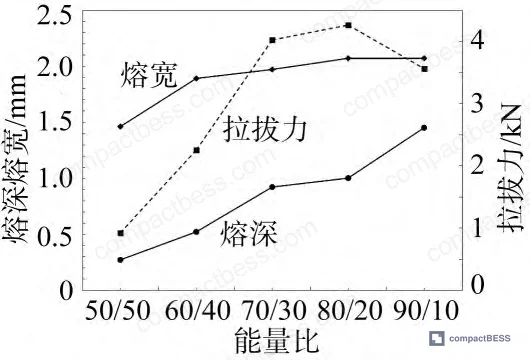
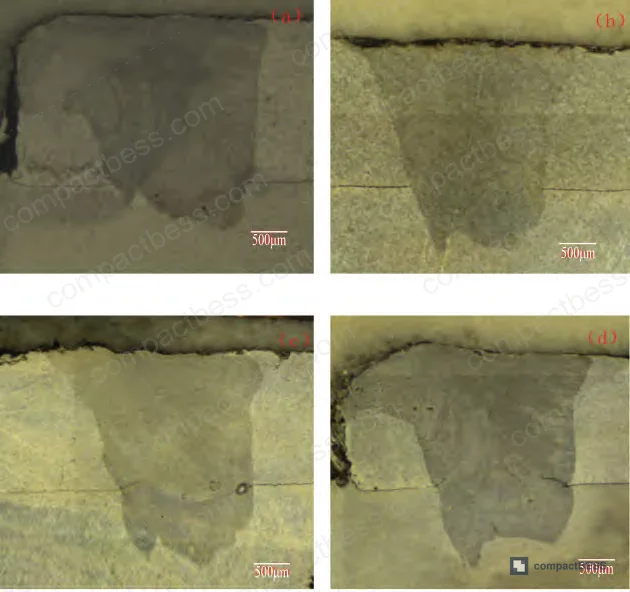
Trials were run from 50/50 to 90/10 (inner/outer) while holding total power at 4,000 W, speed at 80 mm/s, and defocus at 0 mm. Results:
- At 50/50: outer ring dominates, keyhole opening is large (favorable for vapor escape), but fusion depth is shallow and tensile strength is below optimum
- At 80/20: weld microstructure is uniform, no porosity or cracking visible in metallographic section, tensile strength reaches its peak value
- At 90/10: fusion depth increases further, but thermal cracking appears at the bond interface due to excessive temperature concentration — tensile strength drops despite deeper penetration
The mechanism is important to understand: a lower energy ratio (more outer ring power) creates a wider keyhole opening that allows metal vapor to escape, suppressing porosity. But it also reduces fusion depth and joint area. A higher energy ratio drives deeper penetration but concentrates heat at the fusion zone, generating thermal gradients that nucleate hot cracks. The 80/20 ratio represents the crossover point where these competing effects are optimally balanced for 1060 aluminum at 2 mm section thickness.
Power Level: The 4,000 W Sweet Spot #
| Total Power (W) | Fusion Depth Trend | Weld Width Trend | Tensile Strength |
|---|---|---|---|
| 3,000 | Very shallow (false weld) | N/A | Failed — cold joint |
| 3,500 | Shallow, insufficient | Narrow | Below target |
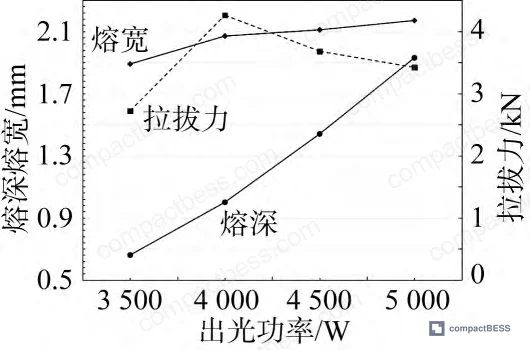
| 4,000 | Optimal penetration | Stable | Maximum |
| 4,500 | Increased | Stable | Declining |
| 5,000 | Excessive | Stable | Significantly reduced |
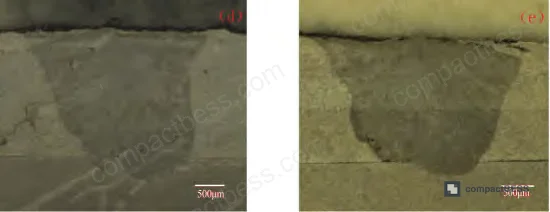
At 3,000 W total power, the weld is a cold joint — there’s partial surface contact but no structural fusion. The researchers excluded this from comparative tensile analysis because the joint simply disbonds under load. At 4,000 W, fusion depth reaches the target range and the metallographic section shows a uniform, defect-free melt zone. Beyond 4,000 W, the excess heat at the fusion interface generates thermal cracks that counteract the deeper penetration — tensile strength falls even as fusion depth continues to increase.
This is the central finding that matters for buyers: fusion depth and tensile strength are positively correlated only up to a threshold. Beyond that threshold, deeper is weaker. Suppliers who optimize purely for penetration depth — a common shortcut — will produce welds that look impressive in cross-section but fail pull tests.
Welding Speed and Defocus: Process Window Boundaries for Aluminum Busbar Joints #
Speed: The Burn-Through Boundary #
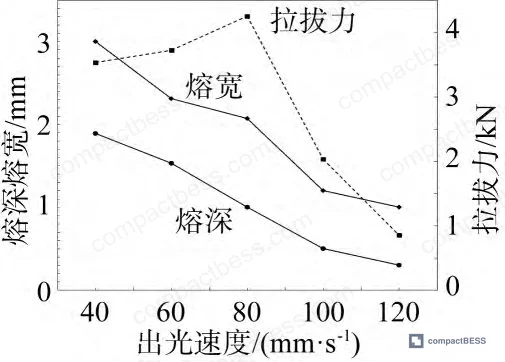
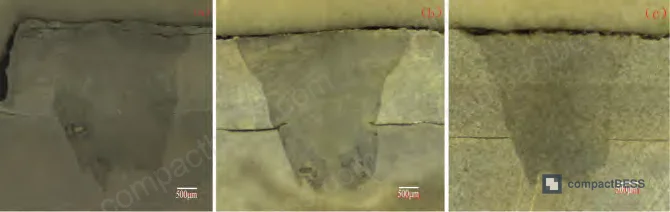
Welding speed was swept from 20 mm/s to 120 mm/s, holding power at 4,000 W, energy ratio at 80/20, and defocus at 0 mm.
At 20 mm/s, the heat input per unit length is so high that burn-through occurs — fusion depth exceeds 2 mm in a 2 mm workpiece, and the surface morphology is described as agglomerated and unmeasurable. This effectively sets the lower bound. At 40 mm/s, the weld is structurally sound but heat accumulation produces cracking risk. As speed increases from 40 to 80 mm/s, both fusion depth and width decrease monotonically — a clear negative correlation. Tensile strength, however, peaks at 80 mm/s rather than following fusion depth linearly.
Above 80 mm/s, reduced dwell time narrows the heat-affected zone and thermal conduction area, which reduces fusion depth below the threshold needed for adequate joint strength. At 120 mm/s, incomplete fusion becomes the dominant failure mode.
Honestly, most buyers over-specify welding speed requirements without understanding what they’re asking for. Faster is not cleaner. A supplier running at 120 mm/s to hit throughput targets is almost certainly sacrificing joint integrity on every module — and the defect is subsurface, so it won’t show up in visual inspection.
Defocus Amount: Negative Is Stronger #
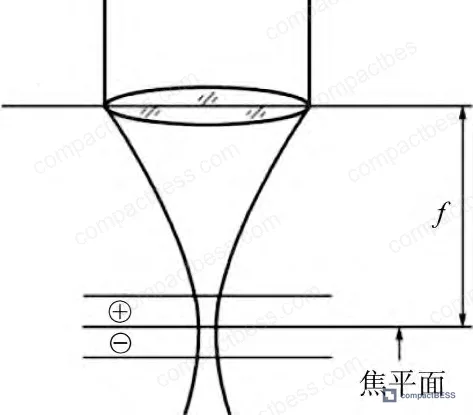
Defocus refers to the distance from the focal plane to the workpiece surface. Positive defocus places the focal point above the surface; negative defocus places it below.
Trials ranged from -6 mm to +4 mm in 2 mm increments, with false welds occurring at -8 mm and +6 mm (these were excluded from comparative analysis). Key observations:
- Fusion depth increases with negative defocus — the focal point inside the material concentrates energy density in the sub-surface zone, driving stronger melt reactions
- Positive defocus reduces fusion depth and increases surface weld width, making it more suitable for thin-section materials where burn-through is a risk
- As the absolute defocus value increases in either direction, undercutting becomes more pronounced at the weld edges
- For high-reflectivity aluminum in standard busbar configurations, zero or slightly negative defocus gives the best combination of depth, strength, and edge geometry
For thin busbar applications (below 1.5 mm), positive defocus is recommended to distribute heat over a wider surface area and avoid punch-through.
Practical Guidance for Buyers #
The process window for annular dual-beam laser welding of 1060 aluminum busbars is narrower than most suppliers acknowledge. The four key parameters — energy ratio, total power, welding speed, and defocus — interact in ways that make single-parameter optimization misleading. A supplier who quotes you a tensile strength figure without disclosing all four process parameters is giving you incomplete data.
In supplier qualification for high-capacity energy storage module assembly, we’ve seen weld failures originate almost exclusively from suppliers running high-speed, high-power settings to chase throughput — then compensating with lenient visual inspection acceptance criteria. Thermal cracks at the busbar bond interface are invisible to the naked eye and won’t show up on a standard continuity check. They show up as elevated contact resistance in cycle testing, or as mechanical failure under vibration.
Compliance with IEC 62619 (safety requirements for secondary lithium cells and batteries in industrial applications) and IEC 62133 requires joint integrity under mechanical abuse conditions. For export markets, busbar weld quality also feeds directly into UN 38.3 transport test compliance, since vibration and shock testing will expose latent weld defects. Buyers should also reference ISO 17636 (non-destructive testing of welds) when specifying incoming inspection requirements for welded battery module interconnects.
CompactBESS works directly with verified Chinese manufacturers of battery module assemblies and busbar interconnect components — connecting global OEM buyers and energy storage integrators with suppliers whose process capabilities have been evaluated at the production level, not just on a spec sheet. If you’re building a sourcing shortlist for module assembly partners, we can help you ask the right questions before you commit to a sample order.
Need help identifying qualified suppliers for aluminum busbar laser welding? Talk to our sourcing team →
Supplier Qualification Questions #
- What is your documented inner-to-outer energy ratio for 1060 aluminum busbar welding, and can you show tensile test data comparing results at 70/30, 80/20, and 90/10 ratios across your production batches?
- At your production welding speed, what is the measured fusion depth range, and how do you verify that fusion depth stays above the minimum threshold without crossing into the thermal cracking zone at your operating power level?
- Can you provide metallographic cross-section samples showing weld microstructure — specifically demonstrating absence of porosity, undercutting, and thermal cracking at the bond interface — for your standard busbar-to-terminal configuration?
- What is your measured first-pass weld yield rate for aluminum busbar joints on 280 Ah or comparable large-format cells, and what is your documented corrective action protocol when yield drops below 99.5%?
- How do you control defocus amount in production, and what is your tolerance band (in mm) — specifically, what is your procedure when the copper nozzle tooling causes fitment variation between the busbar and top cover surface?
Sourcing Checklist #
- [ ] Supplier uses annular dual-beam or equivalent advanced laser system (single-fiber fiber laser without outer ring is insufficient for high-reflectivity aluminum at ≥2 mm section thickness)
- [ ] Documented energy ratio is within 75/25 to 85/15 range (inner/outer) for 1060 aluminum busbar welding — ratios outside this window require additional tensile data justification
- [ ] Total laser power is validated at 4,000 W (±10%) for 2 mm busbar section; supplier can show tensile degradation data at ≥4,500 W and ≤3,500 W
- [ ] Welding speed is set at 80 mm/s (±10 mm/s) for standard busbar joints; speeds above 100 mm/s require documented fusion depth verification to confirm no underfusion
- [ ] Pre-weld surface preparation includes oxide removal (laser cleaning at ≥160 W or equivalent) and alcohol wipe — supplier should confirm this in their process control document
- [ ] Nitrogen shielding gas flow rate is maintained at (10 ± 2) L/min throughout the weld cycle — deviations indicate process control weakness
- [ ] Pull-test (tensile) data is available per batch at the production part level, not just from qualification samples — minimum 5 sample pull tests per production lot
- [ ] Supplier’s weld yield data shows ≥99.5% first-pass acceptance rate on a sustained production basis (the optimized parameter set in controlled trials achieved ≥99.95%)
Key Specifications Table #
| Parameter | Recommended Value | Verification Method |
|---|---|---|
| Inner-to-outer energy ratio | 80/20 (inner/outer) | Request parameter log from laser controller; compare against tensile test results at adjacent ratios |
| Total laser power | 4,000 W | Laser power meter calibration record; tensile pull test showing peak at this power level |
| Welding speed | 80 mm/s | CNC controller log or welding program printout; metallographic cross-section confirming adequate fusion depth |
| Defocus amount | 0 mm (negative defocus permissible for high-reflectivity substrate; positive for thin sections) | Optical setup calibration record; undercutting inspection on weld edge geometry |
| Shielding gas flow | (10 ± 2) L/min nitrogen | Flow meter calibration certificate; porosity rate in metallographic samples |
| Pre-weld surface condition | Oxide-free, alcohol-cleaned | Process control document; comparative metallographic samples with/without cleaning |
| Material specification | 1060 aluminum alloy, ≥99.6% Al content | Material certificate (CoA) with chemical composition data |
Can’t find a supplier meeting these specs? Submit your requirements and we’ll match you within 48 hours.
References #
Data source: Process Parameter Optimization and Mechanical Performance Characterization of Annular Dual-Beam Laser Welding for Aluminum Alloy Interconnects in Energy Storage Battery Modules, H. Chen et al., Journal of Manufacturing Processes, 2024
Frequently Asked Questions #
Why does tensile strength decrease when fusion depth increases beyond a certain point in aluminum busbar welding?
Beyond the optimal fusion depth, the melt zone temperature becomes high enough to generate steep thermal gradients in the solidification front. In 1060 aluminum — which has a relatively wide solidification temperature range — this promotes hot cracking. The cracks form at grain boundaries in the fusion zone and act as stress concentrators, reducing the effective load-bearing cross-section of the joint even though the nominal weld area appears larger. This is why pull-testing to the point of fracture is non-negotiable; fusion depth measurements alone will mislead you.
What is annular dual-beam laser welding and how does it differ from standard fiber laser welding?
A standard single-fiber laser produces a single Gaussian or top-hat beam profile. An annular dual-beam system co-axially combines two fibers — a small core inner beam (typically 50 μm) for deep keyhole penetration and a larger outer ring fiber (typically 150 μm) for thermal stabilization around the melt pool. The outer ring effectively preheats and post-heats the material, stabilizing the keyhole and significantly reducing spatter and porosity compared to single-beam welding on aluminum.
Is 1060 aluminum the right material for busbars in high-capacity energy storage modules?
It’s the most common choice in Chinese module manufacturing because of its high electrical conductivity and low cost. The tradeoff is that its low melting point and high thermal conductivity make it genuinely difficult to weld — traditional arc processes struggle with it, and even standard fiber lasers produce inconsistent results without tight process control. Some higher-performance applications use 1050 or copper-clad aluminum for better conductivity, but 1060 remains the production-volume standard for prismatic cell modules.
What defects should I look for in metallographic cross-sections of aluminum busbar welds?
The four critical defects in 1060 aluminum busbar welds are: (1) porosity — gas pockets formed when metal vapor doesn’t escape the melt pool before solidification; (2) thermal hot cracks — typically at grain boundaries in the fusion zone, caused by excessive temperature gradient; (3) undercutting — erosion of the base material at the weld toe, often caused by excessive defocus or too-high energy on the outer ring; and (4) incomplete fusion — where the weld doesn’t fully penetrate to the bonding interface, creating a cold joint that disbonds under mechanical load.
What certifications should I look for when qualifying a battery module supplier for busbar weld quality?
Ask specifically for compliance with IEC 62619 for industrial battery safety, and confirm their module-level vibration and shock test data against UN 38.3. For structural weld inspection methodology, reference ISO 17636. Certifications alone don’t tell you about process capability — always request production-level pull test data alongside the certificates. See also our internal resources on battery pack design fundamentals and cell balancing and interconnect considerations.
Published by compactbess.com Technical Team | Request a sourcing quote
Data source: Process Parameter Optimization and Mechanical Performance Characterization of Annular Dual-Beam Laser Welding for Aluminum Alloy Interconnects in Energy Storage Battery Modules, H. Chen et al., Journal of Manufacturing Processes, 2024


