

TL;DR #
Laboratory testing of 20–100 Ah square aluminum-shell LiFePO₄ cells under 0.5–1.5 C overcharge conditions reveals that surface deformation detection leads gas emission by 243–916 seconds and internal short circuit by 248–933 seconds, providing a substantially earlier thermal runaway warning window than gas-based systems. For buyers procuring UL 9540A-compliant energy storage systems, this data indicates that mechanical strain monitoring should be specified alongside gas detection to meet early-warning requirements under the standard’s abuse test protocols. Require suppliers to document cell-level deformation thresholds (≥50×10⁻⁶ strain) and demonstrate integration of strain-gauge arrays in their battery management architecture.
Overview #
Most procurement teams evaluate thermal runaway suppression based on temperature or gas thresholds without realizing those signals arrive far too late to prevent catastrophic failure in grid-scale installations. Recent controlled testing at a national electrical insulation laboratory subjected prismatic LiFePO₄ cells (20, 52, and 100 Ah capacities) to deliberate overcharge abuse inside sealed module enclosures fitted with in-situ gas analyzers, high-temperature resistance strain gauges, and multi-point thermocouple arrays. The experimental setup replicated the static, confined environment of actual rack-mounted battery modules to capture the full sequence of physical and chemical precursors before vent activation. Results challenge the industry’s reliance on post-vent detection methods and demonstrate that real-time mechanical deformation tracking offers a 4–15 minute head start over conventional gas-based early warning systems—a critical margin for implementing UL 9540 and UL 9540A mitigation protocols before thermal propagation begins.
Overcharge-Induced Thermal Runaway Progression in LiFePO₄ Cells #
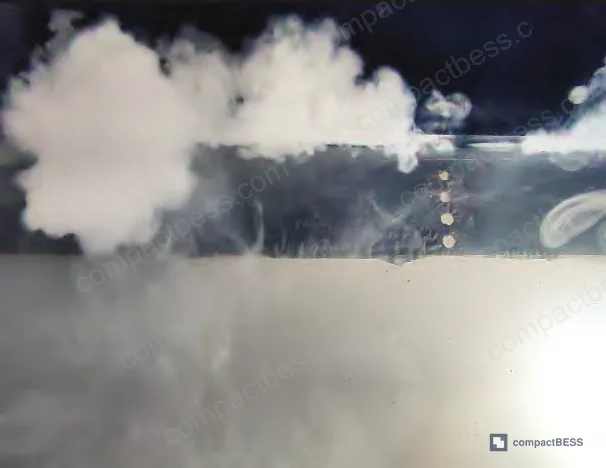
Under controlled 0.5 C overcharge of a 52 Ah square aluminum-shell cell, thermal runaway unfolds in three measurable phases. During the initial 520 seconds, continuous lithium plating on the graphite anode generates hydrogen through reaction with the binder and triggers solid electrolyte interphase (SEI) layer breakdown, releasing CO₂. Internal gas accumulation creates pressure differential across the cell casing, causing visible bulging at the center—the mechanically weakest point with minimal edge restraint. By 1,164 seconds, severe swelling develops as SEI decomposition accelerates and lithium dendrites react vigorously with the electrolyte. The safety vent opens at 1,165 seconds, releasing a dense mixture of electrolyte droplets, flammable gases, and visible smoke that fills the module enclosure within 3 seconds and the entire test chamber within 30 seconds.
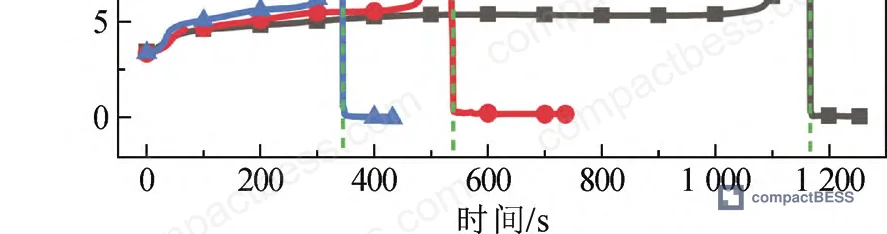
Voltage behavior tracks three distinct regimes. Initial slow rise corresponds to gradual internal resistance increase as the cathode approaches lithium depletion in localized zones. Rapid voltage escalation follows when severe cathode delithiation exhausts available lithium ions in the electrolyte, pushing internal resistance to extreme values. At 1,164 seconds, voltage peaks at 19.63 V—then collapses abruptly as dendrite penetration or localized thermal softening (>130°C) of the separator triggers internal short circuit.
Temperature evolution mirrors the electrochemical cascade. Early-stage joule heating combines with exothermic dendrite growth and electrolyte side reactions to produce gradual warming. Accelerated temperature rise begins as runaway internal resistance generates intense joule heating, massive dendrite formation occurs on the saturated anode, and localized hot zones (80–120°C) initiate SEI thermal decomposition. Peak surface temperature of 275.32°C arrives at 1,437 seconds as SEI breakdown, cathode-electrolyte reactions, and electrolyte decomposition (200–300°C range) create self-sustaining exothermic feedback culminating in short-circuit energy release.
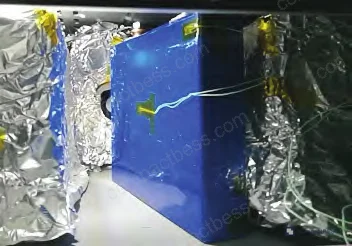
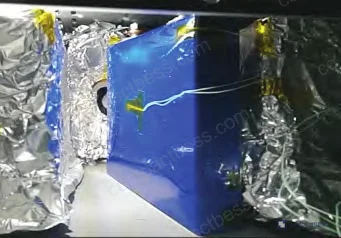
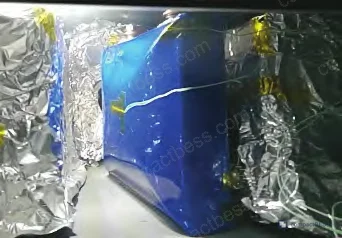
Gas composition data from in-situ monitoring reveals CO and H₂ detection 16–17 seconds before vent opening, while CO₂ appears only 1 second prior to vent activation. Hydrogen originates from binder-lithium reactions at ambient temperature and early SEI breakdown. Carbon monoxide forms during metastable SEI component decomposition as localized temperatures reach 80–120°C. Carbon dioxide generation accelerates when SEI degradation intensifies and when electrolyte decomposition begins at 200–300°C. Once the vent opens, all three gases surge to sensor saturation limits within tens of seconds as violent outgassing continues until thermal runaway concludes.
| Charge Rate | Voltage Peak (V) | Time to Peak (s) | Max Avg Temp (°C) | Time to Max Temp (s) | CO Detection (s) | H₂ Detection (s) | Vent Opening (s) |
|---|---|---|---|---|---|---|---|
| 0.5 C | 19.63 | 1,164 | 275.32 | 1,437 | 1,148 | 1,149 | 1,165 |
| 1.0 C | 21.47 | 534 | 285.56 | 839 | 521 | 522 | 536 |
| 1.5 C | 22.31 | 343 | 291.03 | 558 | 340 | 340 | 344 |
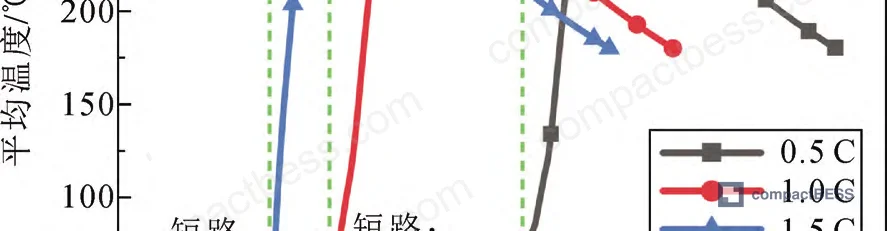
Higher charge rates compress the entire thermal runaway timeline and elevate peak voltage and temperature. At 1.5 C, the cell reaches maximum voltage in 343 seconds versus 1,164 seconds at 0.5 C—a 3.4× acceleration. Peak temperature also climbs from 275°C to 291°C as faster charging intensifies dendrite formation rate and internal heat generation. The interval between first gas detection and vent opening shrinks from 16 seconds (0.5 C) to 4 seconds (1.5 C), leaving almost no time for gas-based intervention.
Mechanical Deformation as Early Warning Indicator for UL 9540A Compliance #
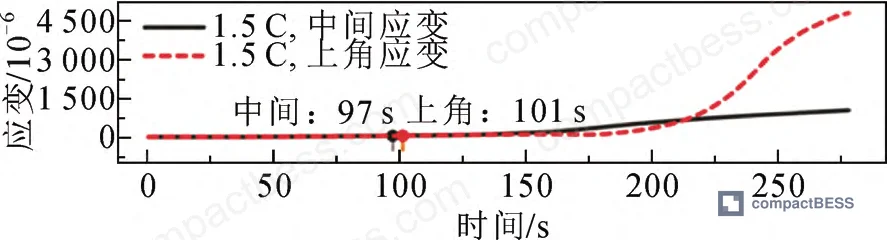
Strain gauge measurements positioned at cell center and upper corner capture swelling dynamics with superior temporal resolution compared to gas sensors. At all three charge rates, center-point strain increases first as internal pressure lifts the mechanically unconstrained middle section. Subsequently, corner strain accelerates and overtakes center strain as progressive bulging forces the aluminum casing’s four edge corners to fold upward. Using 50×10⁻⁶ as the detection threshold, measurable deformation appears 232 seconds into 0.5 C overcharge, 187 seconds at 1.0 C, and 97 seconds at 1.5 C.
Critically, deformation detection precedes gas detection by 916 seconds (0.5 C), 334 seconds (1.0 C), and 243 seconds (1.5 C). Deformation also leads internal short circuit by 932, 347, and 246 seconds respectively. Even under the most aggressive 1.5 C overcharge scenario, strain-based monitoring provides a 4-minute advance warning before short circuit occurs—ample time to trigger BMS protection circuits or initiate suppression systems per UL 9540A test method requirements.
Capacity variation introduces additional complexity. Testing 20, 52, and 100 Ah cells at uniform 0.5 C overcharge rate shows that larger cells reach higher peak temperatures (222°C, 275°C, 342°C respectively) due to greater total energy content and thermal mass. Time to first gas detection varies unpredictably—the 20 Ah cell emits H₂ only 3 seconds before vent opening, while the 100 Ah cell releases CO 164 seconds prior. However, deformation consistently appears 933–948 seconds before vent activation across all three capacities, confirming mechanical monitoring as a capacity-independent early warning signal.
Voltage behavior at short circuit shows no correlation with cell size. The 20 Ah cell peaks at 40–50 V after ~3,000 seconds, the 52 Ah cell reaches 19–25 V at ~1,100 seconds, and the 100 Ah cell hits 55–65 V near 1,200 seconds. These variations stem from differences in electrode formulation, electrolyte composition, separator properties, and manufacturing tolerances across suppliers—making voltage thresholds unreliable for thermal runaway prediction without cell-specific calibration data.
Self-Triggered Thermal Runaway Suppression Device Performance #
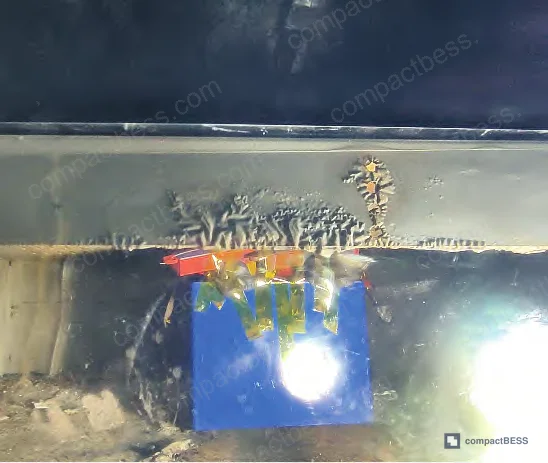
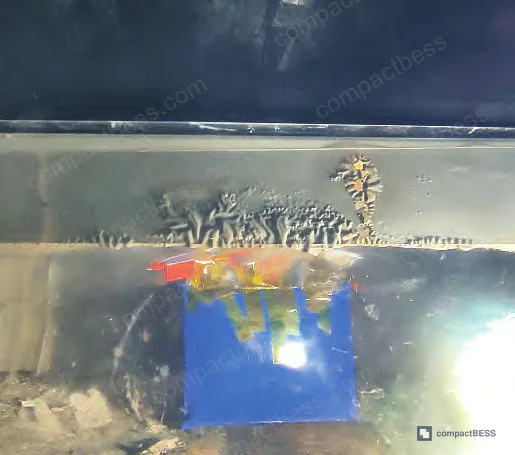
Conventional water-deluge systems introduce electrical hazard and equipment damage risk. A newly developed self-triggering suppression device using thermally sensitive insulating foam addresses these limitations. The unit consists of a sealed canister containing fire-suppressant powder, capped with a temperature-activated membrane that ruptures when exposed to 80°C. Two canister sizes were tested: B80 (80 mm diameter, 80 g suppressant) and B180 (80 mm diameter, 180 g suppressant).
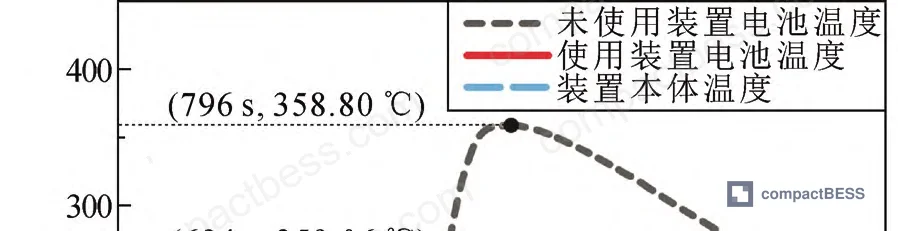
In validation testing with 52 Ah cells under 1.0 C overcharge, the B80 device activated 20 seconds after vent opening when ejected hot gas heated the trigger membrane to threshold temperature. Suppressant discharge required 1 second to complete. Peak cell temperature dropped from 358.80°C (unprotected baseline) to 325.48°C—a 9.3% reduction. The larger B180 unit triggered 89 seconds post-vent and achieved 259.06°C peak temperature—a 27.8% reduction maintaining the cell below the IEC 62619 critical thermal propagation threshold.

The device architecture offers several operational advantages over active suppression systems: zero standby power requirement, <100 mm³ footprint enabling installation in standard rack spacing, post-activation debris contained within the triggered module without affecting adjacent cells, and per-unit material cost under $15 at production scale. For large-scale energy storage installations subject to UL 9540A propagation testing, distributed passive suppression provides localized containment without the infrastructure burden of centralized water or gas systems.
Practical Guidance for Buyers #
When evaluating suppliers for grid-scale or commercial energy storage projects, mechanical deformation monitoring should be a non-negotiable specification in your BMS architecture. Demand documented cell-level strain thresholds verified through controlled overcharge testing, not generic temperature or gas setpoints copied from competitor datasheets. Confirm that the BMS can execute protective actions (charge termination, contactor opening, module isolation) within 10 seconds of detecting ≥50×10⁻⁶ strain—any longer and you’ve lost the early-warning advantage. For rack-level thermal propagation resistance, specify passive suppression devices rated for your cell capacity and verify activation temperature aligns with your cell chemistry’s vent temperature (typically 80–120°C for LiFePO₄). Finally, require suppliers to provide UL 9540A test reports showing both deformation-triggered shutdown response time and thermal propagation containment under the standard’s module-to-module abuse protocols.
Honestly, most buyers focus on headline energy density and cycle count while ignoring abuse tolerance entirely—then express surprise when a single cell failure cascades into a six-figure insurance claim. The data from this research shows that deployable safety technology exists; the question is whether your procurement specification is sophisticated enough to demand it.
Need help identifying qualified suppliers with validated thermal runaway monitoring and suppression capabilities? Talk to our sourcing team →
Supplier Qualification Questions #
- What is the maximum allowable surface strain (μɛ) before your BMS initiates emergency shutdown, and can you provide overcharge test data showing the time interval between reaching 50×10⁻⁶ strain and internal short circuit for your cell model?
- At what C-rate and state-of-charge does your cell’s safety vent activate under overcharge abuse, and how many seconds elapse between vent opening and detectable CO or H₂ emission in a sealed enclosure?
- Can you supply voltage-time curves from controlled overcharge-to-failure testing for your cell capacity, including peak voltage magnitude and the repeatability of short-circuit timing across minimum 5 test samples?
- What is the verified activation temperature and discharge time of any passive thermal suppression devices integrated into your module design, and what peak cell temperature reduction (°C or %) has been demonstrated in UL 9540A-equivalent propagation testing?
- Does your BMS log and transmit real-time strain gauge data from individual cells within each module, and what is the maximum response latency from detection of 100×10⁻⁶ strain to opening of the module’s main contactor?
Sourcing Checklist #
- [ ] Supplier provides cell-level overcharge abuse test reports showing deformation onset time, gas detection time, and short-circuit time for the specific cell model quoted
- [ ] BMS technical documentation specifies mechanical strain monitoring with ≤50×10⁻⁶ detection threshold and ≤10 second protective response time
- [ ] Module design includes distributed passive suppression devices with 80–120°C activation temperature and suppressant load ≥1.5 g per Ah of cell capacity
- [ ] UL 9540A test report demonstrates module-to-module thermal propagation containment with peak adjacent cell temperature ≤150°C during controlled cell failure
- [ ] Voltage monitoring system logs and flags cells exceeding 1.2× nominal voltage (e.g., ≥4.0 V for 3.2 V LiFePO₄ cells) with datasheet-documented response protocol
- [ ] Gas detection system (if specified) monitors CO, H₂, and CO₂ with sensor placement ≤100 mm from cell vent locations and documented ≤30 second alert latency
- [ ] Safety vent activation pressure specified in cell datasheet and verified through supplier-conducted burst testing per IEC 62619 Annex C methodology
- [ ] Supplier maintains batch-level quality records showing consistent vent activation pressure within ±10% across production lots for minimum 6-month period
Key Specifications Table #
| Parameter | Recommended Value | Verification Method |
|---|---|---|
| Deformation Detection Threshold | ≥50×10⁻⁶ strain (50 microstrain) | High-temperature resistance strain gauge measurement at cell center and corner positions during controlled 0.5–1.0 C overcharge test |
| Early Warning Lead Time | ≥240 seconds before internal short circuit | Comparative timestamp analysis: deformation detection vs. voltage collapse event in overcharge-to-failure testing |
| Peak Temperature Reduction (with suppression) | ≥25% vs. unprotected baseline | Thermocouple array measurement comparing suppressed vs. unsuppressed cell thermal runaway under identical abuse conditions per UL 9540A |
| Passive Suppression Activation Temperature | 80–120°C (LiFePO₄ chemistry) | Thermal trigger membrane rupture testing with controlled temperature ramp at 5°C/min heating rate |
| Gas Emission Lead Time (CO/H₂) | 3–164 seconds before vent opening | In-situ gas analyzer with sampling inlet positioned ≤50 mm from safety vent, time-synchronized to high-speed camera vent observation |
Can’t find a supplier meeting these specs? Submit your requirements and we’ll match you within 48 hours.
Frequently Asked Questions #
Why does deformation appear before gas emission during overcharge?
Internal gas generation from SEI breakdown and lithium-electrolyte reactions begins immediately when overcharge starts, creating pressure that deforms the aluminum casing. However, gases remain trapped inside until vent activation. Strain gauges detect the mechanical deformation caused by this internal pressure buildup, while external gas sensors only respond after the vent opens and releases gases into the module enclosure—a difference of 4–15 minutes depending on charge rate.
Can voltage monitoring alone provide adequate early warning for thermal runaway?
No. Voltage behavior at thermal runaway varies unpredictably across cell manufacturers, capacities, and charge rates. Testing showed peak voltages ranging from 19 V to 65 V and time-to-failure spanning 343 to 3,000 seconds for cells all meeting the same nominal specifications. Without cell-specific calibration data from controlled abuse testing, voltage thresholds produce either excessive false alarms or dangerously late detection.
What causes the temperature difference between 20 Ah and 100 Ah cells under identical overcharge conditions?
Larger cells contain more total energy and greater thermal mass, resulting in higher absolute heat generation during runaway reactions. The 100 Ah cell reached 342°C versus 222°C for the 20 Ah cell, even though both were charged at the same 0.5 C rate. This 54% temperature increase directly correlates with the 5× capacity difference and emphasizes why thermal management systems must be sized according to worst-case cell capacity in the installation.
How do passive suppression devices compare to water deluge systems for UL 9540A compliance?
Passive devices offer three practical advantages: no electrical infrastructure (pumps, valves, power supplies), no risk of creating secondary short circuits through water intrusion, and localized containment that doesn’t affect adjacent modules. The tested B180 device reduced peak temperature by 28% using only 180 grams of dry suppressant, achieving thermal propagation prevention without the maintenance burden and failure modes inherent to active water systems. For distributed installations where each rack requires independent protection, passive devices significantly reduce system complexity.
Should procurement specifications require both gas detection and deformation monitoring?
Yes, as redundant layers. Deformation monitoring provides the earliest possible warning (4–15 minutes before critical failure), allowing time for controlled shutdown or load transfer. Gas detection serves as secondary confirmation once the vent opens and validates that the BMS correctly interpreted the deformation signal. In our evaluation of suppliers for commercial energy storage projects across Southeast Asia and the Middle East, we specify both monitoring methods with the requirement that deformation triggers protective action while gas detection activates suppression systems—ensuring defense-in-depth against thermal propagation.
Published by compactbess.com Technical Team | Request a sourcing quote
Data source: Multi-Parameter Characterization and Suppression of Overcharge-Induced Thermal Runaway in Lithium Iron Phosphate Energy Storage Batteries, J. Tang et al., Journal of the Electrochemical Society, 2024


