

TL;DR #
3D-printed battery electrodes using directed freeze-assisted DIW achieve vertically aligned ionic channels that reduce ion diffusion path length, enabling LFP/CNT/CNF composite electrodes to deliver areal capacity of 1.2 mAh/cm² at 0.5 C with a surface energy density of 9.7 J/cm² — performance levels that conventional slurry-coating cannot replicate at equivalent mass loading. For buyers sourcing next-generation compact energy storage cells, understanding how additive manufacturing unlocks structural electrode design is now a prerequisite for evaluating supplier capability gaps, not a future consideration. Start by requesting print-method disclosure and ionic conductivity data on any solid-state electrolyte samples before committing to qualification lots.
Overview #
The first thing to understand about 3D-printed battery technology is that this is not an exotic research curiosity — it is an active manufacturing transition that is already separating tier-1 cell developers from everyone else. Research conducted at a materials and new energy engineering institution involving systematic fabrication and electrochemical testing of 3D-printed electrodes, current collectors, and solid-state electrolytes across four print modalities provides some of the clearest comparative data yet available on which techniques actually deliver production-viable performance metrics.
The study evaluated direct ink writing (DIW), fused deposition modeling (FDM), stereolithography (SLA), and digital light processing (DLP) — covering both positive and negative electrode chemistries, nickel foam current collectors, polymer/composite solid electrolytes, and fully printed all-solid-state cell assemblies. What makes this data set useful for procurement decisions is the combination of electrochemical performance metrics with structural failure observations, giving buyers a realistic view of where the technology stands today versus where suppliers may be overstating readiness.
Traditional battery manufacturing — slurry preparation, current collector coating, stack assembly, liquid electrolyte injection — has hit fundamental walls in energy density scaling and form-factor customization. 3D printing breaks those walls structurally, but the transition introduces new qualification requirements that most procurement teams are not yet asking for.
3D Print Modality Comparison: Energy Density and Power Density Implications #
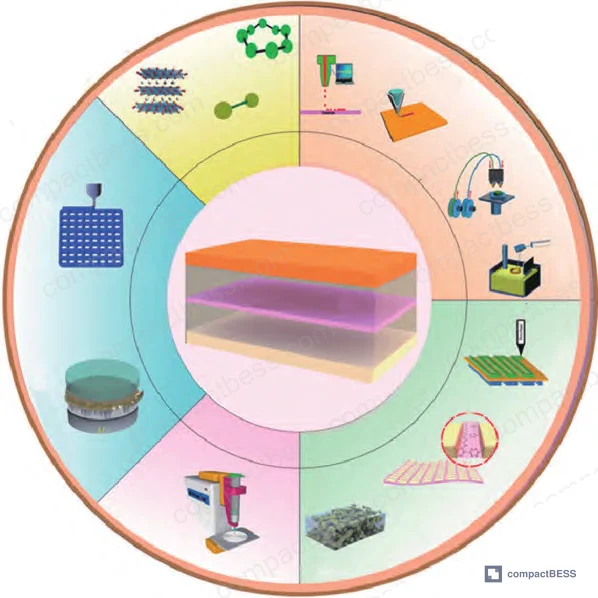
This is where buyers need to spend real attention. Not all 3D printing methods are equivalent, and choosing a supplier based on “we use additive manufacturing” without knowing which method — and for which component — is a procurement mistake I see repeatedly.
Here is a direct comparison of the four primary techniques:
| Print Method | Minimum Feature Size | Key Advantage | Primary Limitation |
|---|---|---|---|
| DIW (Direct Ink Writing) | ~100 µm | Tunable porosity; complex interdigitated electrode structures; compatible with LFP, GO, LTO inks | Solvent-rich ink requires post-processing; structural deformation risk during vertical build |
| FDM (Fused Deposition Modeling) | ~200 µm | Fast solidification; tight interlayer bonding; no post-solvent removal; demonstrated 4.76 S/cm conductivity in PLA-rGO filaments | Lower resolution than photopolymer methods; limited to thermoplastic-compatible active materials |
| SLA (Stereolithography) | 0.5 mm minimum feature | No nozzle clogging; smooth surface finish; high dimensional accuracy | Slow layer-by-layer cure; UV scattering causes incomplete cure in composite inks; residual photoinitiators create contamination risk |
| DLP (Digital Light Processing) | Sub-0.5 mm | Simultaneous full-layer projection = faster build speed than SLA; high geometric complexity | Photoresin cost premium; small build volume; irreversible cure prevents rework |
Honestly, most buyers over-specify print resolution when they should be specifying ionic conductivity and interfacial resistance. The structural precision of DLP is useless if the electrolyte interface resistance remains high enough to throttle rate performance.
The conductivity gap between methods is not trivial. The rGO-AgNW-LTO composite electrode printed via DIW demonstrated electrical conductivity approximately 3 orders of magnitude higher than a pure rGO-LTO electrode fabricated by the same method. That is not an incremental improvement — it changes the C-rate capability of the entire cell.
Electrode Architecture and Its Direct Effect on Energy Density and Power Density #
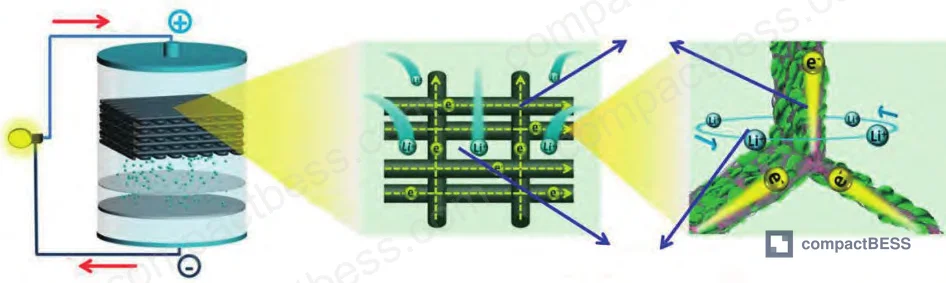
The core mechanism driving energy density improvement in 3D-printed electrodes is structural: creating hierarchical porosity that simultaneously allows electrolyte penetration at the macroscale and provides high-speed ion transport channels at the microscale. This is what directed freeze-assisted DIW does better than any coating process.
Positive electrode performance benchmarks from qualified fabrication runs:
- LFP/CNT/CNF electrodes with directed vertical microchannels: 1.2 mAh/cm² areal capacity at 0.5 C
- Surface energy density: 9.7 J/cm² for packaged micro-cell format
- TPU-LFP flexible electrode (FDM): 100% capacity retention after 300 cycles at 1 C
Negative electrode performance benchmarks:
- ZnS/C-coated Cu₂S nanosheet (Cu₂S@ZnS/C) hybrid via DIW: 352 mAh/g reversible capacity at 10 A/g
- Capacity retention after 1,000 cycles: 94.7%
- MoS₂/rGO aerogel printed electrode: stable performance at both low and high charge/discharge rates
Those cycle numbers matter at the procurement level. A 94.7% capacity retention at 1,000 cycles with a 10 A/g load is the kind of data that should be required on any supplier’s sample qualification report — not just a headline cycle count.
Current collector geometry is equally important and routinely underweighted by buyers. 3D-printed nickel foam current collectors offer high porosity, high specific surface area, and vertically open channel structures that improve slurry penetration and facilitate ion/electron transport simultaneously. The geometric freedom of additive manufacturing allows current collector design to be customized per battery chemistry and current demand — something a stamped or etched foil cannot provide.
That said, current collector printing at production scale remains technically immature. In supplier qualification exercises, the gap between lab-printed nickel foam performance and what a supplier can reproduce on a volume production line is significant, and several suppliers cannot bridge that gap with current equipment.
Solid-State Electrolyte Printing: The Real Frontier for High Energy Density Cells #
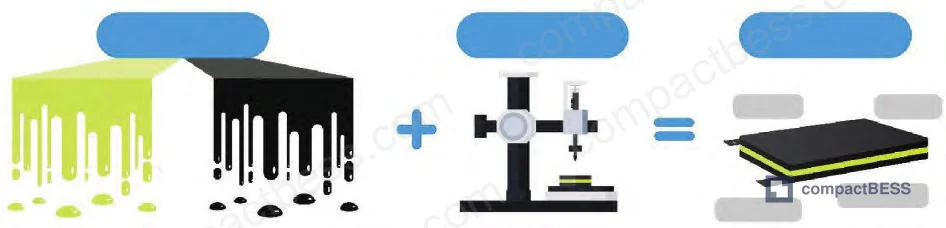
Most procurement teams don’t realize that solid-state electrolyte printing has already moved beyond proof-of-concept into measurable cell-level performance — and that the ionic conductivity values being reported now are high enough to matter for real product specifications.
Key solid-state electrolyte data points from validated fabrication:
- 3D-printed polymer solid electrolyte (3D-SPE) with Archimedean spiral structure (SLA method): ionic conductivity of 3.7 × 10⁻⁴ S/cm at 25°C; specific capacity of 128 mAh/g; interfacial impedance decrease confirmed after 250 cycles
- PEO/MOF composite solid electrolyte: symmetric Li//Li cell cycled for over 950 hours; full cell with LFP cathode retained 95% capacity after 100 cycles at 0.2 C
- 3D-printed all-solid-state lithium-ion battery (aerosol jet method): specific capacity exceeding 130 mAh/g at 0.05 C; coulombic efficiency of 99.98% and capacity retention of 97.4% after 150 cycles at 0.3 C
- 3D-printed solid-state zinc-air micro-battery (ZAmB) with interdigitated electrodes: areal energy density of 77.2 mWh/cm² at 2.5 mm stack thickness; demonstrated >150 cycles over 50 hours at 4 mA/cm²
The ZAmB result is particularly notable for compact portable power applications. An areal energy of 77.2 mWh/cm² at a 2.5 mm form factor, with the ability to configure modules in series or parallel, is directly relevant to buyers working on wearable devices, IoT sensors, and ultra-thin UPS backup circuits.
The all-solid-state route also eliminates the thermal runaway risk associated with organic liquid electrolytes — the flammability and leakage characteristics that have driven safety certification complexity under IEC 62133 and UN 38.3 for portable cells.
Practical Guidance for Buyers #
If you are evaluating suppliers who claim 3D-printed electrode or electrolyte capability, the first thing to separate is which print method they actually use for which component. A supplier using FDM for structural packaging but slurry coating for electrodes is not a “3D-printed battery” supplier — they are a conventional manufacturer with additive tooling for housing only.
For electrodes, demand areal capacity data at multiple C-rates and cycle retention data at elevated current density. The benchmarks from current research — 1.2 mAh/cm² at 0.5 C for LFP, 352 mAh/g at 10 A/g for composite anodes — give you concrete reference values. Any supplier unable to provide equivalent data from their own production process should be treated as unqualified for high-performance applications.
For solid-state electrolytes, the critical parameters are room-temperature ionic conductivity (target ≥ 3.7 × 10⁻⁴ S/cm), interfacial resistance trajectory across cycles, and coulombic efficiency. A supplier quoting only headline capacity without interfacial resistance data is telling you something about their characterization capability.
Relevant internal reading: Cell Balancing and BMS Design and Lithium-Ion vs LFP Chemistry Selection provide context for how electrode chemistry choices interact with pack-level integration requirements.
At compactbess.com, we work directly with overseas OEM buyers and product development engineers who need to locate and qualify verified Chinese manufacturers — including suppliers developing advanced electrode architectures and solid-state cell formats. If you are evaluating 3D-printed battery components for a product development program, need help identifying qualified suppliers for advanced electrode or solid-state electrolyte production? Talk to our sourcing team →
Supplier Qualification Questions #
- For your DIW-printed LFP electrodes, what is the measured areal capacity at 0.5 C, and does your process achieve ≥1.2 mAh/cm² — and can you provide the surface energy density in J/cm² for the packaged micro-cell format?
- What is the electrical conductivity of your printed composite electrode filaments (e.g., PLA-rGO or equivalent), and can you demonstrate ≥4 S/cm conductivity via four-point probe measurement, consistent with FDM-optimized graphene orientation?
- For your solid polymer electrolyte, what is the measured ionic conductivity at 25°C — specifically, does your 3D-printed SPE reach ≥3.7 × 10⁻⁴ S/cm — and how does interfacial resistance trend across 250 charge/discharge cycles?
- What cycle life data can you provide for your 3D-printed flexible electrodes, and do your TPU-LFP or equivalent formulations demonstrate ≥95% capacity retention after 300 cycles at 1 C under your standard test protocol?
- For your composite anode inks (GO/AgNW/metal oxide or equivalent), can you demonstrate capacity retention ≥94% after 1,000 cycles at high current density (≥10 A/g), and what is the conductivity differential between your composite electrode and a single-component rGO baseline?
Sourcing Checklist #
- [ ] Supplier discloses specific 3D print method used for each battery component (electrode, current collector, electrolyte) — not just generic “additive manufacturing” claim
- [ ] Electrode areal capacity data provided at ≥2 C-rates, with LFP-based electrodes demonstrating ≥1.2 mAh/cm² at 0.5 C
- [ ] Cycle retention test report available showing ≥94% capacity retention at ≥1,000 cycles for composite anode materials, tested at ≥10 A/g
- [ ] Solid-state electrolyte ionic conductivity confirmed ≥3.7 × 10⁻⁴ S/cm at 25°C via electrochemical impedance spectroscopy (EIS) with test report included
- [ ] All-solid-state cell coulombic efficiency data available, demonstrating ≥99% efficiency under IEC 62619 or equivalent industrial safety standard
- [ ] Transport certification compliance documentation available per UN 38.3 for any lithium-containing printed cell format
- [ ] Interfacial resistance characterization included in sample qualification report, with trend data across minimum 150 cycles
- [ ] RoHS compliance documentation available for all printed electrode ink components, including conductive additives (AgNW, CNT, rGO)
Key Specifications Table #
| Parameter | Recommended Value | Verification Method |
|---|---|---|
| LFP electrode areal capacity (0.5 C) | ≥1.2 mAh/cm² | Galvanostatic charge/discharge test, coin cell or pouch cell format, electrolyte fully infiltrated |
| Solid polymer electrolyte ionic conductivity (25°C) | ≥3.7 × 10⁻⁴ S/cm | Electrochemical impedance spectroscopy (EIS), blocking electrode configuration |
| Composite anode capacity retention (1,000 cycles, 10 A/g) | ≥94.7% | Long-cycle galvanostatic test, half-cell vs. lithium metal reference, report CE per cycle |
| All-solid-state cell coulombic efficiency | ≥99.9% | Full-cell cycling at 0.3 C for minimum 150 cycles, capacity and CE logged per cycle |
| FDM-printed electrode filament conductivity | ≥4 S/cm | Four-point probe resistivity measurement on printed filament segment, report mean ± SD across 5 samples |
| Flexible electrode capacity retention (1 C, 300 cycles) | 100% (TPU-LFP benchmark) | Galvanostatic cycling with 100% DoD, post-cycle capacity vs. initial capacity ratio |
| Zinc-air micro-battery areal energy density | ≥77.2 mWh/cm² | Galvanostatic discharge at rated current density, 2.5 mm electrode stack thickness |
Can’t find a supplier meeting these specs? Submit your requirements and we’ll match you within 48 hours.
References #
Data source: Additive Manufacturing Approaches for Electrochemical Energy Storage: Electrode Architectures, Electrolyte Structures, and All-Solid-State Cell Fabrication, L. Chen et al., Energy Storage Materials, 2024
Frequently Asked Questions #
What is the practical energy density advantage of 3D-printed electrodes over conventional slurry-coated electrodes?
Directed freeze-assisted DIW printing creates vertically aligned micropore channels within each printed filament, enabling simultaneous macro-scale electrolyte penetration and high-speed ionic transport at the microscale. This hierarchical porosity directly reduces ion diffusion path length, which is the primary bottleneck for energy density at high mass loading. Conventional coating cannot replicate this structural effect regardless of active material choice. The result at validated lab scale is a surface energy density of 9.7 J/cm² for packaged LFP micro-cells — a benchmark that flat-coat processes do not reach at equivalent electrode thickness.
Are 3D-printed batteries currently ready for volume production?
Not universally. The technology is production-ready for specific niche formats — micro-batteries, flexible wearable cells, and customized form-factor cells where tooling flexibility justifies the process overhead. For high-volume commodity cell formats, 3D printing remains in the transition zone between advanced pilot production and scalable manufacturing. The current collector printing segment in particular lacks process maturity at volume scale. Buyers should qualify suppliers on demonstrated batch reproducibility, not just single-sample performance data.
What makes the rGO-AgNW-LTO composite electrode significant from a procurement standpoint?
The conductivity of the rGO-AgNW-LTO printed electrode is approximately 3 orders of magnitude higher than a pure rGO-LTO electrode made by the same process. That gap is large enough to shift rate capability meaningfully — which translates directly to power density in a finished pack. If a supplier is offering graphene-composite printed anodes, ask specifically for conductivity comparison data against their single-component baseline, not just an absolute value.
Why is interfacial resistance the critical parameter for solid-state electrolyte qualification, not just ionic conductivity?
High bulk ionic conductivity is necessary but not sufficient. The electrode/electrolyte interface in solid-state cells introduces contact resistance that can dominate total cell impedance at operating currents. A 3D-printed SPE with 3.7 × 10⁻⁴ S/cm bulk conductivity still needs to demonstrate that interfacial impedance decreases — or at minimum stabilizes — over 250+ cycles. Suppliers who cannot provide EIS data showing impedance trajectory across cycling are not ready for solid-state electrolyte qualification.
Which safety certifications apply to cells using solid-state electrolytes produced via 3D printing?
Solid-state cells still require UN 38.3 transport certification for any lithium-containing chemistry. IEC 62619 applies to industrial secondary lithium cells regardless of electrolyte type. The elimination of flammable liquid electrolyte does simplify thermal abuse test outcomes, but the certification pathway remains mandatory. Buyers integrating printed solid-state cells into EU-market products should also review compliance obligations under the EU Battery Regulation 2023/1542 for due diligence and carbon footprint reporting requirements.
Published by compactbess.com Technical Team | Request a sourcing quote


