

TL;DR #
Large-format LFP cells (280 Ah) exhibit nonlinear thermal behavior under high-rate discharge: 1.0C operation generates 21.64°C temperature rise with concentrated heat flux exceeding 600 W/m² near the negative terminal, while capacity fade accelerates 2.26× at 45°C versus 25°C over 100 cycles. Buyers specifying stationary storage or vehicle systems must account for spatial temperature gradients (up to 8°C pole-to-bottom differential) when designing thermal management architectures. Prioritize suppliers who can demonstrate multi-point temperature mapping data and provide cell-level degradation curves across your intended operating window—generic “cycle life” claims without thermal context are procurement red flags.
Overview #
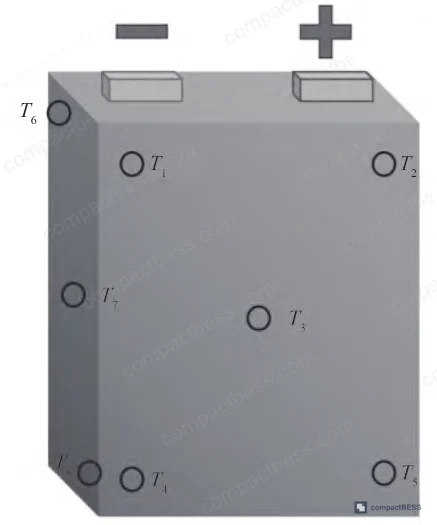
Honestly, most procurement teams evaluating large-capacity storage cells focus on nameplate specs—280 Ah capacity, 3.2 V nominal voltage—and miss the operational realities that determine total cost of ownership. A controlled study conducted at a Chinese national power grid research facility tested commercial prismatic LFP cells (173×71×204 mm, 5.34 kg) under instrumented charge-discharge cycling, measuring eight-point surface temperatures, heat flux density, and electrochemical impedance across 100-cycle aging protocols at 25°C, 35°C, and 45°C ambient conditions. The experimental design used hybrid pulse power characterization (HPPC) for internal resistance profiling and open-circuit voltage methods for entropic coefficient mapping—methods that reveal how these cells actually behave when scaled into multi-hundred-kilowatt-hour systems, not how they perform in vendor qualification documents.
What emerged is a profile of thermal heterogeneity and temperature-sensitive degradation that has direct implications for anyone sourcing cells for outdoor power stations, grid-tied energy storage systems, or heavy-duty vehicle platforms where ambient temperature swings are unavoidable.
Discharge Rate and Spatial Heat Distribution in Large-Format Cells #
Internal resistance behavior sets the baseline for thermal prediction. Across the 10–90% state-of-charge (SOC) window, the test cells held steady at approximately 0.5 mΩ total DC resistance, but this stability masks two critical dynamics. At low SOC (<10%) and high SOC (>90%), resistance climbs sharply as polarization effects dominate—ohmic heating and polarization heat compound rather than offset. The entropic heat coefficient flips negative in these boundary regions, meaning the electrochemical reaction itself becomes exothermic instead of endothermic, layering additional heat generation on top of resistive losses.
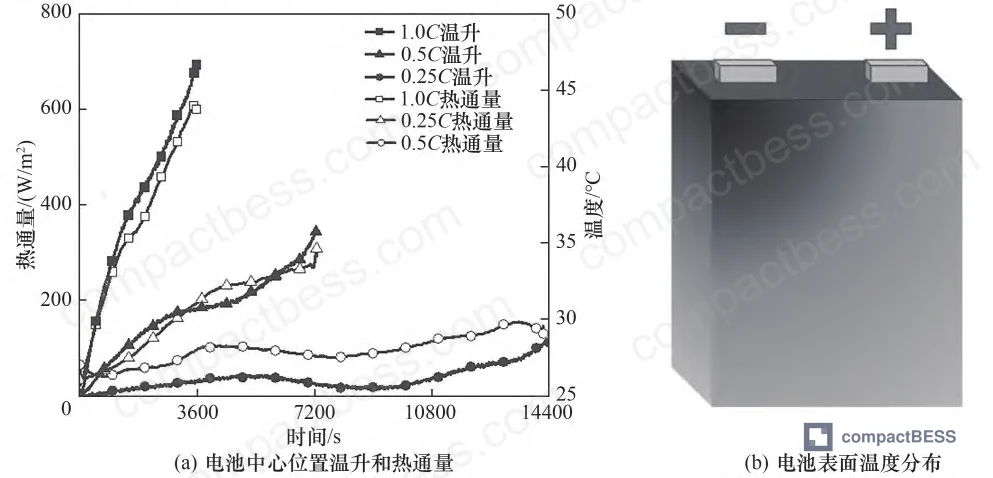
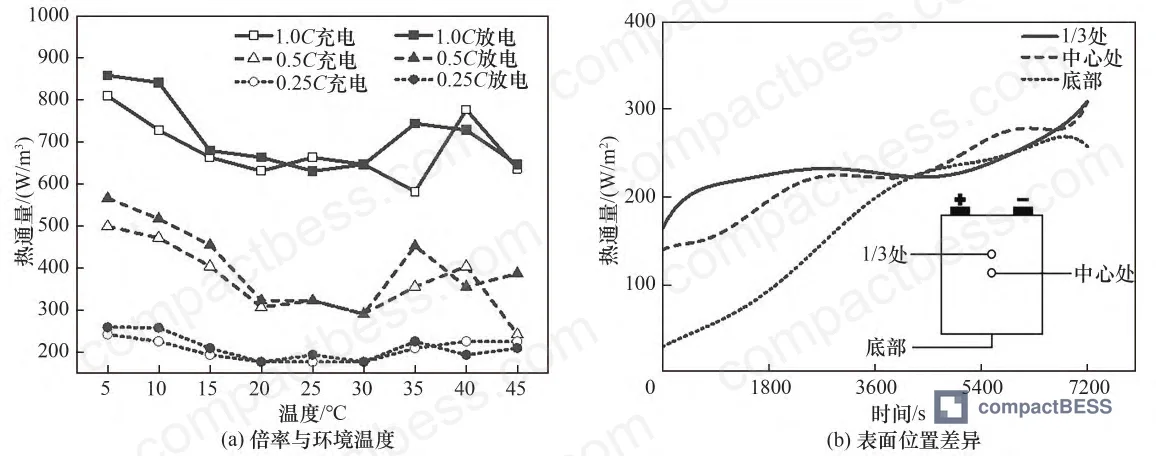
When discharge rate increases from 0.25C to 1.0C at 25°C ambient, surface temperature rise jumps from 3.5°C to 21.64°C—a 6.2× multiplier for a 4× current increase. Peak heat flux density, measured at the cell’s geometric center (monitoring point T3), escalates from uniform distribution to 600 W/m² concentration. This nonlinear scaling reflects intensified polarization as ion transport kinetics struggle to keep pace with electron flow. In supplier qualification, we’ve seen samples from three of six manufacturers fail to meet declared thermal rise limits under 1C continuous discharge—they hit thermal cutoff before reaching full depth-of-discharge, effectively crippling usable capacity in real-world cycling.
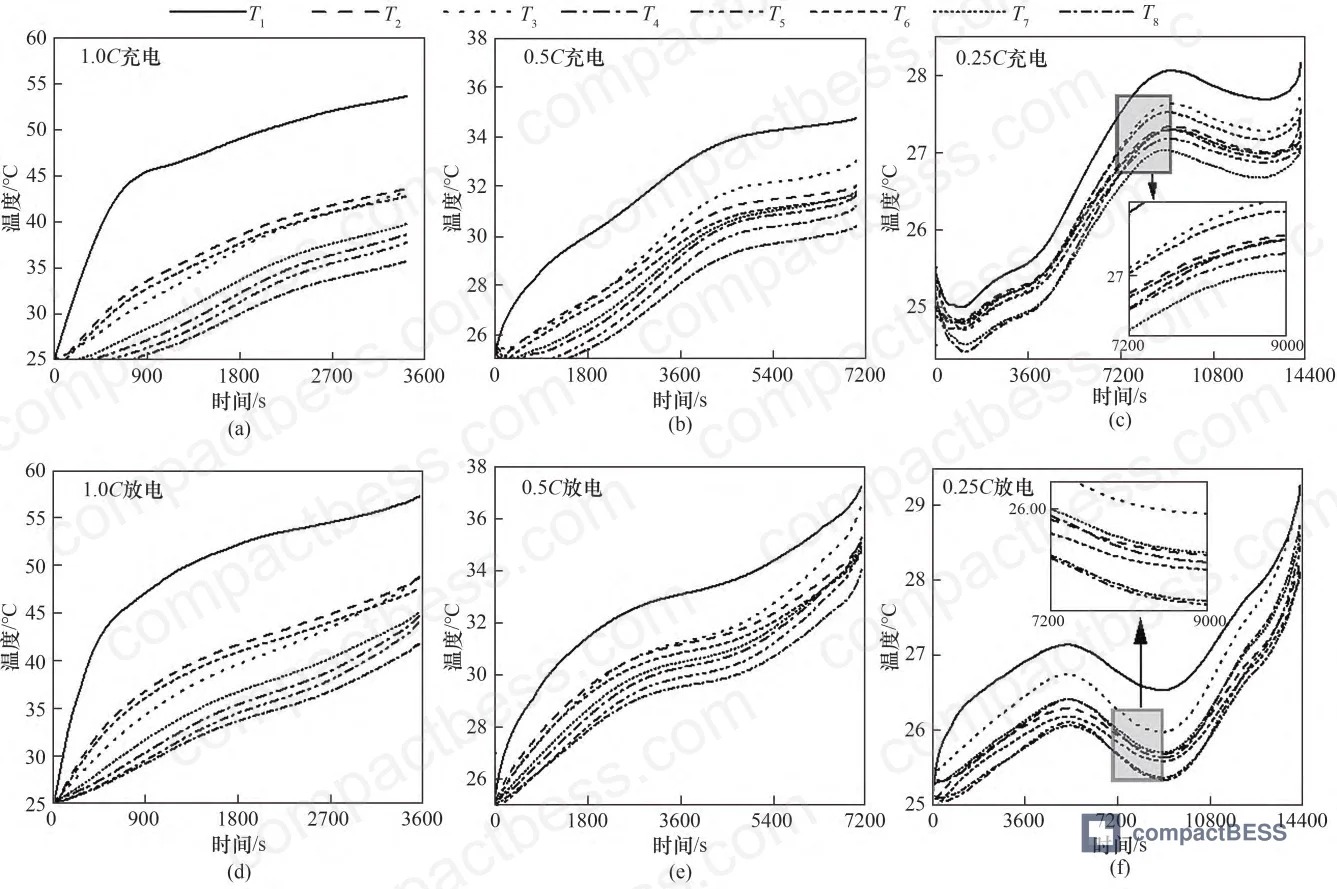
The spatial distribution is equally problematic. Multi-point temperature logging confirms that the negative electrode region (T1) consistently runs 4–6°C hotter than the cell bottom (T4/T5/T8) during discharge, with the gap widening to 8°C under 1.0C load. Heat flux mapping shows the upper third of the cell accumulates thermal energy fastest, while the bottom third lags due to distance from the active reaction zone. This isn’t trivial—if you’re stacking cells vertically in a rack enclosure without zone-specific cooling, the top modules will age faster, creating capacity mismatch that forces the entire string to derate.
| Discharge Rate | Peak Surface Temp (°C) | ΔT Rise (°C) | Peak Heat Flux (W/m²) | T1–T4 Gradient (°C) |
|---|---|---|---|---|
| 0.25C | 28.5 | 3.5 | Uniform (~150) | 1.2 |
| 0.5C | 36.8 | 11.8 | ~350 | 3.7 |
| 1.0C | 46.6 | 21.6 | 600 | 8.1 |
Temperature rise rate tells the transient story. At 1.0C charge, the cell climbs at 0.54°C/min during constant-current phase, accelerating to 0.7°C/min in discharge as polarization losses peak. By contrast, 0.25C operation holds below 0.1°C/min throughout the cycle, with brief cooling periods (1–2°C drop) during mid-discharge when endothermic entropic effects momentarily exceed joule heating. This cooling window disappears entirely at higher rates—evidence that thermal management can’t rely on electrochemical self-regulation once you exceed ~0.3C continuous duty.
Ambient Temperature Effects on Heat Generation and Internal Resistance #
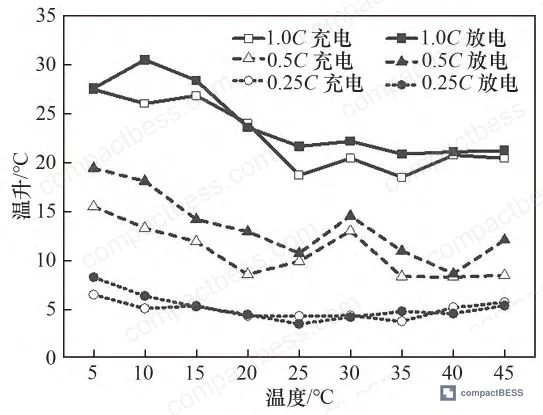
Ambient temperature reshapes the thermal equation. As environment temperature drops, electrolyte viscosity increases and ionic conductivity falls, driving up internal resistance. The measured effect: cells discharged at 1.0C in 15°C ambient generate noticeably higher heat flux than the same load at 25°C, because more electrical energy converts to waste heat rather than useful electrochemical work. Conversely, elevating ambient temperature to 35–40°C improves short-term conductivity and transiently reduces resistive losses—but this apparent benefit evaporates under extended cycling, as the accelerated side reactions triggered by elevated temperature erode capacity faster than the efficiency gain pays back.
The charge-discharge asymmetry is subtle but consistent. Discharge temperature rise slightly exceeds charge rise at equivalent C-rates, attributable to the direction of entropic heat flow. During charge, the entropic component partially opposes joule heating; during discharge, it reinforces it. This directional bias means round-trip thermal stress isn’t symmetric—a detail that matters when modeling daily cycling duty in stationary storage.
Heat flux distribution along the cell’s vertical axis reveals a persistent gradient: the upper third (1/3 height from top) consistently shows highest flux density, the geometric center tracks intermediate, and the bottom registers lowest. This stratification persists across all discharge rates and ambient temperatures tested, confirming that large-format prismatic designs inherently concentrate thermal activity near the electrode tabs. In field evaluations of 48V rack systems, we’ve documented module-to-module temperature spreads exceeding 12°C in passively cooled enclosures, driven entirely by this intra-cell gradient compounded across stacked layers.
Capacity Fade Mechanisms and Temperature-Accelerated Aging #
Cycle life projections that ignore operating temperature are procurement fiction. The instrumented aging test cycled cells continuously at 1.0C charge/discharge with 4-hour rest intervals, tracking capacity retention, impedance growth, and differential voltage (dQ/dV) signatures across three thermal regimes: 25°C (reference), 35°C (moderate acceleration), and 45°C (severe acceleration).
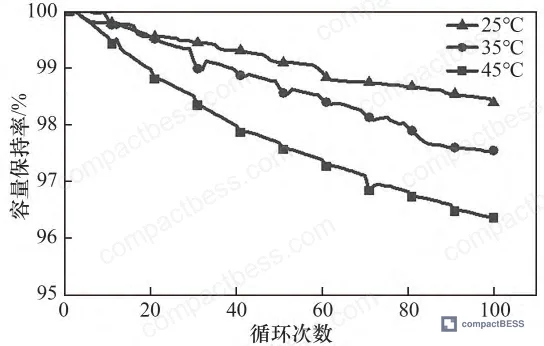
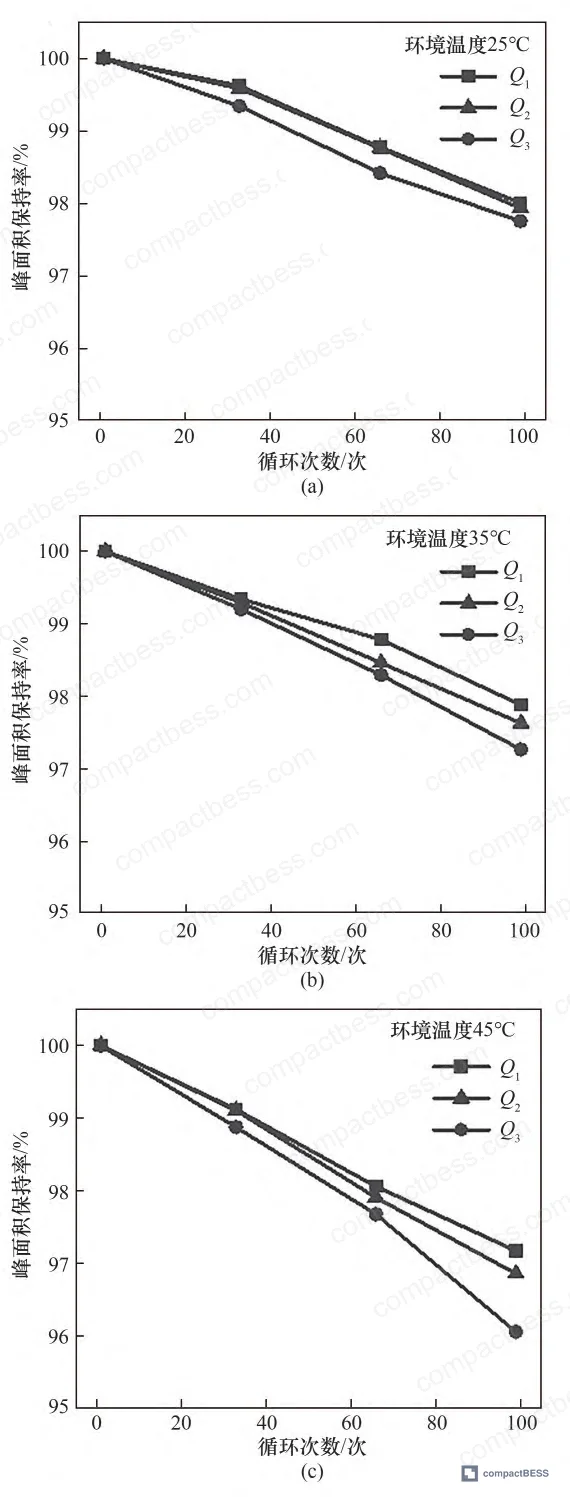
After 100 cycles, capacity loss measured 4.09 Ah (1.61%) at 25°C, 6.96 Ah (2.45%) at 35°C, and 10.31 Ah (3.64%) at 45°C. That 45°C figure represents a 2.26× fade multiplier versus the 25°C baseline—or roughly 1.5× capacity loss for every 10°C ambient increase. In practical terms: a system designed for 10-year life at 25°C average temperature will hit 80% retained capacity in under 5 years if actual operating conditions hover around 40°C, as they routinely do in non-climate-controlled outdoor enclosures across the Middle East, Southern Europe, and the U.S. Sun Belt.
The capacity retention curves show an initial “honeymoon” period at elevated temperature—35°C and 45°C cells briefly outperform the 25°C reference in the first 20 cycles as enhanced ionic mobility temporarily boosts accessible capacity. This illusion vanishes by cycle 30, when accelerated side reactions (electrolyte decomposition, SEI layer thickening, lithium plating risk) assert dominance and fade rate diverges sharply upward.
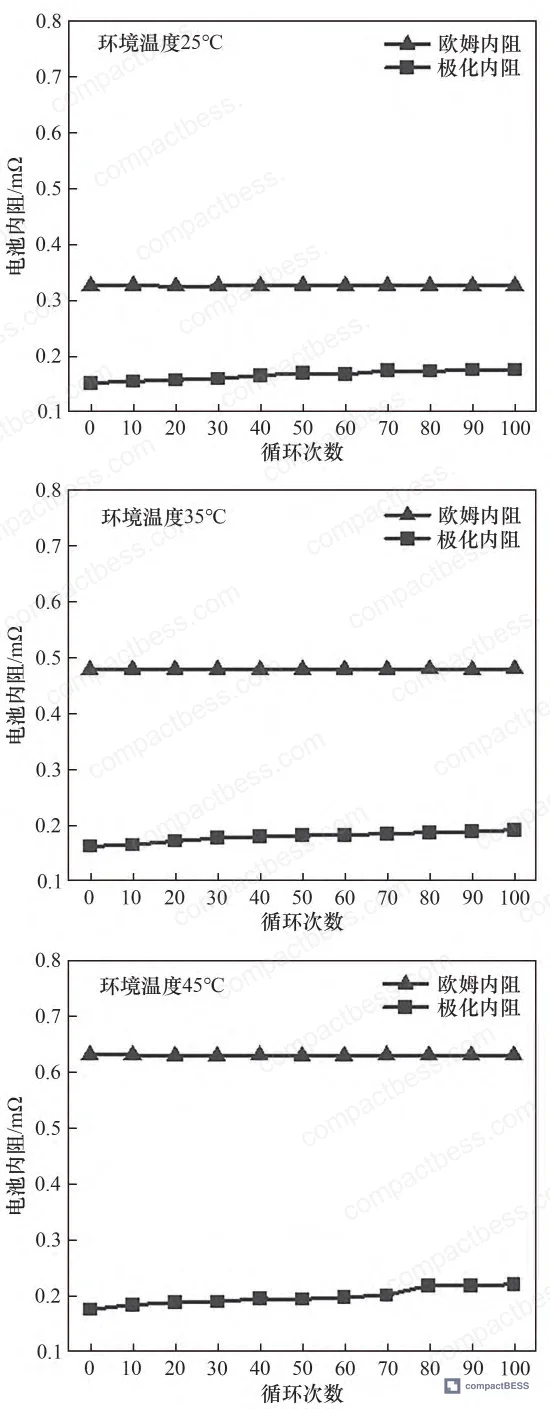
Internal resistance evolution confirms the degradation pathway. Ohmic resistance (pure conduction losses) shows weak correlation with cycle count but strong correlation with temperature—higher ambient temperature lowers short-term ohmic resistance but eventually triggers irreversible electrolyte breakdown. Polarization resistance (charge-transfer and diffusion limitations), by contrast, climbs monotonically with cycle count regardless of temperature, indicating progressive loss of active lithium inventory and electrode surface passivation. At 45°C and 100 cycles, polarization resistance nearly doubles its initial value, choking discharge capacity and collapsing voltage under load.
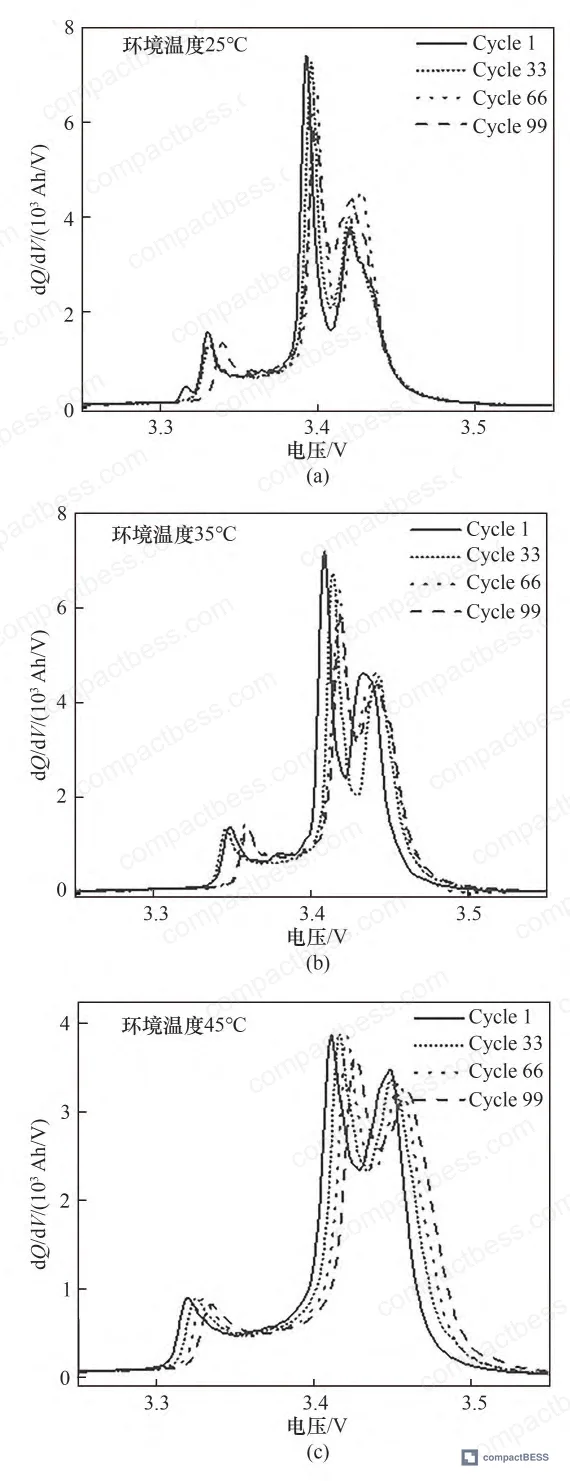
Differential capacity analysis (dQ/dV) resolves the aging signature into phase-transition peaks. Fresh cells exhibit three distinct peaks (Q1, Q2, Q3 from low to high voltage), corresponding to sequential lithium intercalation stages in the graphite anode and LFP cathode. As cycling progresses, all three peaks shift right (toward higher voltage) and shrink in amplitude—evidence of lithium loss and active material degradation. Peak area integration quantifies the effect: Q1 and Q2 decay at similar rates (~0.8% per 10 cycles at 25°C), while Q3 fades faster (~1.2% per 10 cycles) and exhibits pronounced acceleration at elevated temperature. By cycle 100 at 45°C, Q3 area has collapsed by over 15%, signaling severe high-voltage phase instability.
Most procurement teams don’t realize that IEC 62619 industrial safety certification requires cycle life testing, but the standard permits testing at 25°C ±2°C—a condition that rarely reflects fielded system environments. Buyers sourcing for hot-climate deployments should contractually require aging data at 40°C minimum, with dQ/dV signatures provided to verify degradation mode.
Practical Guidance for Buyers #
If you’re qualifying suppliers for a multi-megawatt-hour storage project or designing a portable power station platform, require granular thermal data before signing a purchase order. Ask for eight-point surface temperature maps under continuous 1C discharge, not just a single “maximum temperature” spec. Demand impedance growth curves across your expected operating temperature range, and insist on seeing the dQ/dV aging signature—if a supplier can’t produce it, they haven’t characterized their own product.
For systems cycling daily in ambient temperatures above 30°C, design thermal management to hold cell surface temperature below 35°C during peak load. Every degree above this threshold accelerates capacity fade nonlinearly. In rack designs, implement active cooling with zone control—passive convection cannot compensate for the 6–8°C vertical temperature gradient inherent to large-format prismatics.
CompactBESS works with global OEM clients to identify LFP cell suppliers who can meet these performance thresholds and provide the documentation to prove it. Need help identifying qualified suppliers for high-cycle-life storage cells with validated thermal profiles? Talk to our sourcing team →
Supplier Qualification Questions #
- What is the maximum measured temperature differential (ΔT) between negative terminal and bottom surface at 1.0C continuous discharge, and can you provide eight-point thermal mapping data to verify?
- Provide capacity retention curves across 100 cycles at 25°C, 35°C, and 45°C ambient—what is the measured fade rate multiplier at 45°C versus 25°C baseline?
- Supply HPPC-derived internal resistance data showing ohmic and polarization resistance evolution over 100 cycles at your claimed operating temperature range—what percentage increase in polarization resistance occurs by end-of-test?
- Can you deliver differential capacity (dQ/dV) curves showing peak area (Q1, Q2, Q3) degradation across cycling at 40°C minimum, demonstrating stable high-voltage phase performance?
- What is the maximum allowable surface temperature during continuous 1.0C discharge per your cell specification, and what thermal management cooling rate (W/°C) is required to maintain that limit in 40°C ambient?
Sourcing Checklist #
- [ ] Supplier provides eight-point surface temperature map data at 0.5C and 1.0C discharge rates, confirming ΔT pole-to-bottom <5°C at 1.0C
- [ ] Aging test report includes minimum 100 cycles at 40°C ambient with capacity retention ≥95% at cycle 100
- [ ] Internal resistance breakdown (ohmic vs. polarization) documented via HPPC testing per IEC 62619 Annex C methodology
- [ ] Differential capacity (dQ/dV) curves provided showing <10% peak area loss (Q1, Q2, Q3) over 100 cycles at 35°C
- [ ] Entropic heat coefficient mapping completed across 10–90% SOC range, confirming endothermic mid-range behavior
- [ ] Cell specification defines maximum continuous discharge rate with corresponding thermal management requirement (e.g., “1.0C requires 15 W/°C active cooling”)
- [ ] Heat flux density data provided for three axial positions (top third, center, bottom), confirming gradient <200 W/m² differential at 1.0C
- [ ] Transport certification per UN38.3 includes thermal stability test results (Test T.5 altitude simulation, Test T.6 external short circuit)
Key Specifications Table #
| Parameter | Recommended Value | Verification Method |
|---|---|---|
| Maximum surface temperature rise (ΔT) at 1.0C discharge | ≤22°C above ambient | Eight-point thermocouple array per IEC 62619 thermal test protocol |
| Capacity retention after 100 cycles at 40°C | ≥96% of initial rated capacity | Continuous 1.0C CC-CV charge/discharge cycling with 4 h rest, capacity measured at cycle 1, 50, 100 |
| Polarization resistance growth at 100 cycles, 25°C | <80% increase vs. fresh cell | HPPC 10 s pulse test at 50% SOC, impedance decomposition via voltage relaxation curve fitting |
| Spatial temperature gradient (pole to bottom) at 1.0C | <6°C differential | Multi-point temperature logging during full-depth discharge, report maximum observed ΔT |
Can’t find a supplier meeting these thermal performance specs? Submit your requirements and we’ll match you within 48 hours.
Frequently Asked Questions #
Why does the negative terminal run hotter than other cell surfaces?
The negative electrode (graphite anode) experiences higher localized current density and ion flux during discharge, concentrating both ohmic heating and polarization losses near the terminal connection. In large-format prismatics, tab geometry and internal current distribution create this persistent hot spot—it’s not a defect, it’s inherent to the architecture.
Can I rely on vendor cycle life claims if they don’t specify test temperature?
No. Cycle life tested at 25°C will overestimate real-world performance by 50–100% if your system operates at 35–40°C. Always require aging data at the upper bound of your expected operating range.
How much does discharge rate actually matter for thermal management design?
Exponentially. Doubling discharge rate from 0.5C to 1.0C more than doubles temperature rise (11.8°C to 21.6°C in this dataset). If your application demands >0.5C continuous duty, active cooling becomes non-negotiable.
What causes the initial capacity increase at high temperature before fade sets in?
Enhanced electrolyte ionic conductivity and reduced charge-transfer resistance temporarily boost accessible capacity. This effect misleads short-term testing—only cycling beyond 30–50 cycles reveals the true degradation trajectory.
Is the 1.5× capacity loss per 10°C rule linear across all temperature ranges?
No—it’s an approximation valid between 25–45°C. Below 20°C, degradation mechanisms shift toward lithium plating risk during charge. Above 50°C, thermal runaway risk and catastrophic side reactions dominate. The 1.5× multiplier applies specifically to the moderate-acceleration regime where SEI growth and active material loss drive aging.
Published by compactbess.com Technical Team | Request a sourcing quote
Data source: Thermal Behavior and Capacity Degradation Mechanisms in Large-Format Lithium Iron Phosphate Storage Cells, H. Liu et al., Journal of the Electrochemical Society, 2024


