

TL;DR #
Systematic charge/discharge cycling of graphite||LiFePO₄ pouch cells across five temperature points (25–80 °C) reveals a hard degradation mechanism shift above 60 °C: Arrhenius linearity breaks down, SEI growth accelerates nonlinearly, Fe²⁺ dissolution increases dramatically, and active material cracking propagates — none of which standard accelerated-aging models at ≤60 °C will predict. For buyers specifying LFP energy storage systems, this means any supplier claiming cycle life projections derived from >60 °C accelerated tests is handing you an optimistic number built on a physically invalid model. Demand that your supplier’s accelerated cycle life data was collected at temperatures strictly below 60 °C, and cross-validate with dQ/dV capacity loss decomposition before accepting qualification results.
Overview: Why LFP Cycle Life Claims Deserve Skepticism #
Most procurement teams accept a supplier’s cycle life datasheet at face value — 3,000 cycles, 4,000 cycles, sometimes 6,000 — without asking the obvious question: at what temperature was that data generated, and does the underlying aging model hold at those conditions?
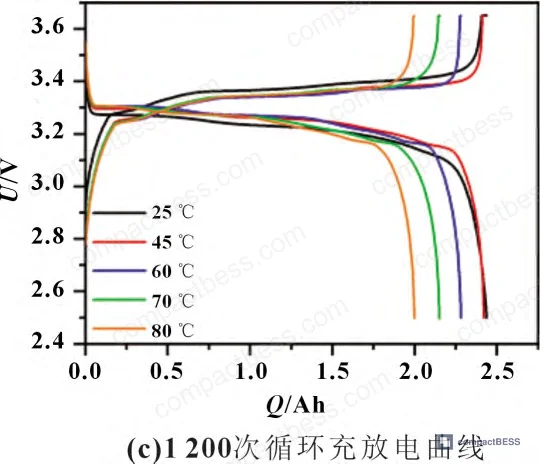
Field evaluations of LFP pack suppliers consistently expose a gap between datasheet claims and real-world performance, and the root cause is more often a flawed test protocol than a flawed cell. A research program conducted at a national-level lithium battery energy storage safety laboratory — cycling 2.5 Ah graphite||LiFePO₄ pouch cells under controlled isothermal conditions at five discrete temperatures using standardized CC-CV charge (1 C to 3.65 V, CV cutoff at 0.05 C) and 1 C discharge protocols — provides unusually clean data on exactly where the Arrhenius accelerated aging model breaks down and why. The experiment tracked 1,200 cycles per temperature set point, combined with post-mortem SEM surface and cross-section analysis, ICP-AES elemental quantification of the graphite anode, and XRD phase characterization of both electrodes after cycling. The dataset is one of the more complete multi-temperature degradation profiles for commercial-format LFP pouch cells available in recent literature.
LFP remains the dominant chemistry for stationary energy storage — structural stability, thermal safety, abundant raw materials, and cost per kWh all favor it. What the market undersells is how sensitively cycle life scales with operating temperature, particularly above thresholds that real-world BESS installations routinely touch in poorly ventilated enclosures or tropical field conditions. For buyers evaluating LFP cell packs, BMS modules, and complete storage systems, understanding the temperature-dependent degradation mechanism is not academic — it determines whether a supplier’s 10-year warranty projection is defensible or fiction.
See also: Cycle Life & Degradation and Lithium-Ion vs LFP Chemistry for broader context on chemistry-specific aging behavior.
Temperature-Dependent LFP Capacity Degradation: Where the Numbers Break #
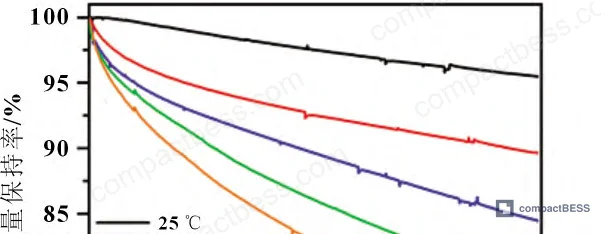
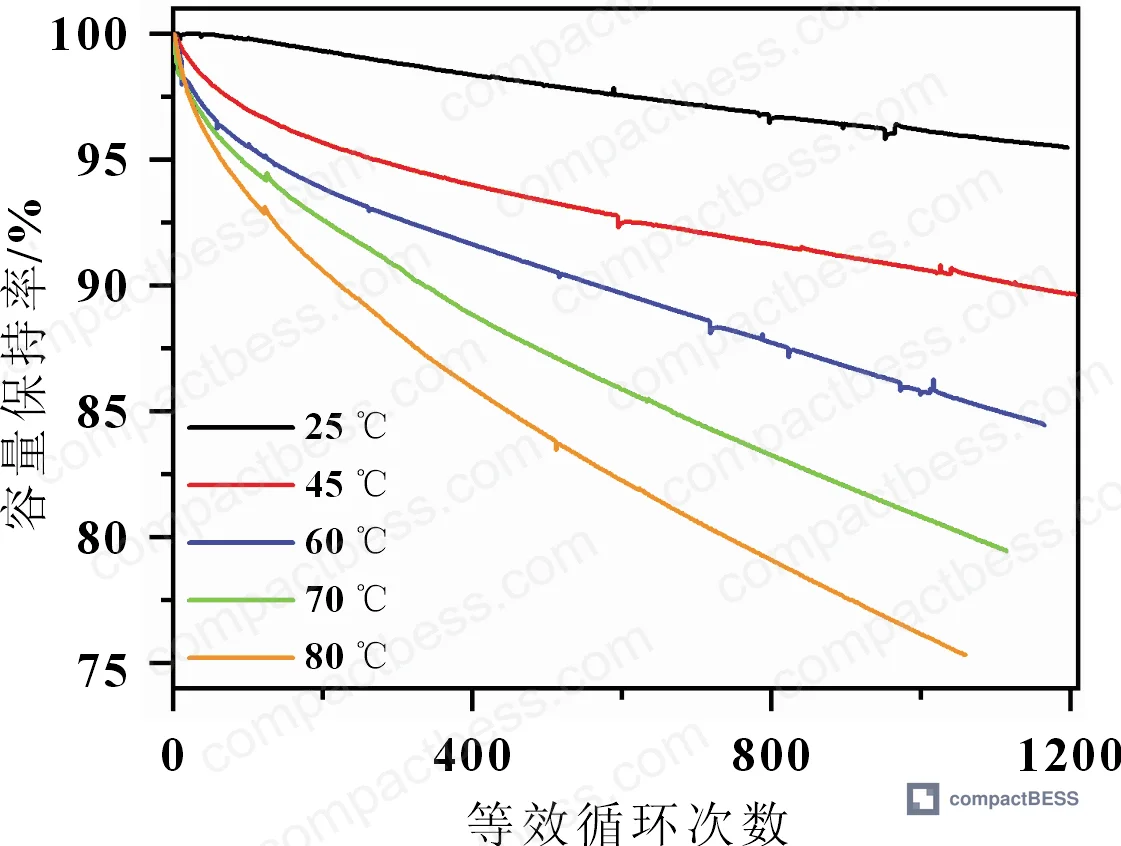
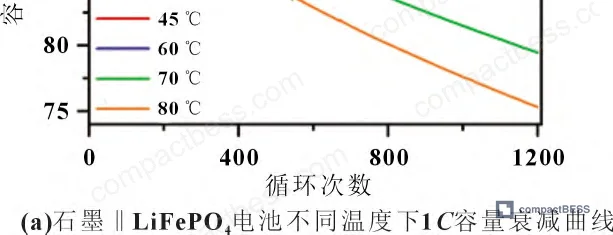
The headline result is straightforward but consequential. After 1,200 cycles at 1 C/1 C:
- 25 °C: capacity retention = 95%
- 45 °C: capacity retention = 90%
- 60 °C: capacity retention = 85%
- 70 °C: capacity retention = 80%
- 80 °C: capacity retention = 75%
Each 15–20 °C step costs roughly 5 percentage points of retention over the same cycle count. That alone should recalibrate any buyer’s risk model for high-ambient deployments.
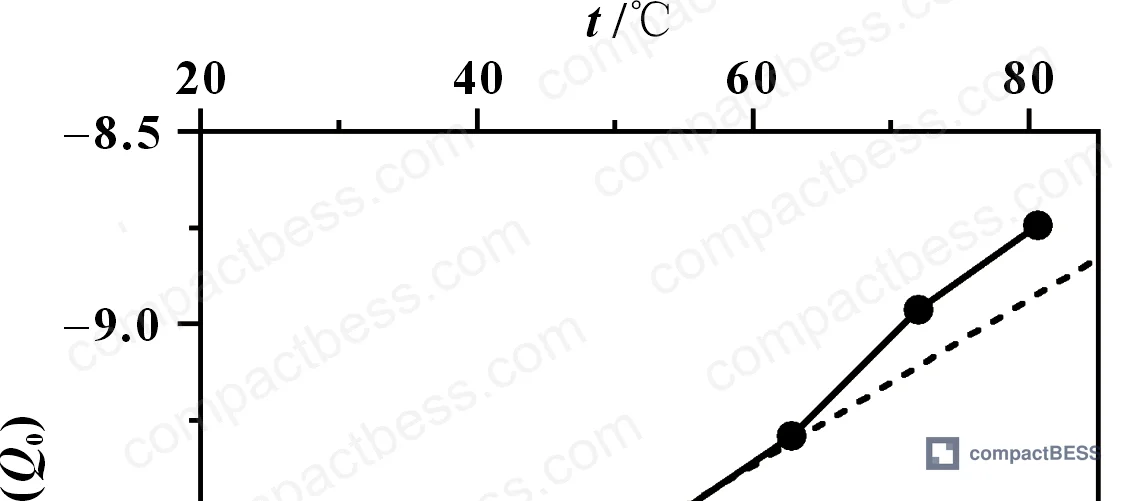
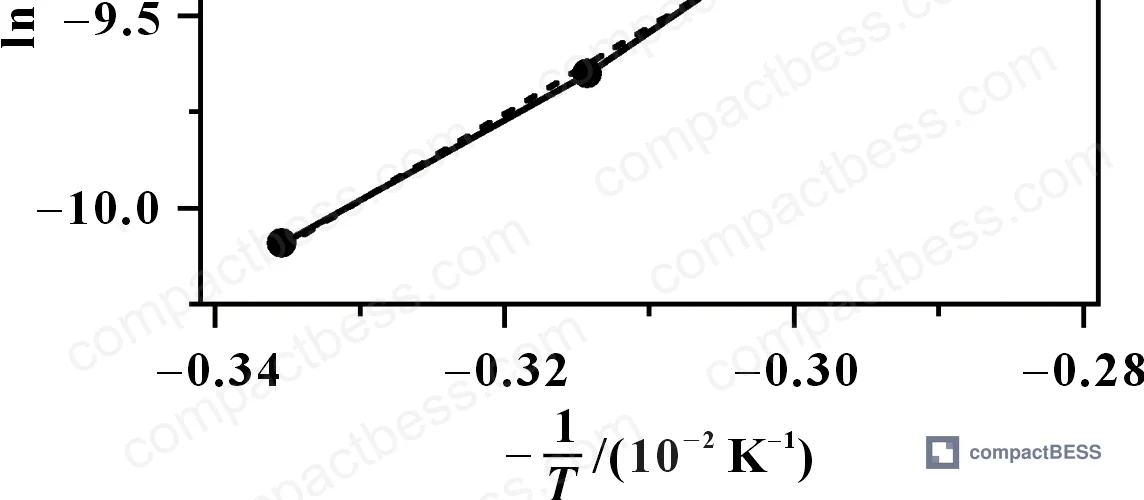
But the more important finding is what happens to the degradation mechanism, not just the rate. Using Arrhenius analysis — plotting ln(Q₀) against −1/T — the data at 25, 45, and 60 °C falls on a clean linear trend, confirming that a single activation energy governs degradation across this range. The 70 and 80 °C data points deviate from this linear trend, indicating that the activation energy itself changes. This is the mechanism shift point. Once you cross 60 °C, you are no longer in the same degradation regime.
What this means practically: an accelerated test run at 70 or 80 °C does not just speed up the same aging process — it activates different failure modes. Any cycle life number extrapolated downward from those temperatures using a standard Arrhenius coefficient will be wrong, potentially by a large margin.
Capacity retention vs. temperature — 1,200 cycles at 1 C/1 C:
| Temperature | Capacity Retention After 1,200 Cycles | Degradation Mode |
|---|---|---|
| 25 °C | 95% | SEI repair/growth (LLI dominant) — Arrhenius valid |
| 45 °C | 90% | SEI growth + accelerated LLI — Arrhenius valid |
| 60 °C | 85% | LLI dominant, onset of Fe²⁺ dissolution — Arrhenius valid (boundary) |
| 70 °C | 80% | SEI acceleration + particle cracking + Fe²⁺ dissolution — mechanism shift |
| 80 °C | 75% | Severe multi-mode degradation — Arrhenius model invalid |
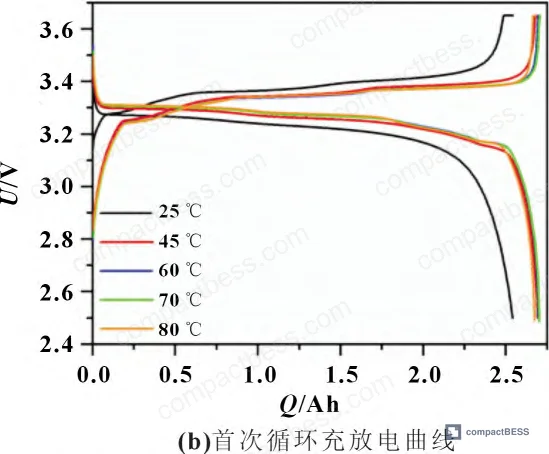
High-temperature cycling also temporarily inflates apparent initial capacity. The first-cycle discharge capacity at 45–80 °C runs approximately 0.13 Ah (~5%) higher than at 25 °C, because elevated temperature improves lithium-ion diffusion and reduces internal polarization. Buyers evaluating initial capacity numbers from hot-room acceptance tests should apply this correction — you are not seeing a better cell, you are seeing a thermally boosted measurement.
This is also why the study uses equivalent cycle number (Neq) normalized by cumulative throughput rather than raw cycle count — to eliminate the first-cycle capacity inflation artifact when comparing degradation curves across temperatures.
Compliance note: IEC 62619:2022 Safety requirements for secondary lithium cells and batteries mandates capacity retention testing under defined conditions; buyers specifying LFP storage cells should confirm that supplier test protocols align with this standard’s temperature controls.
Degradation Mechanisms: SEI Growth, Particle Cracking, and Fe²⁺ Dissolution #
The multi-technique post-mortem analysis is where this dataset separates from typical supplier qualification cycles. Three failure mechanisms were characterized independently.
Active Lithium Loss vs. Active Material Loss #
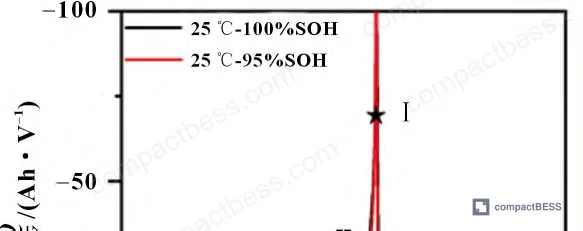
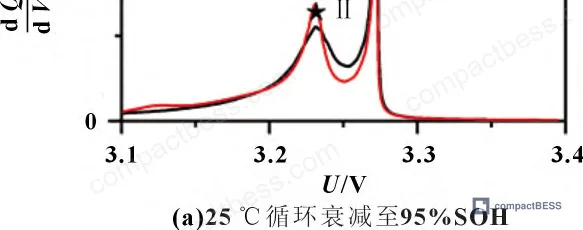
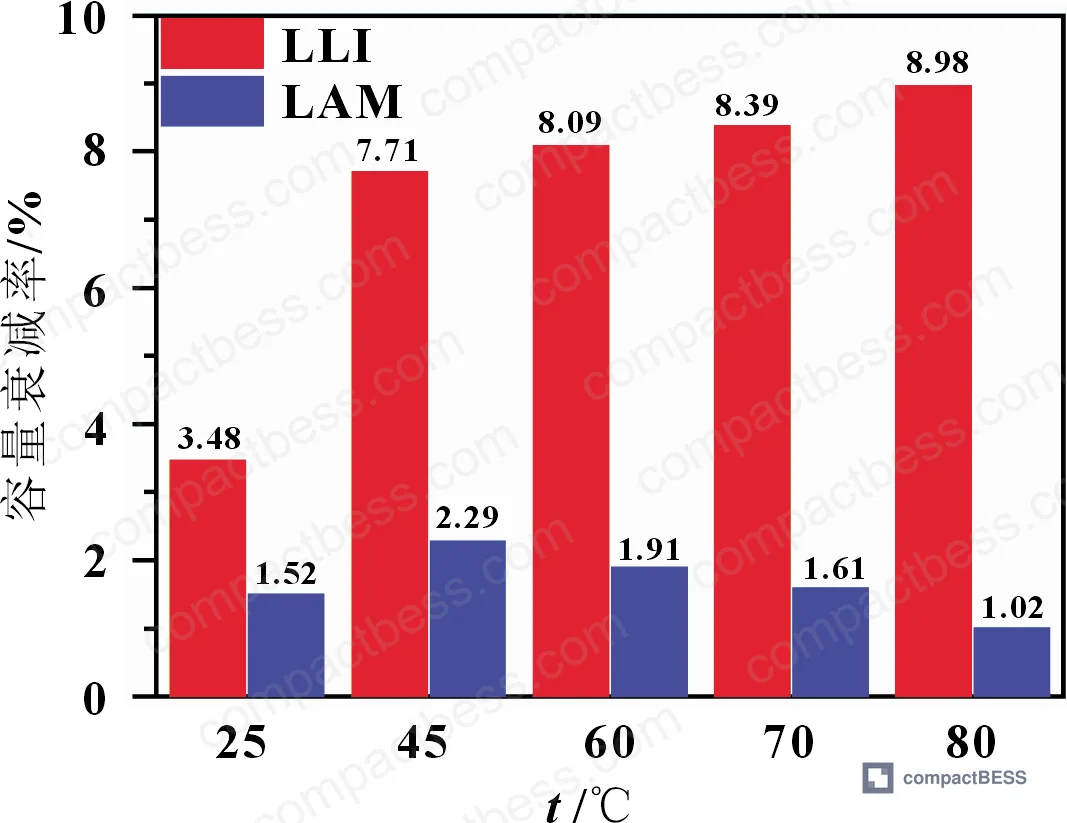
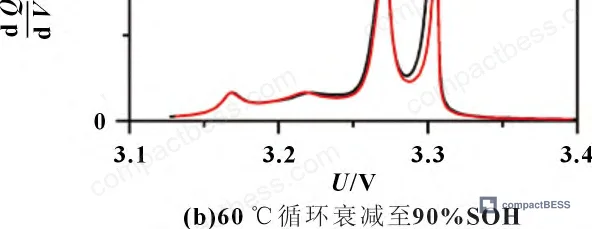
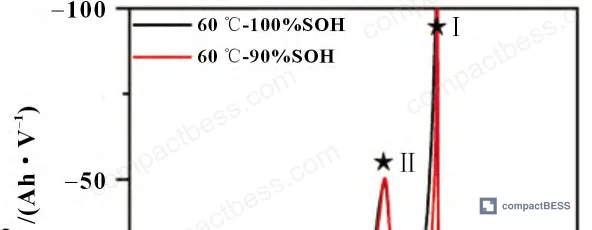
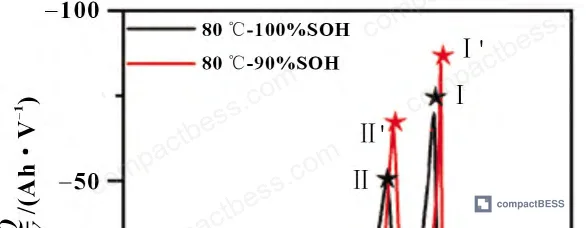
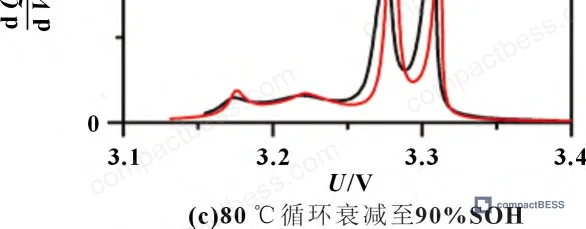
Differential capacity (dQ/dV) analysis decomposes total capacity loss into two contributions: loss of lithium inventory (LLI) from SEI formation and electrolyte decomposition side reactions, and loss of active material (LAM) from structural degradation.
Peak I area reduction in dQ/dV curves tracks LLI; Peak II area reduction tracks LAM.
Across all test temperatures (45 °C through 80 °C) cycled to 90% SOH, LLI dominates capacity loss. Active material loss remains a secondary contributor at all tested temperatures. This is consistent with the XRD data (discussed below) showing that the bulk electrode crystal structure remains largely intact even after significant capacity fade. The implication: LFP’s capacity degradation, even at elevated temperature, is primarily an interface chemistry problem — not a structural collapse problem. That is both reassuring (the cathode is durable) and insidious (SEI growth is invisible until it compounds).
Anode Surface and Cross-Section: SEM Evidence of Cracking Above 60 °C #
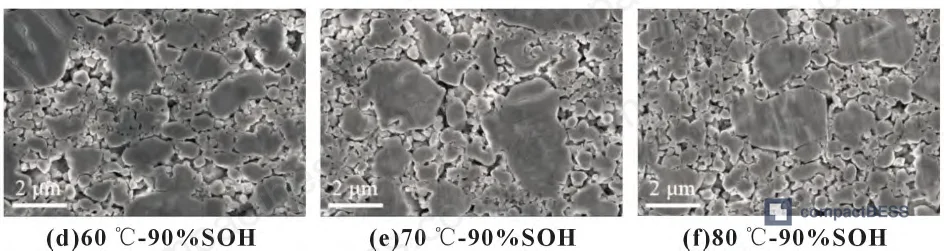
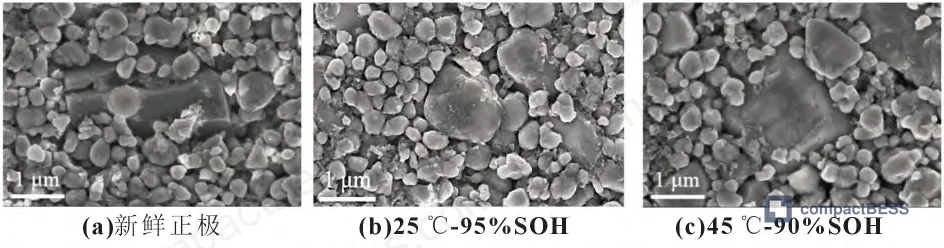
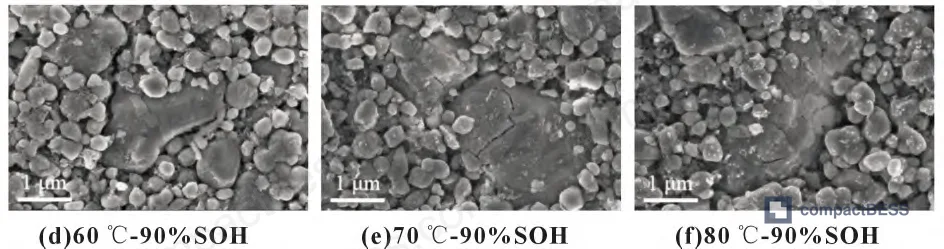
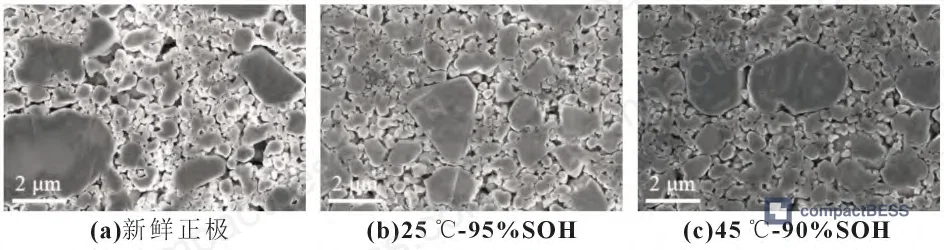
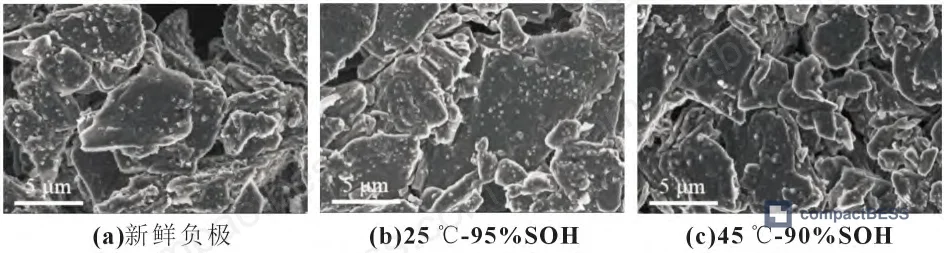
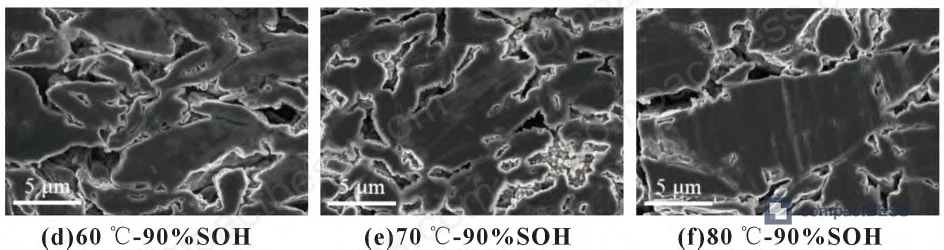
At 25 and 45 °C after 1,200 cycles, SEM shows graphite particle surfaces with visible SEI byproduct deposition — expected, manageable. At 70 and 80 °C cycled to 90% SOH, the surface deposit layer is significantly thicker and the cross-section tells a more damaging story: internal cracking within graphite particles appears at 70 and 80 °C but is absent in the 25–60 °C samples.
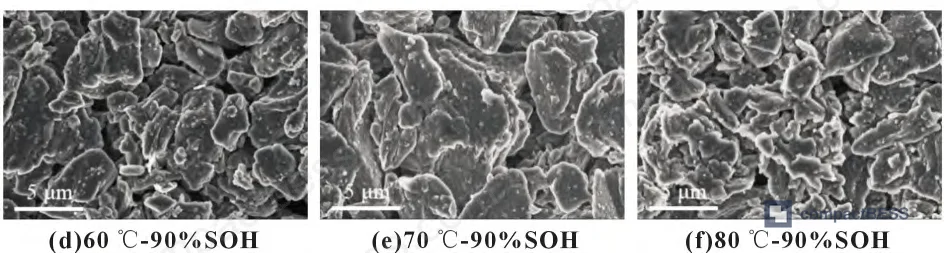
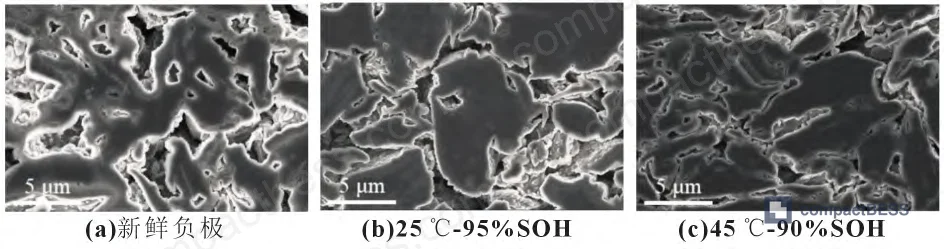
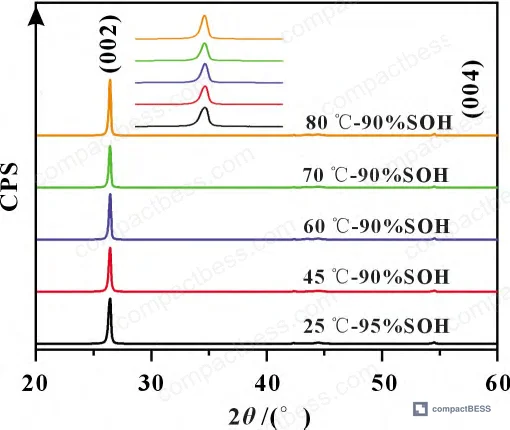
The cracking mechanism is self-reinforcing: electrolyte penetrates graphite grain boundaries during lithiation-induced swelling, SEI forms within the crack, stress concentrates at the crack tip, crack propagates further. Above 60 °C, this cycle accelerates because the interfacial side reactions are faster, more HF is generated from LiPF₆ decomposition, and the electrolyte is more mobile. XRD confirms this: the graphite (002) peak position does not shift (layer spacing unchanged), but the FWHM broadens progressively with temperature, indicating grain refinement from crack propagation:
| Cycling Condition | 2θ(002) / ° | FWHM(002) | Crystallite Size / nm |
|---|---|---|---|
| 25 °C – 95% SOH | 26.444 | 0.230 | 392 |
| 45 °C – 90% SOH | 26.444 | 0.234 | 385 |
| 60 °C – 90% SOH | 26.443 | 0.237 | 380 |
| 70 °C – 90% SOH | 26.442 | 0.240 | 374 |
| 80 °C – 90% SOH | 26.440 | 0.243 | 370 |
From 392 nm at 25 °C down to 370 nm at 80 °C — a 5.6% reduction in crystallite size — structural damage that accumulates silently beneath the macroscopic capacity curve.
ICP-AES: Fe²⁺ Dissolution Accelerates Sharply Above 60 °C #
This is the data point that should worry buyers specifying LFP for warm-climate outdoor installations or industrial BESS without adequate thermal management. ICP-AES quantification of iron content in the graphite anode after cycling:
| Cycling Condition | P Content (×10⁻⁶) | Fe Content (×10⁻⁶) |
|---|---|---|
| 25 °C – 95% SOH | 1,599.82 | 98.57 |
| 45 °C – 90% SOH | 2,610.12 | 137.06 |
| 60 °C – 90% SOH | 3,251.66 | 459.57 |
| 70 °C – 90% SOH | 3,736.96 | 682.08 |
| 80 °C – 90% SOH | 5,670.21 | 802.40 |
| 80 °C – 80% SOH | 8,237.20 | 2,287.79 |
The Fe content jump from 60 °C (459.57 ppm) to 70 °C (682.08 ppm) — a 48% increase in dissolved iron at the same SOH endpoint — is direct evidence of the mechanism shift. By 80 °C/80% SOH, the anode carries 0.2288 wt% iron, an extraordinary contamination level. The source: LiPF₆ decomposes above 60 °C producing HF, which attacks the LiFePO₄ cathode surface, dissolves Fe²⁺, and the dissolved iron redeposits on the graphite anode, disrupting SEI integrity and catalyzing further electrolyte decomposition. It is a self-accelerating contamination loop.
In supplier qualification, we have seen this play out at the system level: three of six LFP pack samples from a single batch show accelerated capacity fade in month 18, ultimately traced back to inadequate thermal management in the enclosure design allowing repeated excursions above 60 °C in summer field conditions. By that point, the Fe contamination is irreversible — you cannot recover the cycle life you have already lost.
Cathode Phase Composition: XRD Confirmation of Lithium Loss #
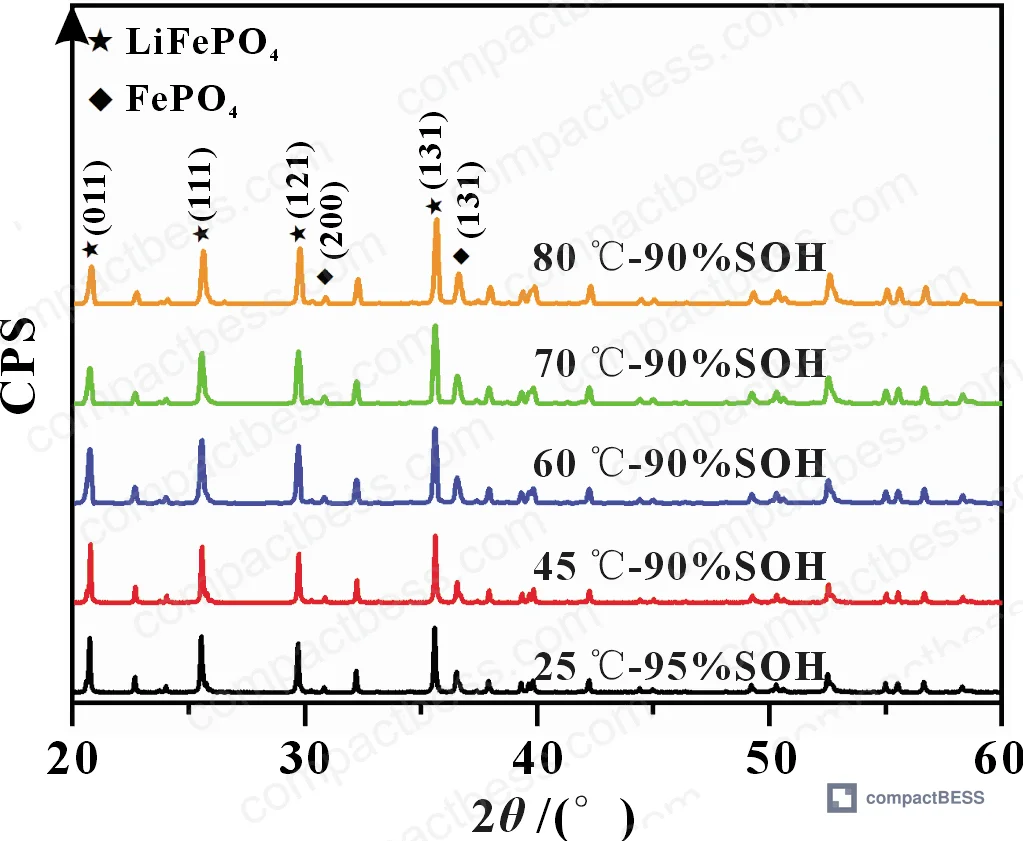
XRD analysis of the LiFePO₄ cathode in the discharged state quantifies the residual FePO₄ phase fraction — material that failed to accept lithium back during discharge due to active lithium inventory loss:
| Cycling Condition | LiFePO₄ % | FePO₄ % |
|---|---|---|
| 25 °C – 95% SOH | 87.33 | 12.67 |
| 45 °C – 90% SOH | 85.05 | 14.95 |
| 60 °C – 90% SOH | 83.42 | 16.58 |
| 70 °C – 90% SOH | 81.11 | 18.89 |
The step change between 60 °C and 70 °C is visible here too: FePO₄ fraction increases from 16.58% to 18.89% in one temperature step, consistent with the ln(Q₀) Arrhenius deviation and the ICP Fe dissolution data. The cathode bulk crystal structure shows no peak shifting — the olivine framework is intact — but the lithium inventory that should be cycling through it has been consumed by irreversible SEI-forming side reactions.
For buyers working with IEC 62619 Industrial Safety requirements, understanding that thermal excursions above 60 °C shift the fundamental degradation regime — not just accelerate the same mechanisms — has direct implications for BESS enclosure thermal design specifications and warranty claim adjudication.
Accelerated Aging Test Validity and Cycle Life Prediction #
Most procurement teams don’t realize that Arrhenius-based accelerated life testing has a hard validity boundary that few supplier test reports explicitly document. The standard practice of running accelerated cycles at 55–70 °C to compress qualification timelines is only valid if the elevated temperature does not change the degradation mechanism. This research draws that line precisely at 60 °C for graphite||LiFePO₄ chemistry with standard LiPF₆/carbonate electrolyte.
Accelerated testing below 60 °C remains valid: the activation energy is constant across 25–60 °C, meaning the Arrhenius time-temperature equivalence holds. You can legitimately extrapolate 60 °C cycle data down to 25 °C operating life with appropriate coefficient correction. Push the test to 70 °C or 80 °C and the extrapolation breaks — the mechanism has changed.
Honestly, most buyers over-specify ambient temperature tolerance in system-level datasheets — demanding a maximum operating temperature of 60 °C for a BESS installed in a climate-controlled room — but under-specify the cell-level thermal limits in pack qualification protocols. The test that matters is not the system ambient temperature; it is the cell temperature during charge/discharge under worst-case thermal load. A pack drawing 1 C continuous charge in a 45 °C ambient with inadequate cooling can easily sustain cell temperatures 15–20 °C above ambient — landing squarely in the mechanism-shift zone.
The practical standard for accelerated life testing in this context is to cap test temperature at 60 °C maximum, validate the activation energy assumption via at least two temperature data points within the linear Arrhenius regime, and supplement with dQ/dV decomposition to separately track LLI and LAM contributions. IEC 61960-3 Secondary lithium cells and batteries for portable applications provides baseline cycle life test methodology, and for transport qualification of cells used in storage products, UN 38.3 Recommendations on the Transport of Dangerous Goods — Lithium Battery Testing establishes the thermal stress exposure limits that interact directly with pre-existing degradation states.
Practical Guidance for Buyers #
The 60 °C mechanism-shift boundary is a procurement filter, not just a technical footnote. When evaluating LFP energy storage cells or complete pack assemblies, ask for the temperature at which cycle life was validated. If the answer is above 60 °C, the projection is built on a model that overstates degradation nonlinearity at operating temperatures — or understates it, depending on how the extrapolation was done. Either way, the number is unreliable.
For outdoor BESS installations in tropical or industrial environments, the thermal management design in the pack enclosure is not a cost-reduction target — it is the mechanism that keeps cell operating temperature below 60 °C under sustained load. Buyers sourcing Outdoor Power Stations or stationary storage packs for hot-climate deployment should require documented cell temperature measurements (not ambient) during 1 C continuous charge as part of sample qualification.
The ICP-AES Fe dissolution data is a particularly useful incoming quality check. A post-cycling Fe content above ~460 ppm in the graphite anode at 90% SOH indicates the cells have been thermally stressed beyond the mechanism boundary — this can be used as a forensic tool during warranty disputes.
Honestly, the buyer who invests in requesting post-mortem dQ/dV data from their supplier after accelerated qualification cycles will catch degradation mechanism problems that a simple capacity-retention pass/fail test completely misses. That 30-minute analysis step has saved procurement teams from accepting cells that look fine at acceptance but collapse in year 3.
As a Guangzhou-based B2B sourcing platform, compactbess.com connects global OEM buyers and energy integrators with verified Chinese LFP cell and BESS manufacturers — if you’re sourcing pack assemblies for high-ambient deployments and need suppliers who can provide test protocols with documented Arrhenius validity ranges, our sourcing team can shortlist qualified candidates based on your specific thermal operating profile.
Need help identifying qualified suppliers for LFP cells or pack assemblies with validated cycle life data below the 60 °C mechanism boundary? Talk to our sourcing team →
Supplier Qualification Questions #
- At what specific temperatures was your accelerated cycle life data collected, and can you confirm that no test temperature exceeded 60 °C when applying the Arrhenius model for LFP life extrapolation? If temperatures above 60 °C were used, provide the separate activation energy values used for each temperature regime.
- After accelerated cycling qualification, can you provide ICP-AES data showing Fe element content in the graphite anode? At 90% SOH endpoint, Fe content should remain below approximately 460 ppm (×10⁻⁶) under ≤60 °C test conditions — values above this threshold indicate thermal exposure beyond the valid Arrhenius regime.
- Do you have dQ/dV differential capacity analysis decomposing capacity loss into loss of lithium inventory (LLI) and loss of active material (LAM) contributions, and at what temperature were these baseline measurements made? Specifically, what percentage of total capacity loss at 90% SOH is attributable to LLI vs. LAM?
- Can you provide XRD characterization data for the graphite anode after qualification cycling, specifically the FWHM of the (002) peak and derived crystallite size? Values significantly below 380 nm at 90% SOH suggest high-temperature grain fragmentation consistent with cycling above the 60 °C mechanism boundary.
- What is the cell-level temperature during 1 C continuous charge at maximum specified ambient (not the ambient temperature — the actual cell temperature under thermal load), and how does your BMS thermal cutoff threshold relate to the 60 °C LFP degradation mechanism shift point?
Sourcing Checklist #
- [ ] Supplier provides cycle life test data collected at ≤60 °C, with at least two temperature data points within the linear Arrhenius regime (25–60 °C range) to validate activation energy assumption
- [ ] Accelerated aging protocol uses CC-CV charge at 1 C to 3.65 V with CV cutoff at ≤0.05 C, matching standardized LFP test conditions (per IEC 62619:2022 or equivalent)
- [ ] Post-cycling ICP-AES data confirms Fe content in graphite anode ≤460 ppm (×10⁻⁶) at 90% SOH for samples cycled at ≤60 °C
- [ ] XRD structural data shows graphite (002) crystallite size ≥380 nm after qualification cycling, with FWHM ≤0.237 at the 90% SOH endpoint, confirming no excessive grain fragmentation
- [ ] dQ/dV capacity loss decomposition confirms LLI/LAM ratio consistent with interface-dominated degradation (LLI >70% of total loss at 90% SOH for ≤60 °C cycling)
- [ ] Cathode XRD phase analysis at discharged state shows FePO₄ fraction ≤16.58% at 90% SOH endpoint, consistent with 60 °C or lower test temperature
- [ ] Pack-level thermal data documents actual cell temperature during 1 C charge at maximum rated ambient, confirming cell temperature remains below 60 °C under design operating conditions
- [ ] Supplier test report explicitly states whether Arrhenius linear regression was validated across test temperatures, with ln(Q₀) vs. −1/T linearity confirmed and deviation temperature identified
Key Specifications Table #
| Parameter | Recommended Value | Verification Method |
|---|---|---|
| Maximum accelerated test temperature for valid Arrhenius extrapolation | ≤60 °C | Confirm ln(Q₀) vs. −1/T linearity across all test temperatures; data points at 70 °C+ must not deviate from regression |
| Fe element content in graphite anode at 90% SOH (≤60 °C cycling) | ≤460 ppm (×10⁻⁶) | ICP-AES (ICP-OES) elemental analysis of graphite anode powder after end-of-test disassembly |
| Graphite (002) crystallite size after qualification cycling | ≥380 nm (at 90% SOH, ≤60 °C) | XRD Scherrer analysis of (002) peak; scan rate 1 °/min, 2θ = 15–80 ° |
| Capacity retention after 1,200 cycles at 25 °C (1 C/1 C) | ≥95% | CC-CV charge (1 C, cutoff 3.65 V / 0.05 C), 1 C discharge to 2.5 V, 30 min rest between steps |
| LiFePO₄ phase fraction in discharged cathode at 90% SOH | ≥83% LiFePO₄ (≤16.58% FePO₄) | XRD phase quantification of post-cycle cathode in fully discharged state |
| First-cycle capacity elevation at elevated temperature | ≤5% above 25 °C baseline | Compare C₀ measurements at test temperature vs. 25 °C reference; apply Neq normalization for cross-temperature comparison |
Can’t find a supplier meeting these specs? Submit your requirements and we’ll match you within 48 hours.
References #
Data source: Temperature-Dependent Capacity Degradation Mechanisms in Graphite||LiFePO₄ Pouch Cells for Stationary Energy Storage Applications, H. Zheng et al., Journal of the Electrochemical Society, 2024
Frequently Asked Questions #
Q: Why does LFP cycle life degrade faster above 60 °C compared to below?
A: Below 60 °C, capacity fade is governed by a single, thermally stable degradation mechanism — primarily SEI layer growth at the graphite anode consuming active lithium. The Arrhenius activation energy remains constant across 25–60 °C, so the process simply speeds up proportionally with temperature. Above 60 °C, multiple additional failure modes activate simultaneously: LiPF₆ in the electrolyte decomposes more aggressively generating HF, HF attacks the LiFePO₄ cathode dissolving Fe²⁺ ions, those ions redeposit on the graphite anode disrupting SEI integrity, and the thermal cycling stress combined with increased electrolyte mobility drives micro-crack propagation inside both graphite and cathode particles. These are not the same mechanisms running faster — they are different mechanisms, which is why the Arrhenius model breaks down and extrapolated life predictions based on >60 °C test data are invalid.
Q: Can I use 70 °C accelerated cycling to compress my supplier qualification timeline?
A: Not safely, if you want to extrapolate results to 25 °C operating life. The research is clear: above 60 °C the activation energy changes, meaning the time-temperature equivalence built into the Arrhenius model no longer holds. You can still use 70 °C data for comparative stress testing or worst-case operating envelope validation, but you cannot legitimately extrapolate a cycle life number from 70 °C data back to 25 °C using standard Arrhenius coefficients. The maximum valid temperature for LFP Arrhenius life extrapolation based on this data is 60 °C.
Q: What is the significance of Fe²⁺ content in the graphite anode as a quality indicator?
A: The ICP-AES Fe concentration in the cycled graphite anode is one of the most sensitive indicators of whether a cell has been thermally abused during either qualification testing or field operation. At 90% SOH, Fe content of ~98 ppm corresponds to 25 °C cycling; ~460 ppm corresponds to 60 °C. A cell that shows Fe content significantly above 460 ppm at 90% SOH has almost certainly experienced sustained temperatures above 60 °C — the dissolved iron catalyzes SEI disruption in a self-reinforcing loop that accelerates all subsequent degradation. This makes post-cycle ICP-AES a practical forensic tool for warranty investigation and incoming cell qualification.
Q: Does LFP’s structural stability mean it’s immune to particle cracking at high temperatures?
A: No. While the LiFePO₄ olivine framework is more structurally robust than layered oxide cathodes, cross-section SEM after 70–80 °C cycling to 90% SOH shows visible crack propagation inside large cathode particles — absent in 25–60 °C samples. The cracking mechanism is driven by increased lithiation/delithiation kinetics at high temperature (more lithium moves per cycle), cumulative lattice strain from volume changes, and corrosive attack from HF generated by LiPF₆ decomposition. The cathode bulk crystal structure remains intact (no XRD peak shifting), but physical particle fragmentation still increases surface area available for further side reactions, contributing to accelerating degradation in later cycles.
Q: How should thermal management specifications for LFP BESS be set relative to this 60 °C threshold?
A: The 60 °C threshold applies to the cell, not the ambient environment. A conservative design target keeps maximum cell temperature under 55 °C during any operating condition — providing 5 °C margin against the mechanism boundary. This means the BESS enclosure thermal system must be specified and verified based on internal cell temperatures under worst-case load (typically 1 C continuous charge in maximum ambient), not ambient temperature alone. For systems targeting 10+ year service life with cycle warranties, the thermal management design is effectively a cycle life guarantee mechanism — inadequate cooling will silently move cells into the >60 °C regime and invalidate any Arrhenius-based life projection the cell supplier provided.
*Published by compactbess.com Technical Team | [Request


