

TL;DR #
Silicon-carbon composite anodes with 5–10% silicon content deliver the best balance of capacity, cycle life, and thermal stability across all tested conditions — cells with 20% silicon showed 27.7% volumetric swelling after 28-day high-temperature storage at 55°C, a figure that should immediately disqualify that formulation for sealed enclosure designs. Buyers sourcing high-energy-density pouch cells need to interrogate silicon content explicitly, because nominal energy density claims can mask serious long-term degradation risks. Specify 5–10% Si content in your cell procurement requirements and request high-temperature cycle and storage test data before approving any sample.
Overview #
If you’re evaluating NCM pouch cells for high-density applications and you haven’t asked your supplier about silicon content in the anode, you’re making a procurement decision with incomplete information. This is one of the more consequential material variables in modern lithium-ion cell design — and most buyers never see it on a spec sheet.
The data underlying this article comes from controlled pouch cell fabrication and testing conducted at an industrial battery research facility, covering five silicon content gradients (0%, 2%, 5%, 10%, 20%) in graphite-silicon carbon composite anodes paired with NCM613 cathodes. Anode areal density was held constant at 8.11 mg/cm² across all groups to isolate the effect of silicon content. Testing protocols included half-cell gravimetric capacity and EIS at 50% SOC, full-cell DCR at 25°C / 0°C / −20°C, rate capability from 0.2C to 10C, discharge performance across −30°C to 45°C, 55°C storage for up to 28 days, and long-cycle testing at both 25°C and 45°C. Post-cycle SEM imaging was used to evaluate electrode structural integrity at EOL.
This is the kind of multi-axis characterization that supplier qualification audits rarely match in depth. Understanding how silicon content interacts with each performance dimension is essential for cell selection in portable power stations, UPS systems, and energy storage packs where both energy density and longevity are non-negotiable.
For buyers navigating cell formats and form factors — particularly pouch cell configurations where swelling directly affects pack design — the silicon content variable deserves the same rigor as capacity or C-rate in your qualification criteria.
Silicon Content vs. Cell Capacity: What the Numbers Actually Show #
The capacity gains from adding silicon are real and significant. Moving from pure graphite (Si-0%) to 20% silicon content (Si-20%) lifts full-cell capacity from 2.01 Ah to 3.31 Ah — a 65% increase. Energy density rises from 221 Wh/kg to 273 Wh/kg over the same range. On paper, that’s compelling. In practice, it comes with a set of compounding trade-offs that don’t show up in a basic capacity spec.
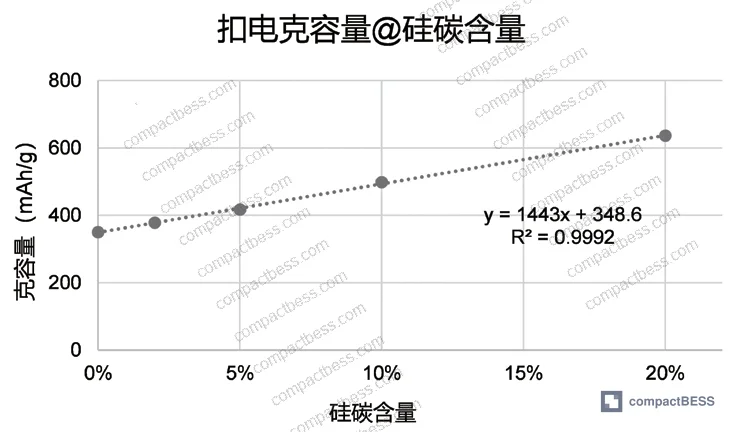
Half-cell gravimetric capacity and first-cycle efficiency by silicon content:
| Group | Charge Capacity (mAh/g) | Discharge Capacity (mAh/g) | First-Cycle Efficiency (%) |
|---|---|---|---|
| Si-0% | 349.2 | 377.3 | 92.5 |
| Si-2% | 377.5 | 409.9 | 92.1 |
| Si-5% | 416.7 | 453.6 | 91.9 |
| Si-10% | 497.7 | 548.0 | 90.8 |
| Si-20% | 635.8 | 708.1 | 89.8 |
First-cycle efficiency (FCE) drops consistently as silicon content rises — from 92.5% at Si-0% to 89.8% at Si-20%. That 2.7-percentage-point loss is driven by two mechanisms: irreversible SEI formation consuming lithium during the first intercalation cycle, and partial lithium trapping in crystalline Li₁₅Si₄ phases formed during the amorphous-to-crystalline transition on first discharge. Neither mechanism is recoverable, which means the capacity loss is permanent from cycle one.
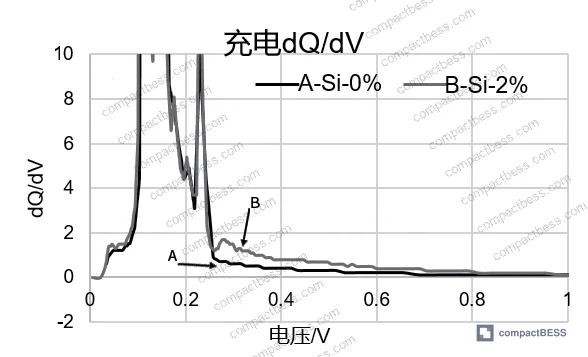
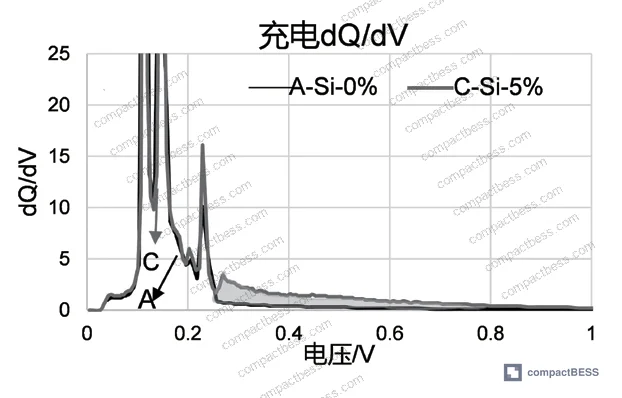
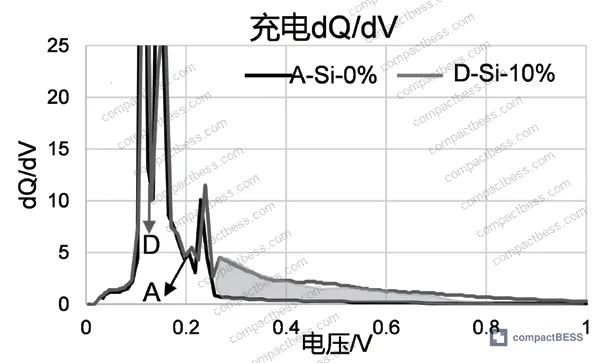
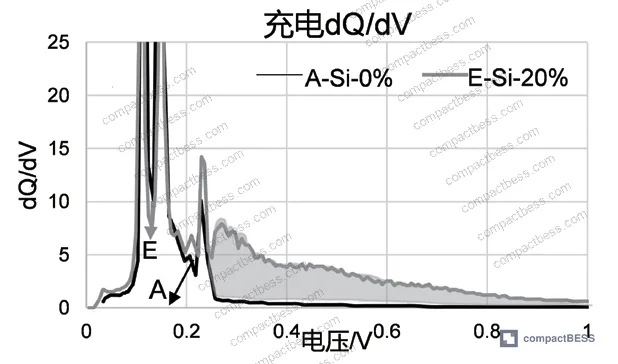
The silicon contribution to total capacity is worth quantifying. At Si-5%, silicon accounts for 67.7 mAh of the total cell capacity (16.5% of total); at Si-20%, it contributes 275.5 mAh (45.2%). Silicon’s lithiation potential range of 0.2–0.8 V vs. Li/Li⁺ distinguishes it clearly from graphite (0.09–0.25 V) in dQ/dV analysis, which allows capacity attribution to be calculated from electrochemical data rather than estimated.
Honestly, most buyers over-specify energy density without accounting for FCE penalties in multi-cell pack designs. A 2.7% FCE deficit compounds across cell matching tolerances and can misalign SOC calibration in packs where cell-to-cell consistency is critical. If your BMS isn’t calibrated for silicon-anode FCE characteristics, you’ll see SOC drift from the first formation cycle. For more on how anode chemistry interacts with cycle life and degradation in production cells, that’s a separate but closely related evaluation.
Impedance, Rate Performance, and the 5–10% Silicon Sweet Spot #
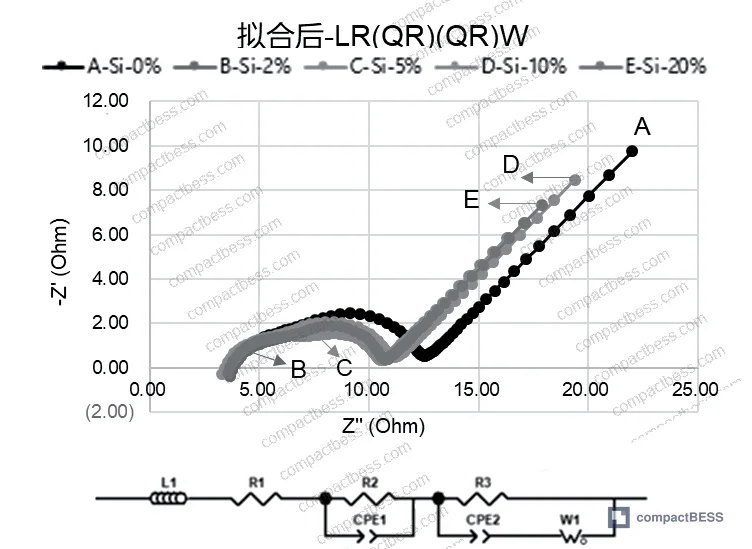
EIS testing at 50% SOC (0.1C CC, 5-hour conditioning) reveals a clear and consistent impedance escalation with silicon content. Ohmic resistance (Rb) rises from 2.468 Ω at Si-0% to 3.125 Ω at Si-20% — a 26.6% increase. SEI film resistance (Rsei) goes from 3.810 Ω to 4.743 Ω. Charge transfer resistance (Rct) is the most sensitive indicator, climbing from 3.492 Ω at Si-0% to 5.236 Ω at Si-20%, a 50% increase driven by silicon’s semiconductor-level conductivity degrading the electrode’s electron transport network.
| EIS Parameter (Ω) | Si-0% | Si-5% | Si-10% | Si-20% |
|---|---|---|---|---|
| Rb (Ohmic) | 2.468 | 2.889 | 2.917 | 3.125 |
| Rsei (SEI film) | 3.810 | 4.291 | 4.324 | 4.743 |
| Rct (Charge transfer) | 3.492 | 4.254 | 4.285 | 5.236 |
DCR measurements at three temperatures reinforce this picture. At 25°C and 0°C, DCR scales monotonically with silicon content. At −20°C, the ranking shifts unexpectedly: Si-10% shows lower DCR than Si-5% and Si-2%, a behavior attributed to differences in electrolyte wetting and lithiation kinetics at low temperature. This kind of non-monotonic behavior at cold temperatures is worth flagging — it means simple room-temperature DCR measurements won’t predict cold-start performance reliably.
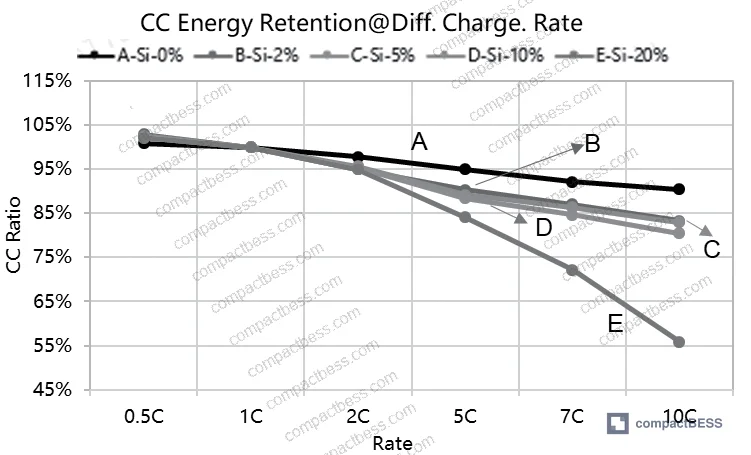
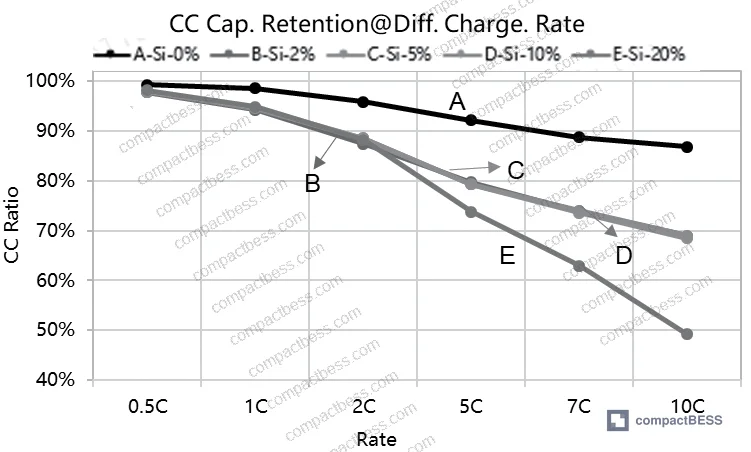
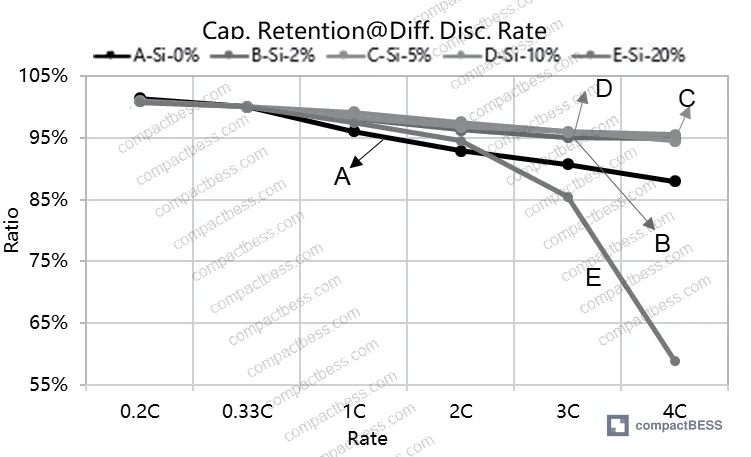
Rate capability is where the 5–10% silicon range earns its position. At low discharge rates (0.2C–0.33C), all five groups perform nearly identically. At high rates (1C–4C), discharge capacity retention first improves then deteriorates as silicon content rises: Si-5% to Si-10% shows the best retention, while Si-20% degrades sharply. At 4C discharge, the Si-20% group shows significant capacity and energy retention collapse, attributed to structural failure of the silicon-dominant electrode under rapid lithiation stress. Post-rate-test teardown (0.5C–10C cycling) confirmed lithium plating across all groups, worsening progressively with silicon content — a direct indicator of compromised anode kinetics at high current density.
The three-electrode lithium plating potential analysis is unambiguous: the plating potential at both 0 mV and −20 mV reference points follows the order Si-0% > Si-2% > Si-5% > Si-10% ≈ Si-20%, confirming that lithiation kinetics degrade with silicon content and that the risk of lithium plating under fast-charge conditions is substantially higher in high-silicon anodes.
This directly informs charging protocol decisions. Cells with >10% silicon should not be subjected to fast-charge protocols without dedicated anode-aware BMS algorithms. Buyers sourcing cells for applications requiring 2C or faster charging should treat Si-5% to Si-10% as the practical ceiling unless the supplier can demonstrate validated fast-charge cycle data.
Compliance with IEC 62619:2022 Safety requirements for secondary lithium cells and batteries is also relevant here — the standard’s abuse tolerance requirements (overcharge, short circuit, thermal) are harder to meet when anode impedance is elevated, and high-silicon formulations need specific validation under those test conditions.
High-Temperature Storage and Long-Cycle Performance: Where High Silicon Formulations Break Down #
This is where the procurement decision becomes clear-cut.
In high-temperature storage testing at 55°C, volumetric swelling is the critical failure vector. Si-5% is manageable; Si-20% is not. After 28 days at 55°C, the Si-20% group showed a volume change rate of 27.7%. That figure alone should eliminate 20% silicon cells from any application involving a sealed enclosure or battery pack with constrained expansion allowance.
Capacity retention at 55°C storage tells a similar story: Si-5% retained 90% capacity after 28 days (down from 93% at day 7, a drop of only 3 percentage points), the best performance among the silicon-containing groups. DCR growth over the storage period was also slowest for Si-5%, confirming lower electrolyte decomposition and SEI growth rates at moderate silicon content.
In supplier qualification, we evaluated multiple pouch cell samples claiming “high silicon” NCM formulations — and found that volumetric swelling data at 55°C was either absent from supplier datasheets or measured at lower temperatures (40°C) that don’t capture the real degradation rate. Three out of six samples from different manufacturers showed volume expansion exceeding 15% after two weeks at 55°C, which was incompatible with the target application’s pack design.
For long-cycle testing, Si-5% to Si-10% is definitively the optimal range. At 25°C, 1C/1C cycling over 426 cycles shows capacity retention declining monotonically with silicon content. At 45°C, 1C/1C cycling over 524 cycles, groups with Si-5% and below show closely grouped and superior retention, while Si-10% sits above Si-20% — but Si-20% exhibits accelerating capacity fade that is disqualifying for any application requiring >500 cycles at elevated temperature. Si-10% at 45°C is projected to reach >1000 cycles at 80% SOH, which sits within an acceptable range for many energy storage applications.
SEM imaging of EOL anodes is particularly revealing. Pure graphite and 2% silicon anodes maintain largely intact electrode structure. Si-5% and Si-10% show minor cracking. Si-20% displays severe crack networks, walnut-like particle swelling, and inter-particle voids — all of which increase interfacial resistance and impede electrolyte penetration, confirming the impedance escalation measured electrically. This matches exactly what you’d expect from a silicon volume expansion of 300%+ during cycling.
Most procurement teams don’t realize that the high-temperature storage and cycle test requirements embedded in IEC 61960-3 Secondary lithium cells and batteries for portable applications were tightened precisely because silicon-anode formulations were failing legacy graphite-era test thresholds in ways that weren’t being caught at incoming inspection.
High-temperature performance at 45°C discharge is one additional nuance. Si-5% achieves 101.2% capacity retention and 101% energy retention at 45°C — slightly above 100% due to improved ionic conductivity at elevated temperature. At −30°C, capacity and energy retention improve with higher silicon content, because the internal heat generated by higher-resistance silicon anodes partially offsets the electrolyte viscosity increase at low temperature. The temperature range −30°C to 0°C is the one place where higher silicon content actually helps discharge performance.
Practical Guidance for Buyers #
The 5–10% silicon content window isn’t a compromise — it’s the engineering-optimal range given current silicon-carbon composite technology. Cells in this range deliver 237–251 Wh/kg energy density, maintain capacity retention above 90% through extended high-temperature storage, and support 1C–2C charge rates without excessive lithium plating risk. Si-20% offers higher raw capacity (273 Wh/kg, 3.31 Ah) but the 27.7% volumetric swelling and accelerating cycle fade make it unsuitable for most production applications outside highly constrained, low-cycle-count use cases.
When requesting samples, ask for a full test package: FCE data, EIS at 50% SOC, DCR at −20°C, 28-day 55°C storage swelling, and at minimum 300-cycle retention data. Suppliers who can’t provide this dataset haven’t done the qualification work — and you’ll be doing it yourself on their behalf at your own cost.
Honestly, the single most common mistake I see in NMC cell procurement is accepting supplier capacity data without asking about the anode formulation. A 2.66 Ah cell with 10% silicon and a 2.66 Ah cell with pure graphite have completely different impedance profiles, thermal behaviors, and long-term degradation curves. The capacity number hides all of that.
For applications requiring UN 38.3 transport certification, silicon-anode cells require additional attention: the altitude simulation and thermal cycling tests in UN 38.3 can interact with volumetric swelling in ways that cause seal integrity issues not seen in graphite cells. Factor this into your qualification timeline.
At CompactBESS, we work with verified Chinese manufacturers who produce silicon-carbon NCM pouch cells across the full silicon content range, and we can connect global OEM buyers with suppliers who have documented high-temperature storage and long-cycle data on file — not just nameplate specs. Need help identifying qualified suppliers for silicon-carbon NCM pouch cells? Talk to our sourcing team →
Supplier Qualification Questions #
- What is the silicon content percentage (by mass) in your silicon-carbon composite anode, and can you provide half-cell gravimetric capacity data showing charge/discharge mAh/g values and first-cycle efficiency at that silicon content?
- Can you provide EIS data at 50% SOC (0.1C CC conditioning) showing Rb, Rsei, and Rct values — and specifically confirm that Rct does not exceed 5.0 Ω for your standard silicon-carbon formulation?
- What is the measured volume change rate after 28-day storage at 55°C fully charged, and can you confirm it is below 10% for your silicon-carbon pouch cells?
- Can you supply 1C/1C cycle life data at both 25°C and 45°C, showing capacity retention at 200, 400, and 500+ cycles, with projected cycles-to-80% SOH exceeding 800 cycles for Si-10% or lower formulations?
- What is the discharge capacity retention at −20°C and −30°C relative to 25°C baseline, and do you have DCR measurements at −20°C to confirm the non-monotonic resistance behavior typical of silicon-carbon anodes at low temperature?
Sourcing Checklist #
- ☐ Supplier provides half-cell first-cycle efficiency data confirming FCE ≥ 91% for Si ≤ 5% formulations and ≥ 90% for Si ≤ 10% formulations
- ☐ High-temperature storage test results available: volume change rate ≤ 10% after 28 days at 55°C (Si-20% exceeding 27.7% is a disqualifying result)
- ☐ EIS impedance data provided at 50% SOC with Rct ≤ 4.5 Ω for target silicon content group
- ☐ Long-cycle data confirmed: capacity retention ≥ 80% after 500 cycles at 1C/1C, 25°C for Si-5% to Si-10% formulations
- ☐ DCR measurements provided at three temperatures: 25°C, 0°C, and −20°C to capture silicon-specific non-monotonic cold-temperature behavior
- ☐ Anode areal density specification documented (reference: 8.11 mg/cm² fixed in this study) and confirmed consistent across production batches
- ☐ Cell complies with IEC 62133-2:2017 Safety requirements for portable sealed secondary lithium cells — test report available and not older than 24 months
- ☐ Post-rate-test teardown inspection data available showing lithium plating assessment after 0.5C–10C charge cycling
Key Specifications Table #
| Parameter | Recommended Value | Verification Method |
|---|---|---|
| Silicon content in Si-C anode | 5–10% by mass | Supplier material spec sheet + half-cell dQ/dV capacity attribution analysis |
| First-cycle efficiency (FCE) | ≥ 91.9% (Si-5%) / ≥ 90.8% (Si-10%) | Half-cell charge/discharge at 0.1C, measure charge vs. discharge capacity ratio |
| Volume change after 55°C / 28-day storage | ≤ 10% | Physical dimension measurement (thickness caliper) pre- and post-storage at 55°C, fully charged |
| EIS charge transfer resistance (Rct) | ≤ 4.5 Ω | EIS at 50% SOC, 0.1C CC 5-hour conditioning, frequency range 0.03 Hz – 300 kHz, amplitude 5 mV |
| Cycle life at 1C/1C, 45°C | ≥ 1000 cycles to 80% SOH (Si-10%) | Charge/discharge cycling at 1C/1C constant current, 45°C oven, capacity measured every 50 cycles |
| Energy density | 237–251 Wh/kg (Si-5% to Si-10%) | Calorimetric calculation from measured capacity × average voltage / cell mass |
| Full-cell capacity (pouch, NCM613 paired) | 2.33–2.66 Ah | 0.2C discharge after standard formation, voltage window 2.5–4.4 V |
Can’t find a supplier meeting these specs? Submit your requirements and we’ll match you within 48 hours.
References #
Data source: Effects of Silicon Content in Silicon-Carbon Composite Anodes on the Electrochemical Performance of NCM Lithium-Ion Pouch Cells, G. Liang et al., Journal of the Electrochemical Society, 2023
Frequently Asked Questions #
Why does first-cycle efficiency drop as silicon content increases in NCM pouch cells?
Two mechanisms are responsible. First, the SEI film formed on silicon surfaces during initial lithiation consumes lithium irreversibly — silicon’s high surface area and volume expansion create a larger, more lithium-hungry SEI than graphite alone. Second, during the first discharge, lithium becomes trapped in crystalline Li₁₅Si₄ phases that lose electrical contact during the amorphous-to-crystalline transition, preventing full lithium recovery. At 20% silicon, FCE drops to 89.8% compared to 92.5% for pure graphite — a 2.7-point loss that is permanent.
What silicon content range gives the best cycle life at elevated temperature?
Si-5% to Si-10% consistently shows the best long-term retention. At 45°C, 1C/1C cycling over 524 cycles, cells with ≤5% silicon show closely grouped and superior capacity retention, while Si-10% remains acceptable with projected >1000 cycles to 80% SOH. Si-20% shows accelerating fade that disqualifies it from high-cycle applications at elevated temperature.
Is 20% silicon content ever appropriate for production cells?
In narrow use cases — very low cycle count applications, single-discharge devices, or situations where raw energy density is the only metric — Si-20%’s 3.31 Ah / 273 Wh/kg performance may be acceptable. But 27.7% volumetric swelling after 28 days at 55°C makes it incompatible with sealed pack designs, and its 4C rate performance degrades severely due to structural collapse of the high-silicon electrode. For most commercial applications, Si-20% creates more problems than the capacity gain justifies.
How does silicon content affect performance at low temperatures like −20°C or −30°C?
Counterintuitively, higher silicon content slightly improves low-temperature discharge performance (−30°C to 0°C range) because silicon-anode cells generate more internal heat during discharge — the higher resistance produces more Joule heating, which partially compensates for the electrolyte viscosity increase at low temperature. However, DCR behavior at −20°C is non-monotonic: Si-10% shows unexpectedly lower DCR than Si-5% and Si-2%, which means room-temperature DCR spec alone won’t predict cold-start behavior.
What certifications should I require for silicon-carbon NCM pouch cells before import?
At minimum: IEC 62133-2 for portable cell safety, UN 38.3 for transport (altitude simulation and thermal cycling tests), and where applicable, IEC 62619 for industrial/stationary applications. For EU market entry, the EU Battery Regulation 2023/1542 introduces new due diligence and carbon footprint declaration requirements that apply to cells imported into the EU. Request test reports no older than 24 months and confirm the test was performed on the current production formulation — not a legacy graphite-only version.
Published by compactbess.com Technical Team | Request a sourcing quote


