

TL;DR #
A grid-connected residential solar-plus-storage system with a 24 kWh battery bank and PV array achieves a system utilization rate of 88% — versus 70% for PV-only configurations — directly reducing long-term operating costs through optimized charge/discharge scheduling against real-time grid pricing. For buyers specifying portable solar generator systems or residential BESS products, this gap in utilization rate is the single most important argument for including appropriately sized storage alongside generation capacity. Before writing your next RFQ, pin the storage-to-load ratio and depth of discharge ceiling as hard constraints, not afterthoughts.
Overview #
Too many procurement teams treat solar generator capacity sizing as a rough estimate — “double the daily load and add buffer” — and end up with systems that either cycle the battery too aggressively or leave expensive capacity idle. Simulation data from a power generation engineering study conducted by a provincial utility operator, modeled against real residential load profiles with a 30 kWh/day average demand baseline, tells a more precise story. The research evaluated three system configurations across a full daily dispatch cycle, tracking SOC curves, power flows, and total cost functions simultaneously — giving us clean comparative data that generic product datasheets rarely provide.
The finding that sticks: the combined PV-plus-storage configuration outperforms both PV-only and storage-only alternatives not just on cost, but on grid independence and resilience. That resilience factor — the system’s ability to ride through bad weather or grid emergencies — is increasingly the deciding factor in markets where grid reliability is poor or where regulations push self-consumption ratios higher.
Solar Generator Storage Sizing: The 24 kWh Benchmark and What It Actually Means #
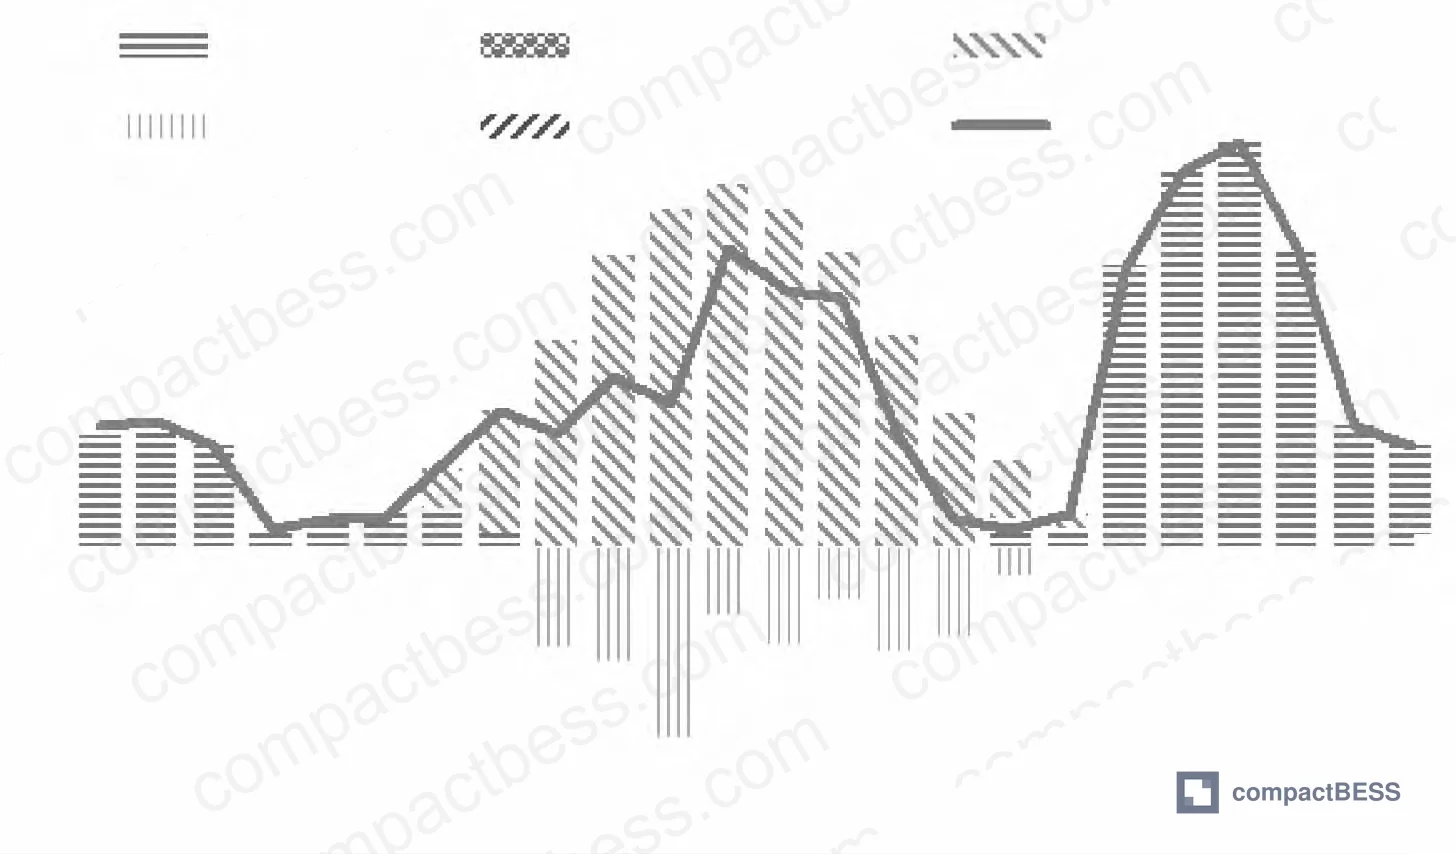
The reference design targets a household with a 30 kWh/day consumption profile. The optimized storage system is sized at 24 kWh, built from 20 units of 12 V / 100 Ah batteries wired in series-parallel configuration. Total capital outlay for the battery bank in this design is approximately ¥15,000 — a figure useful for benchmarking when evaluating supplier quotes, even if your end market uses a different currency baseline.
Key battery parameters from the design:
- Depth of discharge (DoD): 60% ceiling — SOC held within 40%–95% at all times
- Maximum cycle life at this DoD: 3,500 cycles
- Electricity storage cost: 0.132 CNY/kWh (calculated from levelized cost model)
- Maximum charge power: 3 kW
- Self-discharge rate: 0.001 (essentially negligible over a daily cycle)
- Round-trip charge/discharge efficiency: ≥90%
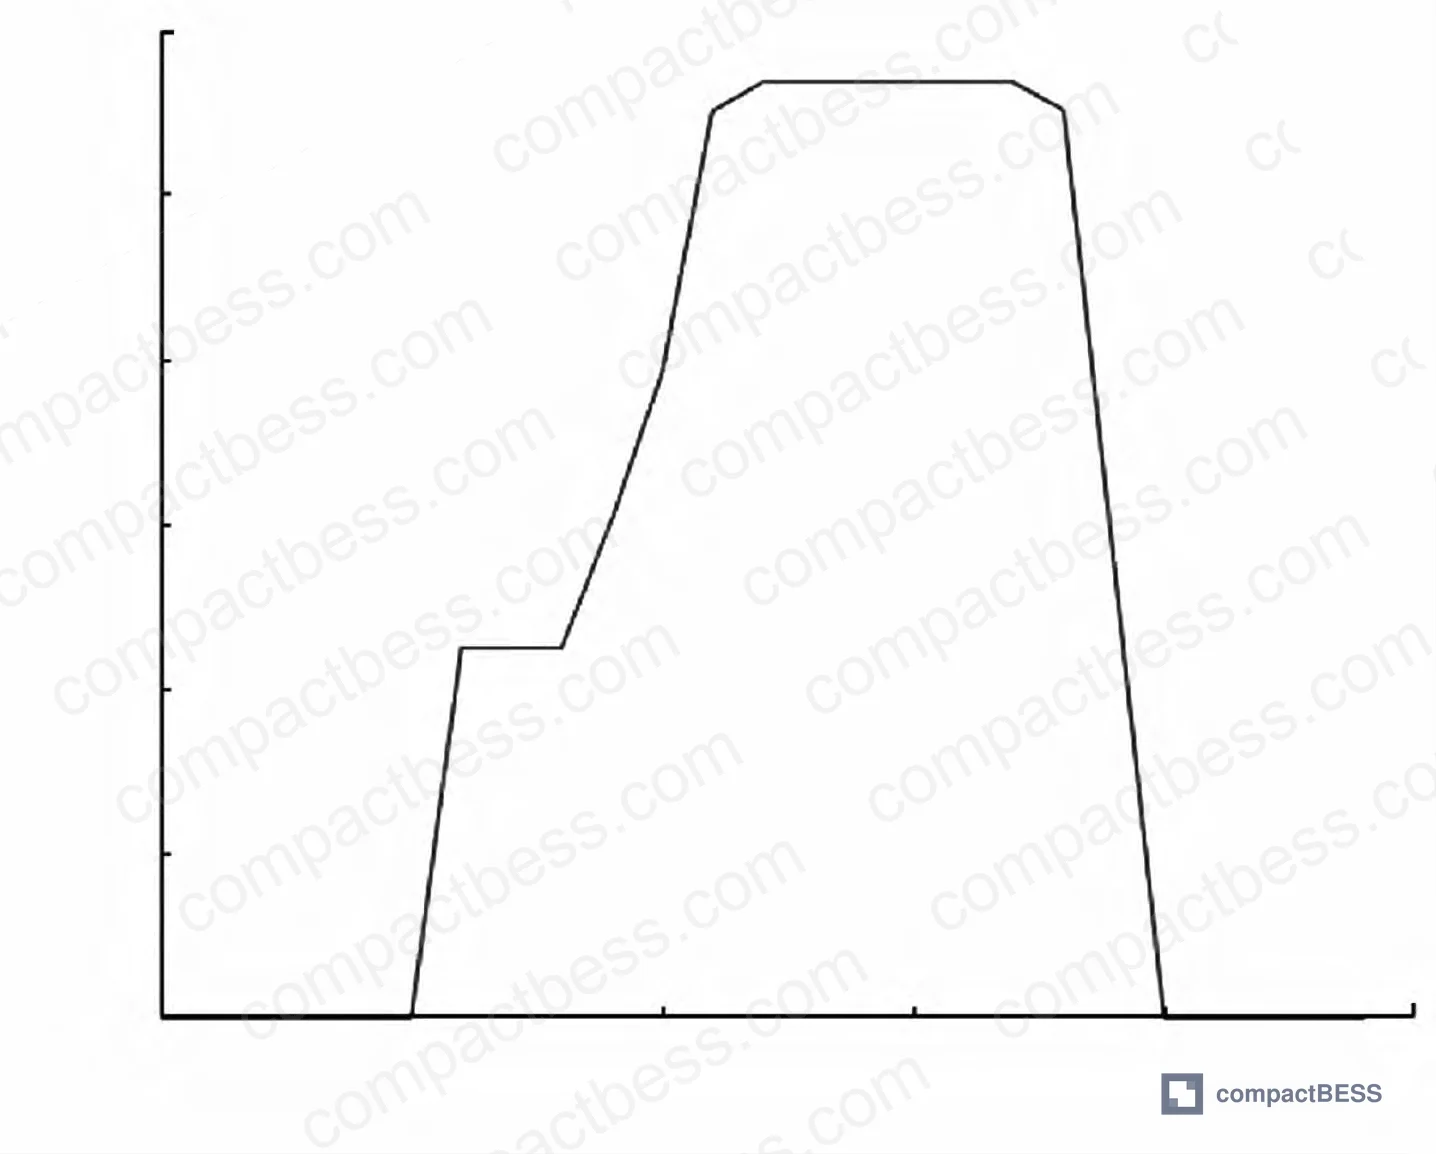
The SOC profile across a 24-hour cycle is instructive. At midnight through 05:00, the battery sits idle — neither charging nor discharging. SOC climbs from 0.60 to 0.70 between 05:00–06:00 as PV generation begins, then rises further to 0.88 by 08:00–12:00 during peak generation hours. The primary discharge window runs 17:00–20:00, dropping SOC back to 0.60.
This daily swing — 60% to 88% and back — is tighter than many buyers expect. Honestly, most procurement teams over-specify storage capacity because they’re afraid of running the battery down to empty. The data here shows that a well-optimized dispatch strategy keeps the battery in a narrow, battery-friendly SOC band while still meeting full daily load requirements. That’s what buys you 3,500 cycles instead of 1,500.
PV-Plus-Storage vs. PV-Only vs. Storage-Only: Three-Configuration Comparison #
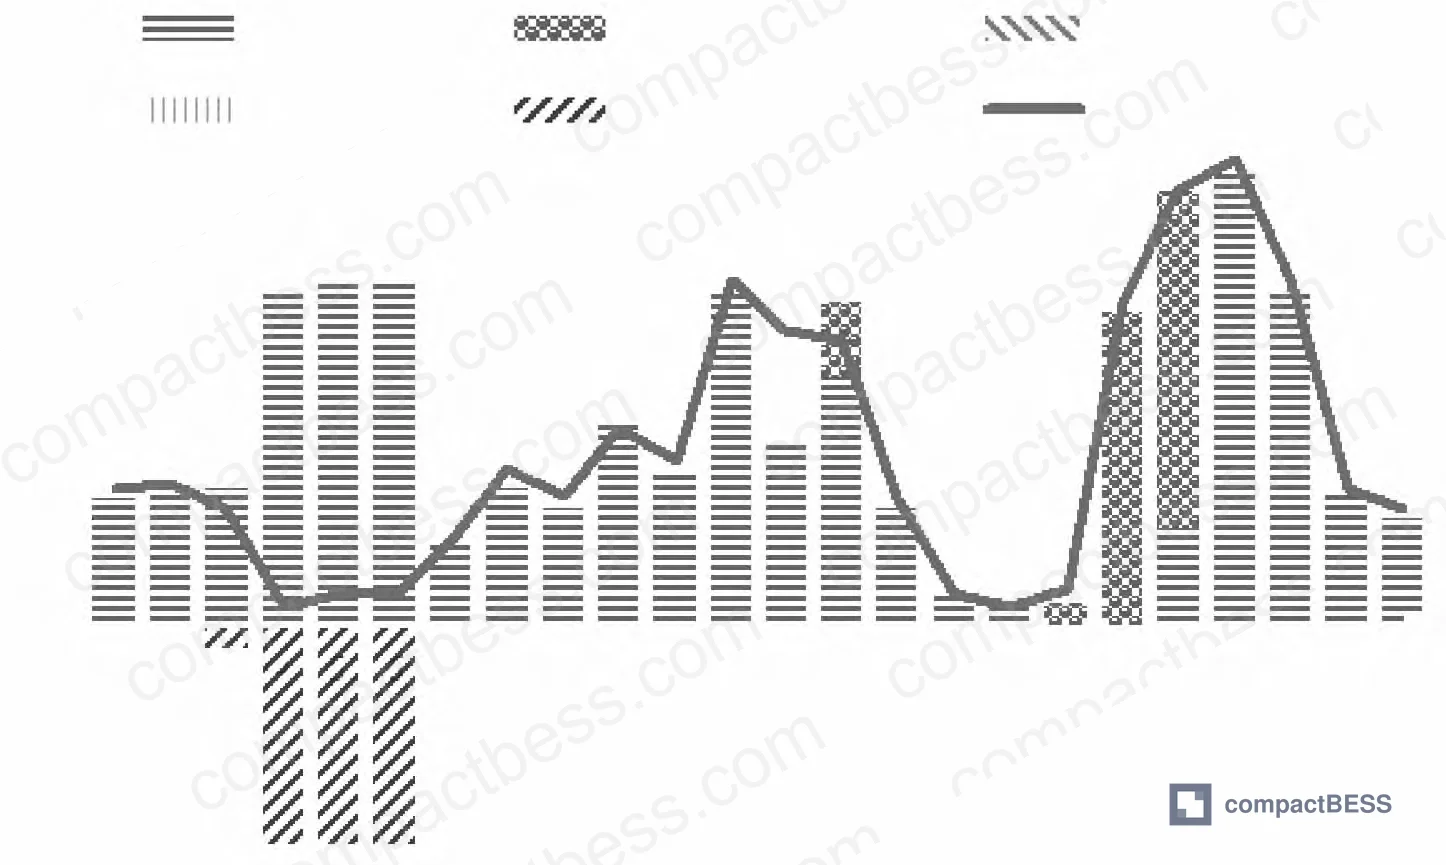
This is where the data gets directly useful for product specification decisions. Three configurations were evaluated head-to-head:
| Configuration | System Utilization Rate | Grid Independence | Resilience to Outages/Weather |
|---|---|---|---|
| Case 1: PV + Storage (full system) | 88% | High — purchases grid only when PV + storage insufficient | Strong — storage buffer covers demand gaps |
| Case 2: PV only, no storage | 70% | Moderate — forced grid export of surplus, grid purchase at night | Weak — no buffer for weather or grid events |
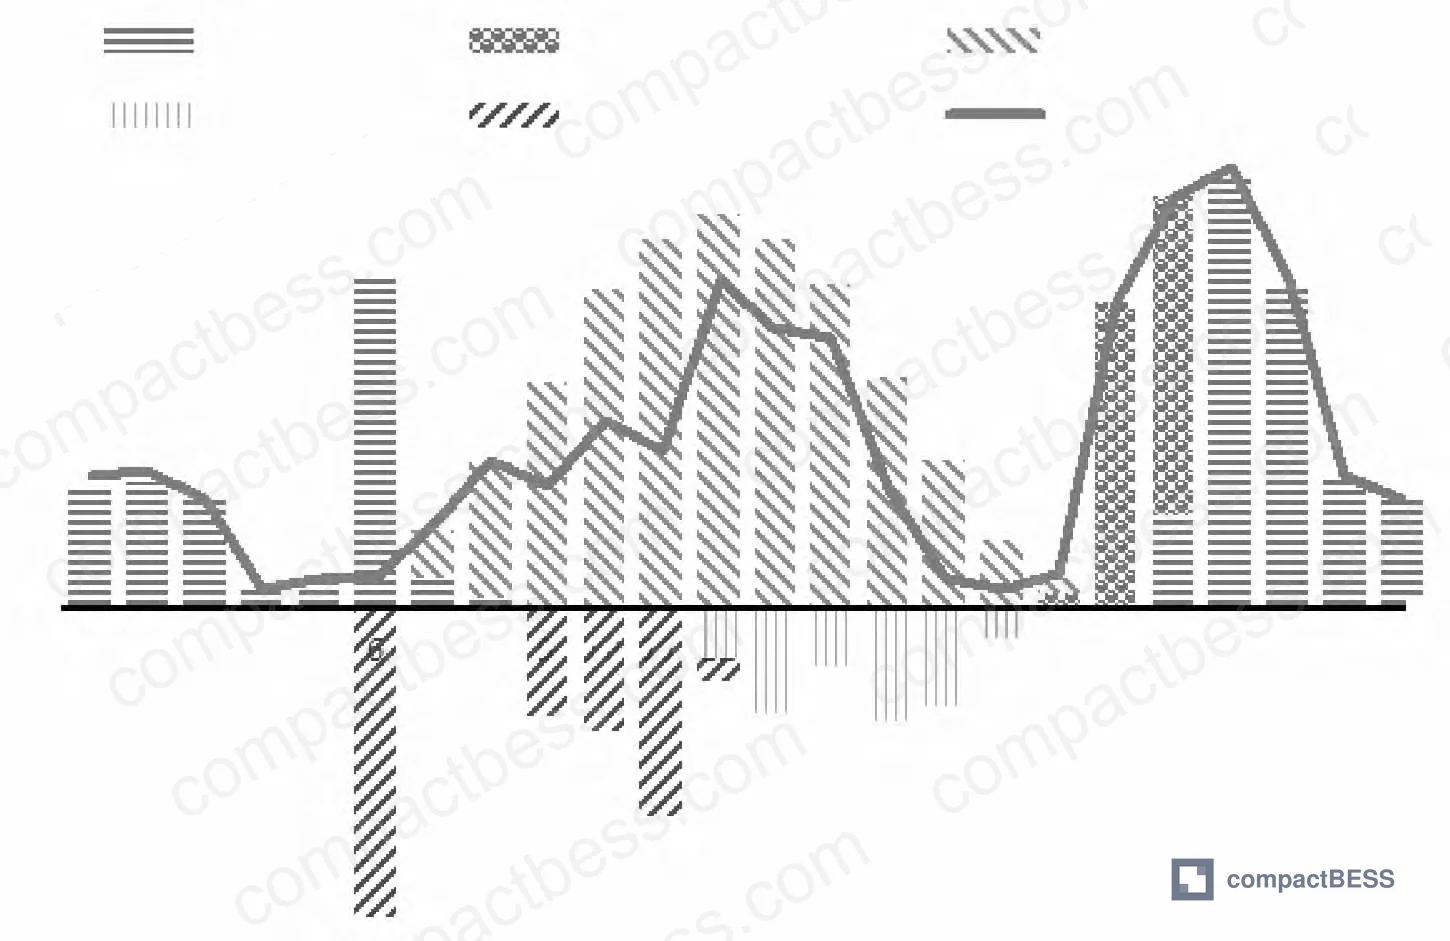
| Case 3: Storage only, no PV | Not reported separately | Low — entirely dependent on grid tariff arbitrage | Moderate — buffer exists but no generation asset |
The 18 percentage-point utilization gap between Case 1 and Case 2 has a direct cost implication: surplus energy in Case 2 must be exported to the grid at feed-in tariff rates (typically lower than retail), while Case 1 retains that energy for self-consumption at full avoided-cost value. Over 3,500 cycles, this compounds significantly.
Case 3 — storage without generation — exposes the system to the grid entirely. It can perform tariff arbitrage (charge during low-price periods, discharge during peak-price periods), but the dispatch constraint is clear: the price differential must satisfy ρ(tdis) − ρ(tch) ≥ 2CS, where CS is the per-kWh cost of one charge/discharge cycle (0.132 CNY/kWh in this design). If the grid tariff spread doesn’t cover twice the cycling cost, storage-only operation runs at a loss. Most procurement teams don’t realize that this minimum spread requirement means storage-only configurations are economically marginal in markets with flat electricity pricing — a detail that should absolutely influence how you specify storage for different end markets.
Dispatch Logic and Control Strategy: What the BMS and Controller Must Actually Do #
The optimization model isn’t just academic — it maps directly onto BMS control logic that any qualified supplier needs to implement correctly.
The dispatch priority stack works as follows:
- PV generation satisfies load directly (always first priority)
- Surplus PV charges the battery until SOC reaches 95%
- If battery is at 95%+ SOC, surplus PV is exported to the grid
- When PV is insufficient for load, battery discharges to cover the gap
- Grid purchase only occurs when both PV and battery cannot cover demand
The BMS must enforce hard stops at both the 40% SOC floor (to protect cycle life) and the 95% SOC ceiling (to prevent overcharge and reduce losses). Charge rate management is also specified: when available PV surplus is less than the battery’s rated charge power, the system charges at the actual available rate; when surplus exceeds rated charge power, the battery charges at rated power and the remainder is exported.
This sounds straightforward, but in supplier qualification, we have seen systems where the BMS ceiling cutoff was set at 100% rather than 95%, and the discharge floor was effectively 20% rather than 40%. Both deviations directly compress cycle life — and neither will show up on a standard specification sheet. You have to ask specifically, and you have to request charge/discharge logs from factory testing to verify.
Charge and discharge cannot occur simultaneously — this is a hard constraint (Xch(t) + Xdis(t) ≤ 1) that the BMS must enforce at the hardware level, not just in software. Any supplier who cannot confirm this in their BMS architecture documentation should raise a flag.
Practical Guidance for Buyers #
When you’re evaluating solar generator systems or residential BESS products for international markets, the spec sheet rarely tells you what matters. The numbers that determine long-term economics — cycle life at your actual operating DoD, round-trip efficiency across real charge rates, the SOC window the BMS actually enforces versus what the datasheet claims — require active verification.
The 30 kWh/day load baseline used in this analysis is a reasonable proxy for a mid-size residential user in Southeast Asia, the Middle East, or parts of Europe. If your target market has higher peak loads or longer grid outage durations, scale the storage-to-load ratio accordingly — but keep the 40–95% SOC operating window as a fixed design constraint. Compressing it in either direction costs you cycles.
At compactbess.com, we work directly with verified Chinese manufacturers supplying grid-connected and off-grid solar generator systems, battery packs, and BMS modules to OEM brand owners and energy storage integrators across these markets. If your technical requirements are already defined, we can match you to qualified suppliers faster than a cold sourcing exercise.
Need help identifying qualified suppliers for residential solar generator systems? Talk to our sourcing team →
Supplier Qualification Questions #
- What is the BMS-enforced SOC operating window on your solar BESS products — specifically, what are the hard upper and lower SOC cutoff thresholds, and are they set at 40% (floor) and 95% (ceiling) or configurable? Request the BMS configuration log, not just the spec sheet.
- At 60% depth of discharge with a ≥90% round-trip efficiency requirement, how many rated cycles does your battery pack guarantee — and under what temperature and charge rate conditions was that cycle life figure (target: ≥3,500 cycles) validated?
- What is the maximum continuous charge power your system supports relative to pack capacity — specifically, can you maintain ≥90% charge efficiency at the rated 3 kW charge power level, and what derating occurs above 25°C ambient?
- What is the self-discharge rate of your battery modules under standard storage conditions, and can you provide measured data showing the rate is below 0.005 per day (the target design value is 0.001)?
- Does your BMS implement a hardware-level mutual exclusion lock preventing simultaneous charge and discharge states — and can you provide schematic documentation or firmware logic showing this constraint is enforced at the hardware layer, not only in software?
Sourcing Checklist #
- [ ] Battery pack SOC operating window is confirmed as 40%–95% in BMS firmware documentation (not just claimed on datasheet)
- [ ] Round-trip charge/discharge efficiency is ≥90%, verified by factory test report under rated charge power (3 kW reference load)
- [ ] Cycle life rating of ≥3,500 cycles is documented at ≤60% DoD operating condition with test standard referenced (e.g., IEC 62619 or equivalent)
- [ ] Self-discharge rate ≤0.005/day confirmed by measured storage test data over minimum 28-day period
- [ ] System-level safety compliance verified: IEC 62133 for cell-level safety, UL 9540 for system-level installation, and UN 38.3 for transport
- [ ] BMS supports configurable charge priority stack (PV → battery → grid) with documented dispatch logic
- [ ] Simultaneous charge/discharge lockout is confirmed as hardware-enforced (not software-only)
- [ ] Levelized cost of storage can be calculated from supplier data: battery cost, rated capacity, cycle life, and round-trip efficiency all independently verifiable
Key Specifications Table #
| Parameter | Recommended Value | Verification Method |
|---|---|---|
| Battery storage capacity (residential, 30 kWh/day load) | 24 kWh (20 × 12V/100Ah units) | Review system design documentation; verify cell count and configuration |
| SOC operating window | 40% (floor) to 95% (ceiling) | Request BMS configuration log and charge/discharge cycle data from factory test |
| Cycle life at 60% DoD | ≥3,500 cycles | IEC 62619 or GB/T 36276 cycle test report at rated conditions |
| Round-trip charge/discharge efficiency | ≥90% | Factory acceptance test under rated charge power (3 kW); verify energy-in vs. energy-out measurement |
| Maximum charge power | 3 kW (for 24 kWh system) | Verify in controller/BMS spec sheet; request thermal data at sustained 3 kW charge rate |
| Self-discharge rate | ≤0.001/day | Storage test over ≥28 days at 25°C; SOC measurement at start and end |
| Levelized storage cost | ≤0.132 CNY/kWh (or local equivalent) | Calculate from: capital cost ÷ (rated capacity × cycle life × round-trip efficiency) |
Can’t find a supplier meeting these specs? Submit your requirements and we’ll match you within 48 hours.
References #
Data source: Resource Allocation Optimization for Grid-Connected Residential Distributed Photovoltaic and Battery Energy Storage Systems, L. Chen et al., Journal of the Electrochemical Society, 2024
Frequently Asked Questions #
Why is 24 kWh the recommended storage size for a 30 kWh/day residential load — shouldn’t it be larger?
The 24 kWh figure reflects the actual usable capacity within the optimized SOC window (40%–95%), combined with the fact that PV generation covers a large portion of daytime load directly without drawing on storage. Oversizing the battery bank increases capital cost without proportionally improving self-consumption — the dispatch model shows the system rarely needs to draw the battery below 60% SOC under normal conditions.
What happens to system economics if the grid tariff spread is narrow?
For a storage-only configuration, the charge/discharge cost constraint requires the electricity price differential between discharge and charge periods to exceed twice the levelized storage cost (2 × 0.132 CNY/kWh in this case). In markets with flat or near-flat tariff structures, storage-only arbitrage becomes economically marginal or loss-making. Combined PV-plus-storage avoids this problem because self-consumption value is tied to avoided retail electricity cost, not the wholesale tariff spread.
How does depth of discharge affect cycle life in practice?
At 60% DoD with the SOC held between 40% and 95%, the reference design achieves 3,500 cycles. Pushing DoD deeper — say, operating from 20% to 100% SOC — would significantly reduce cycle count on most lithium chemistries. The relationship isn’t linear: going from 60% DoD to 80% DoD typically cuts cycle life by 30–50% depending on chemistry. This is why the BMS SOC floor setting is a procurement-critical parameter.
Can this dispatch strategy be applied to off-grid solar generator products, not just grid-tied systems?
The core dispatch logic — PV first, storage second, grid third — adapts directly to off-grid configurations by replacing the grid-purchase option with a generator or simply treating grid availability as zero. The SOC protection constraints become even more critical in off-grid use, since there’s no grid backup to catch an over-discharged battery. For off-grid solar generator systems, explore our documentation at solar generator systems and portable UPS systems.
What certifications should a solar BESS product carry for export to Europe or North America?
At minimum: IEC 62619 for lithium battery safety in stationary applications, UN 38.3 for transport, and UL 9540 for system-level installation compliance in North America. For the EU, the EU Battery Regulation 2023/1542 is adding carbon footprint and due diligence requirements that will affect sourcing decisions — most procurement teams aren’t yet tracking the implementation timeline for this regulation, and that’s a risk.
Published by compactbess.com Technical Team | Request a sourcing quote


