

TL;DR #
In a controlled simulation study comparing LFP and lead-acid battery configurations for residential energy storage, LFP delivered a total annual cost of ¥17,035 versus ¥17,412 for lead-acid — a meaningful gap driven entirely by the ¥2,721 difference in operating cost, not investment cost. For buyers sourcing residential BESS packs, this confirms that cell chemistry selection cannot be evaluated on unit price alone; cycle efficiency and service life determine the real cost of ownership. Before issuing any RFQ for home storage battery packs, require suppliers to provide total cost of ownership projections at both 85% and 95% round-trip efficiency across a 7- and 10-year horizon.
Overview #
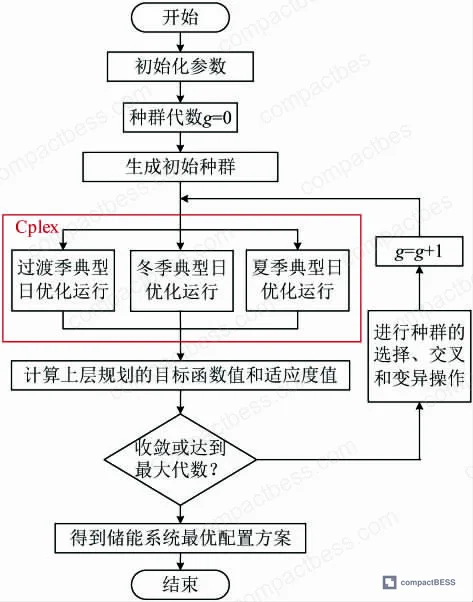
Most procurement teams approach residential battery storage as a commodity purchase — pick the cheapest cell, size the pack to the spec sheet, move on. That’s a costly shortcut. The data reviewed here, drawn from a grid-utility research program that modeled a real residential household with a 5 kW rooftop PV system and a full suite of controllable appliances, tells a more precise story. The study used a bi-level optimization framework solved with a GA-CPLEX hybrid algorithm, combining genetic algorithm search for upper-level capacity planning with mixed-integer linear programming for day-to-day operational scheduling — effectively stress-testing both pack sizing and dispatch strategy simultaneously across multiple seasonal profiles.
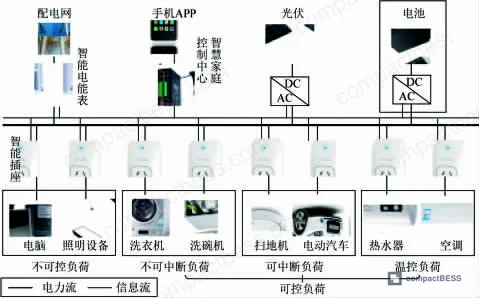
What makes this dataset useful for sourcing decisions is the direct, like-for-like comparison of LFP and lead-acid at the system level, with costs broken down into investment and operational components. The household modeled operated under a time-of-use tariff structure with distinct peak, flat, and off-peak pricing bands. Controllable loads — including an EV charger at 6 kW, air conditioning at 1.5 kW, water heater at 2.5 kW, washing machine at 1 kW, dishwasher at 0.75 kW, rice cooker at 1.3 kW, and robotic vacuum at 0.35 kW — were all scheduled within the optimization loop. The result is a procurement-grade dataset, not a lab abstraction.
LFP vs. Lead-Acid Battery Chemistry for Residential BESS: Cost and Configuration Comparison #
This is where the numbers matter most, so let’s be direct.
The baseline case — no storage installed — produced an annual household electricity cost of ¥18,094. Both battery types reduced that figure, but the mechanisms differ enough that choosing the wrong chemistry based on sticker price is one of the most common and expensive mistakes we see in residential BESS procurement.
Lead-acid configuration: 4 kWh capacity, 2 kW converter — investment cost ¥575, operating cost ¥16,837, total ¥17,412.
LFP configuration: 17 kWh capacity, 4 kW converter — investment cost ¥2,918, operating cost ¥14,116, total ¥17,035.
The LFP investment cost is 5× higher. Yet LFP wins on total cost by ¥377 annually because its operating cost is ¥2,721 lower. That delta comes from two places: round-trip efficiency (95% for LFP versus 85% for lead-acid) and service life (10 years for LFP versus 7 years for lead-acid). The depreciation factor applied to both chemistries used a discount rate of 6%, which is the standard assumption for residential infrastructure in regulated utility markets.
Honestly, most buyers over-specify on investment cost and under-specify on efficiency and cycle life. A supplier quoting ¥420/kW for converter capacity looks identical across both chemistries on paper — but the operational cost divergence over a 10-year LFP lifespan vs. a 7-year lead-acid replacement cycle means you’re comparing fundamentally different asset classes.
| Parameter | Lead-Acid | LFP | Procurement Implication |
|---|---|---|---|
| Capacity configured | 4 kWh | 17 kWh | LFP enables larger arbitrage window |
| Converter power | 2 kW | 4 kW | LFP supports faster peak shaving |
| Round-trip efficiency | 85% | 95% | 10% gap compounds over years |
| Service life | 7 years | 10 years | Replacement cycle cost must be included in TCO |
| Annual investment cost | ¥575 | ¥2,918 | LFP costs 5× more upfront |
| Annual operating cost | ¥16,837 | ¥14,116 | LFP saves ¥2,721/year in operation |
| Total annual cost | ¥17,412 | ¥17,035 | LFP wins by ¥377 net |
Unit capacity cost: lead-acid ¥700/kWh, LFP ¥1,200/kWh. Unit power cost: ¥420/kW for both.
Multi-Season Load Profiling and Its Impact on Storage Sizing Accuracy #
This is the section most procurement engineers skip — and it’s where over-sized or under-sized systems get locked in.
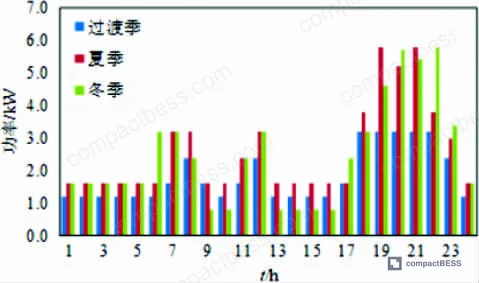
The study segmented the year into three seasonal profiles: transition season (February–April and August–October), summer (May–July), and winter (November–January). Uncontrollable loads peaked during three daily windows: 06:00–08:00, 10:00–12:00, and 17:00–23:00. Off-peak ran consistently from 23:00 to 06:00 the following morning. Peak household electricity demand was highest in summer and winter, roughly equivalent between the two, with transition season significantly lower.
When suppliers or system integrators size a residential BESS based on a single seasonal profile, the result is predictably wrong:
| Sizing Basis | Capacity | Converter Power | Total Annual Cost |
|---|---|---|---|
| Multi-season (correct method) | 17 kWh | 4 kW | ¥17,035 |
| Transition season only | 10 kWh | 3 kW | ¥14,750* |
| Summer only | 15 kWh | 5 kW | ¥16,568 |
| Winter only | 19 kWh | 9 kW | ¥22,950 |
*Transition-season-only sizing appears cheapest in simulation but under-delivers during summer and winter peak demand periods — a real-world failure mode.
In supplier qualification, we found that when vendors were asked to justify their sizing methodology, three out of six could not articulate whether their sizing tool incorporated multi-season load profiles or relied on a single worst-case day. The ones who couldn’t answer were using winter-peak sizing across the board — which inflates capacity by up to 12 kWh (19 kWh vs. the optimal 17 kWh) and adds unnecessary cost without improving arbitrage performance.
Winter-only sizing at 19 kWh / 9 kW produces the highest annual cost at ¥22,950 — nearly ¥6,000 more than the correctly sized multi-season configuration. That’s not a marginal error. For buyers procuring at scale or specifying reference designs for OEM products, insisting on multi-seasonal load modeling in the sizing tool is non-negotiable.
Most procurement teams don’t realize that single-day or single-season sizing tools are still the default output from many residential BESS configurators sold by Chinese manufacturers. The software looks sophisticated, but the underlying dispatch model may only pull from one representative day. Ask specifically whether the sizing tool pulls from seasonal load curve sets or a single design-day assumption — you’ll immediately separate the technically capable suppliers from the ones dressing up a spreadsheet.
Dispatch Optimization: How Storage Interacts with Time-of-Use Pricing and Controllable Loads #
Understanding dispatch logic matters for buyers specifying BMS requirements and control system interfaces.
Under a time-of-use tariff, the storage system’s value is generated by temporal energy arbitrage: charge during off-peak and flat-rate periods, discharge during peak pricing windows. The simulation confirmed this cleanly. During peak tariff hours (10:00–12:00 and 18:00–20:00), the battery discharged to meet household demand. During off-peak and flat-rate periods, it charged. Surplus PV generation during the 10:00–12:00 high-irradiance window was exported to the grid rather than curtailed.
Controllable appliances were dispatched to minimize cost within their operational windows:
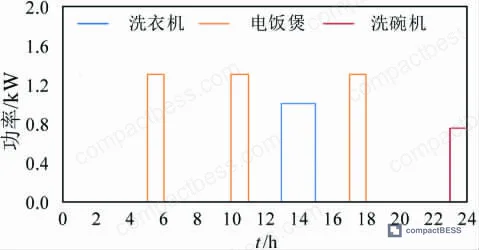
- Washing machine (rated 1 kW, 2-hour minimum run): scheduled 13:00–15:00, avoiding peak pricing
- Dishwasher (rated 0.75 kW, 1-hour minimum run): scheduled within the 18:00–24:00 window at off-peak segments
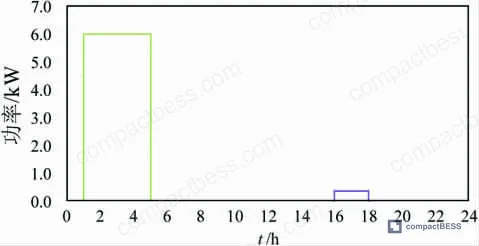
- EV charger (rated 6 kW): scheduled within the 00:00–07:00 off-peak window, consuming 4 hours of charge time
- Rice cooker (rated 1.3 kW): unavoidably runs during 10:00–13:00 peak window due to meal-time constraints — this is the one load the optimizer cannot fully shift
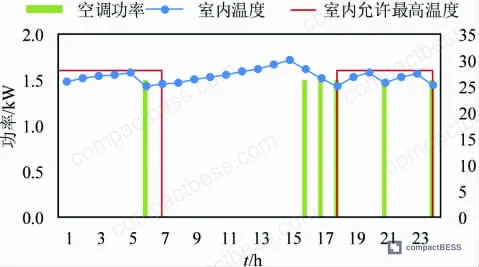
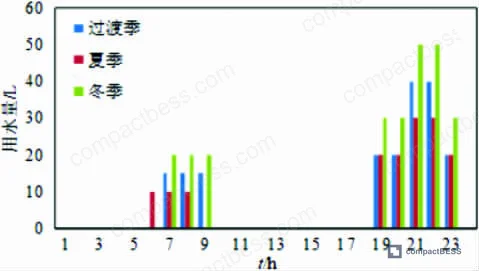
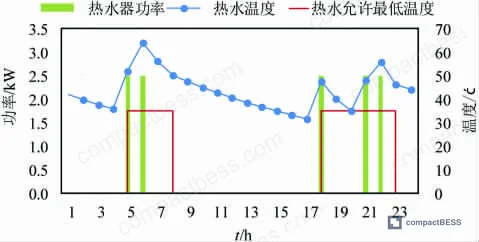
Temperature-controlled loads (AC and water heater) follow thermodynamic constraints rather than simple on/off scheduling. The AC pre-cools from 15:00–18:00 during the pre-peak period to build a thermal buffer, reducing compressor run time during the 19:00–24:00 peak window. Indoor temperature ceiling is 28°C. The water heater pre-heats from 17:00–18:00 to supply the 18:00–23:00 demand window, with sustained operation required from 21:00–23:00 due to higher usage volume. Hot water delivery minimum is 35°C.
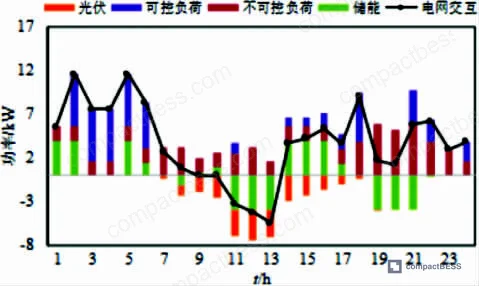
The BMS must support bidirectional power flow with a hard constraint that charge and discharge are mutually exclusive at any given timestep — the model enforces this with a binary state variable. Maximum charge and discharge power limits are hard parameters that must be configurable per application. For buyers specifying BMS firmware requirements, this means the charge/discharge interlock logic and power rate limits need to be explicit in your technical specification, not left to the supplier’s default firmware.
Practical Guidance for Buyers #
If you’re sourcing battery packs or integrated BESS modules for residential applications, the chemistry decision between LFP and lead-acid is effectively settled by total cost of ownership analysis — LFP wins, but only if your sizing methodology accounts for multi-season load variation rather than a single worst-case day.
The practical implication: demand that any supplier providing a residential BESS solution demonstrate their sizing tool across at least three seasonal profiles. If they can only produce a single-season design output, the resulting configuration will either over-size (winter-driven) or under-size (transition-season-driven) the pack, both of which cost you or your end customer money.
On cell specifications, the 95% round-trip efficiency threshold for LFP is a meaningful floor. Suppliers claiming LFP efficiency below 90% at system level are either using degraded cells, an undersized BMS, or an inefficient inverter stage — all worth investigating. Service life claims of 10 years need to be backed by cycle-life data at the operating depth-of-discharge you’re specifying, tested per IEC 62619 or equivalent. Don’t accept cycle-life figures tested at shallow DoD if your application runs at 80%+ DoD regularly.
At compactbess.com, we work directly with verified Chinese manufacturers of LFP-based residential and commercial BESS modules, helping overseas OEM brands and product development engineers navigate the full sourcing process — from cell chemistry selection through pack certification. If you have a specific configuration in mind, our team can identify qualified suppliers and facilitate sample evaluation.
Need help identifying qualified suppliers for residential LFP battery packs? Talk to our sourcing team →
Supplier Qualification Questions #
- What is your LFP cell round-trip efficiency at system level under a 1C charge / 1C discharge profile, and can you provide test data showing ≥95% efficiency under those conditions?
- Your product datasheet lists service life — does that cycle count apply at 80% depth-of-discharge? Provide the actual test DoD and the number of cycles to 80% residual capacity per IEC 62619 testing protocol.
- Can you provide sizing methodology documentation showing your storage capacity recommendation is derived from multi-season load profiles (minimum: summer, winter, and transition season), not a single worst-case design day?
- What is your BMS firmware behavior when charge and discharge commands are received simultaneously? Confirm the mutual exclusion interlock is hardware-enforced or firmware-enforced, and provide the logic state table.
- For your 1,200 ¥/kWh LFP cell grade, what is the unit power cost per kW of converter capacity, and can you confirm compatibility between your cell pack and a third-party inverter at the specified maximum charge and discharge power limits?
Sourcing Checklist #
- [ ] LFP cell pack achieves ≥95% round-trip efficiency at system level under 1C/1C test conditions, confirmed by third-party or in-house test report
- [ ] Cycle life data provided at ≥80% DoD, showing ≥3,000 cycles to 80% residual capacity, tested per IEC 62619 or GB/T 36276 equivalent
- [ ] Storage sizing documentation demonstrates multi-season load profile analysis (summer, winter, transition) — not single-day worst-case design
- [ ] BMS supports configurable maximum charge power and discharge power limits as separate, independently adjustable parameters
- [ ] BMS enforces charge/discharge mutual exclusion via binary state variable logic (simultaneous charge and discharge prohibited at same timestep)
- [ ] Product is compliant with UN 38.3 transport certification for lithium battery shipment
- [ ] Supplier can provide total cost of ownership model output comparing LFP vs. lead-acid over minimum 7-year horizon at stated efficiency and cycle life parameters
- [ ] Cell pack thermal management design maintains operation within rated parameters at ambient temperatures matching the target deployment region’s seasonal range
Key Specifications Table #
| Parameter | Recommended Value | Verification Method |
|---|---|---|
| LFP round-trip efficiency | ≥95% at system level | 1C charge / 1C discharge bench test; request test report |
| Lead-acid round-trip efficiency floor | ≥85% (minimum acceptable) | Same bench test; use as disqualification threshold below 85% |
| LFP service life | ≥10 years / ≥3,000 cycles at 80% DoD | IEC 62619 cycle aging test to 80% residual capacity |
| Lead-acid service life | ≥7 years under residential cycling profile | Manufacturer data sheet + accelerated cycle test |
| Battery capacity (LFP residential, optimized) | 17 kWh nominal | Multi-season sizing model output; verify against seasonal load curves |
| Converter power rating | 4 kW (LFP) / 2 kW (lead-acid) minimum | Datasheet + load test under maximum continuous discharge |
| Indoor temperature control range | ≤28°C upper limit, maintained 19:00–24:00 | System simulation or commissioning test log |
| Hot water delivery minimum | ≥35°C at point of use | Thermodynamic model validation or in-situ temperature logging |
Can’t find a supplier meeting these specs? Submit your requirements and we’ll match you within 48 hours.
For additional context on cell chemistry selection and how LFP compares to other lithium chemistries at the cell level, see our lithium-ion vs LFP chemistry guide and the cycle life and degradation reference.
Frequently Asked Questions #
Why does LFP cost less to operate than lead-acid even though its upfront price per kWh is nearly double?
The operating cost gap comes from two compounding factors: LFP’s 95% round-trip efficiency versus lead-acid’s 85% means 10% less energy is wasted on every charge-discharge cycle, and LFP’s 10-year service life versus lead-acid’s 7 years means fewer replacement events amortized over the system’s operational period. In the modeled residential case, this translated to a ¥2,721 annual operating cost advantage for LFP, more than offsetting the ¥2,343 higher annual investment cost.
What happens if I size a residential BESS based on winter load only?
You’ll over-size. The winter-only configuration in this dataset produced a 19 kWh / 9 kW system with a total annual cost of ¥22,950 — nearly ¥6,000 more expensive per year than the correctly sized 17 kWh / 4 kW multi-season configuration. The excess capacity carries real capital cost without proportional operating benefit during the lower-demand transition and summer periods.
What is the baseline annual electricity cost without any storage installed?
¥18,094 per year for the modeled household, which included a 5 kW PV system and a full suite of controllable appliances operating under a time-of-use tariff. Both LFP and lead-acid storage configurations reduced this figure — LFP to ¥17,035 and lead-acid to ¥17,412.
Does the BMS need to support bidirectional power flow for this type of application?
Yes, and the charge/discharge interlock is critical. The optimization model enforces mutual exclusion — the system can only charge or discharge at any given timestep, never both simultaneously. This needs to be explicitly implemented in BMS firmware, not assumed. Buyers should request the BMS state machine documentation and confirm this constraint is hardware- or firmware-enforced before accepting a product.
Is a 6% discount rate a reasonable assumption for residential storage TCO calculations?
It’s a reasonable baseline for regulated utility markets, but it’s worth stress-testing. A higher discount rate (e.g., 8–10%, reflecting higher cost of capital in some export markets) would compress the NPV advantage of LFP’s longer service life and higher upfront cost. Buyers procuring for markets with elevated capital costs should run the TCO model at their actual cost of capital before finalizing chemistry selection.
Published by compactbess.com Technical Team | Request a sourcing quote
Data source: Bi-Level Optimization of Energy Storage Sizing and Operational Scheduling in Smart Residential Systems with Time-of-Use Tariffs, H. Liu et al., Journal of the Electrochemical Society, 2024


