

TL;DR #
After more than 8,000 full-depth cycles, a 125 Ah prismatic LFP cell releases comparable thermal runaway energy to a fresh cell — but takes 20–26 minutes to reach peak temperature versus 10–22 minutes at beginning of life, meaning aged cells are not safer, just slower to ignite. For buyers specifying energy storage cells under IEC 62619, this finding means end-of-life safety behavior must be independently validated, not inferred from BOL certification data alone. Before accepting any 125 Ah-class prismatic LFP cell for BESS integration, require that your supplier provide both BOL and EOL thermal runaway test data against GB/T 36276 or equivalent.
Overview #
Most procurement teams treat cell safety certification as a one-time gate — pass the abuse tests at incoming inspection, ship the product, close the file. That assumption gets expensive when the cells have been in a rack for five years. The evaluation discussed here was conducted on commercially produced 125 Ah prismatic aluminum-shell LFP cells (chemistry: LFP/artificial graphite, electrolyte system LiPF₆/EC/EMC/VC with sulfur and fluorine additives) from a scaled manufacturing line, using a matched sample set across three critical abuse test categories: thermal runaway by external heating, external short circuit, and overcharge. Cells were aged both by room-temperature cycling at 100% DOD and by accelerated thermal exposure at 80°C, allowing direct BOL-versus-EOL comparison on identical cell type and production batch. This is exactly the kind of full-lifecycle safety dataset that buyers integrating into grid or industrial BESS applications should be demanding from suppliers — and rarely do.
The test protocol referenced throughout is GB/T 36276-2023, China’s national standard for lithium-ion batteries in stationary energy storage, which aligns substantively with IEC 62619:2022 requirements for industrial battery safety. Understanding how cell safety properties shift from BOL to EOL is not academic — it directly informs BMS protection threshold design, thermal management specifications, and end-of-life decommissioning risk.
IEC 62619 Thermal Runaway Performance: BOL vs. EOL in 125 Ah LFP Prismatic Cells #
This is where the data gets uncomfortable for anyone who has signed off on a safety certification and assumed it covers the cell’s entire service life.
At beginning of life, three 125 Ah cells (BOL group) subjected to external heater-triggered thermal runaway per GB/T 36276 showed self-heating onset temperatures (T1) of 69°C, 105.4°C, and 66°C respectively. Thermal runaway trigger temperatures (T2) were 101.2°C, 107.6°C, and 93.9°C. Peak temperatures (T3) reached 450.1°C, 382.4°C, and 417.2°C. Using Q = C × m × (T3 − T1) with specific heat capacity of 1329.44 J/(kg·°C) and cell mass of 2.45 kg, the instantaneous heat release for these three BOL cells calculated to approximately 1241.29 kJ, 902.22 kJ, and 1143.90 kJ.
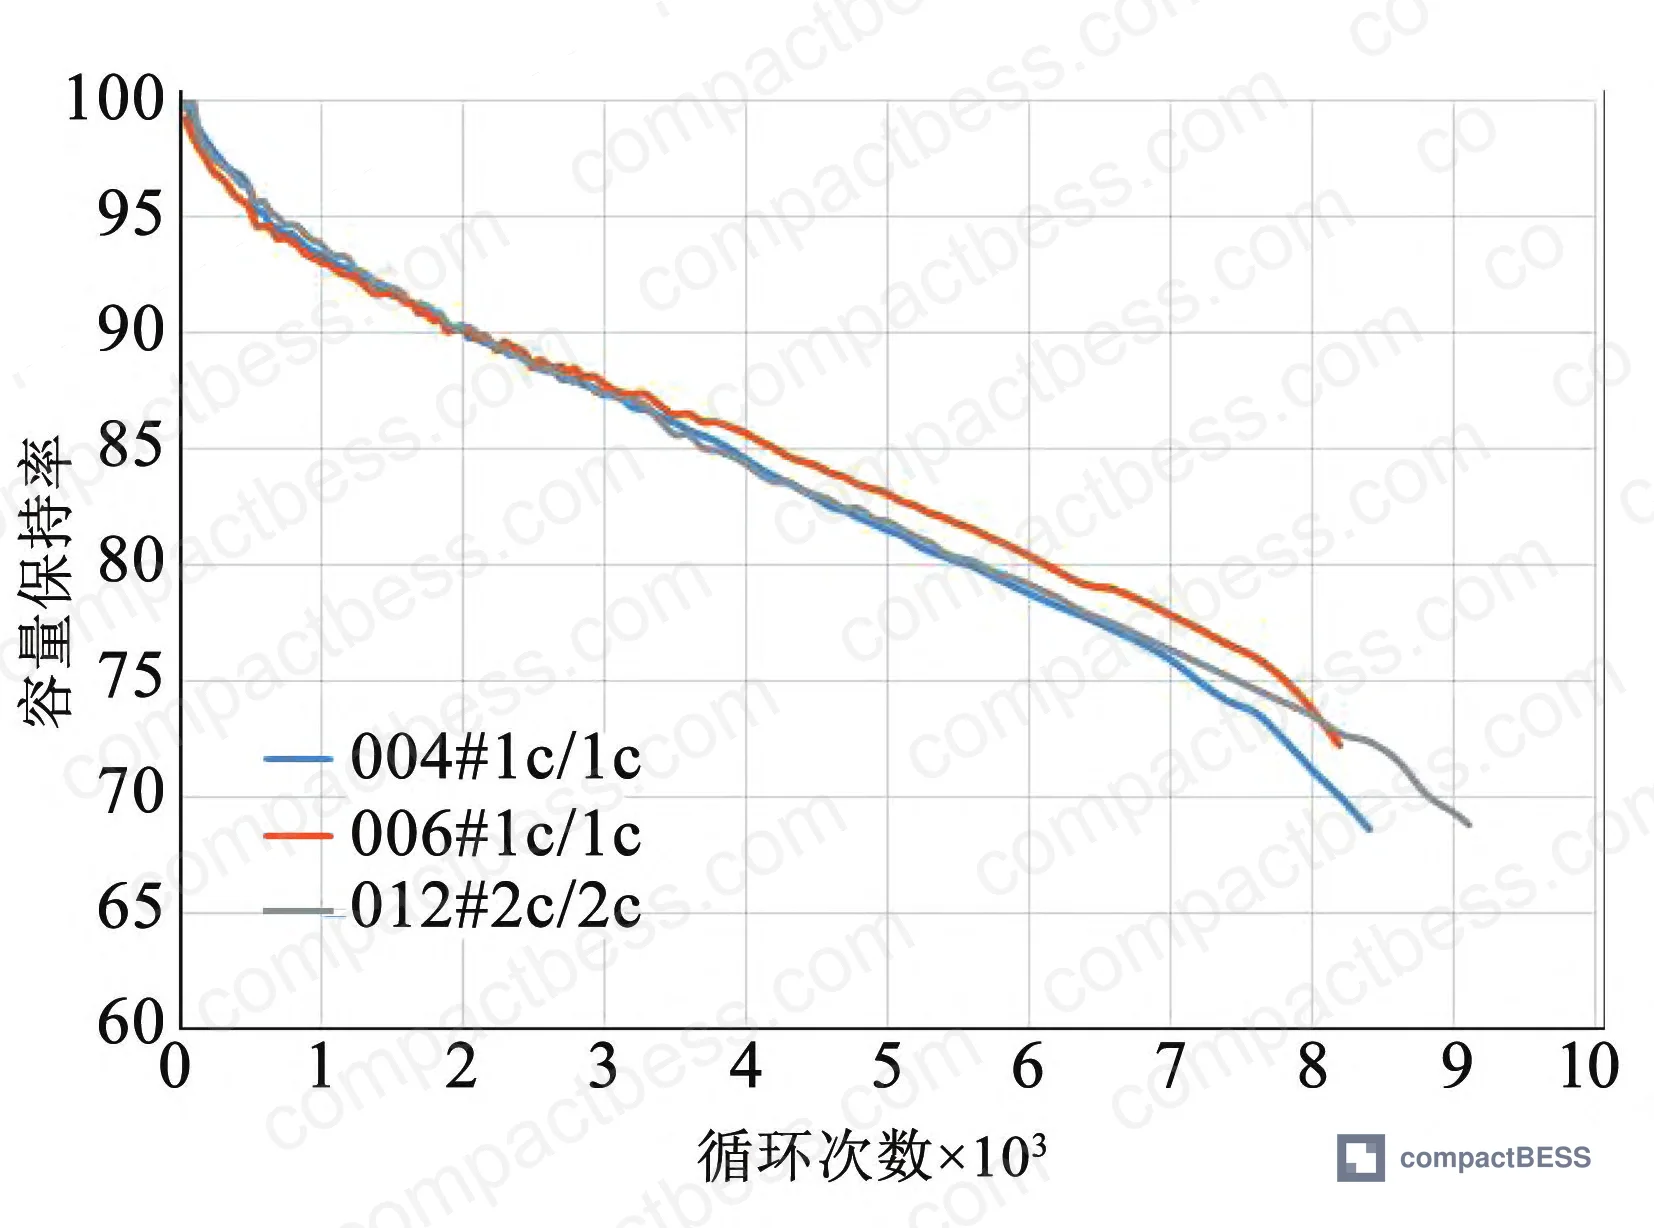
The EOL cells — aged to approximately 70% SOH after 8,200–9,100 cycles — told a different story on timing, not on energy. EOL T1 values were 56.2°C, 75°C, and 74.2°C. T2 values were 76.2°C, 98.5°C, and 87.9°C. T3 values were 324.4°C, 383.6°C, and 384.1°C. Calculated heat release: 873.56 kJ, 1005.15 kJ, and 1009.38 kJ — broadly comparable to BOL values, not substantially reduced. The critical difference is the time dimension: BOL cells reached thermal runaway peak in 10–22 minutes from self-heating onset; EOL cells took 20–26 minutes. EOL cells also showed better temperature curve consistency across the three samples and no abrupt voltage spikes during the self-heating phase.
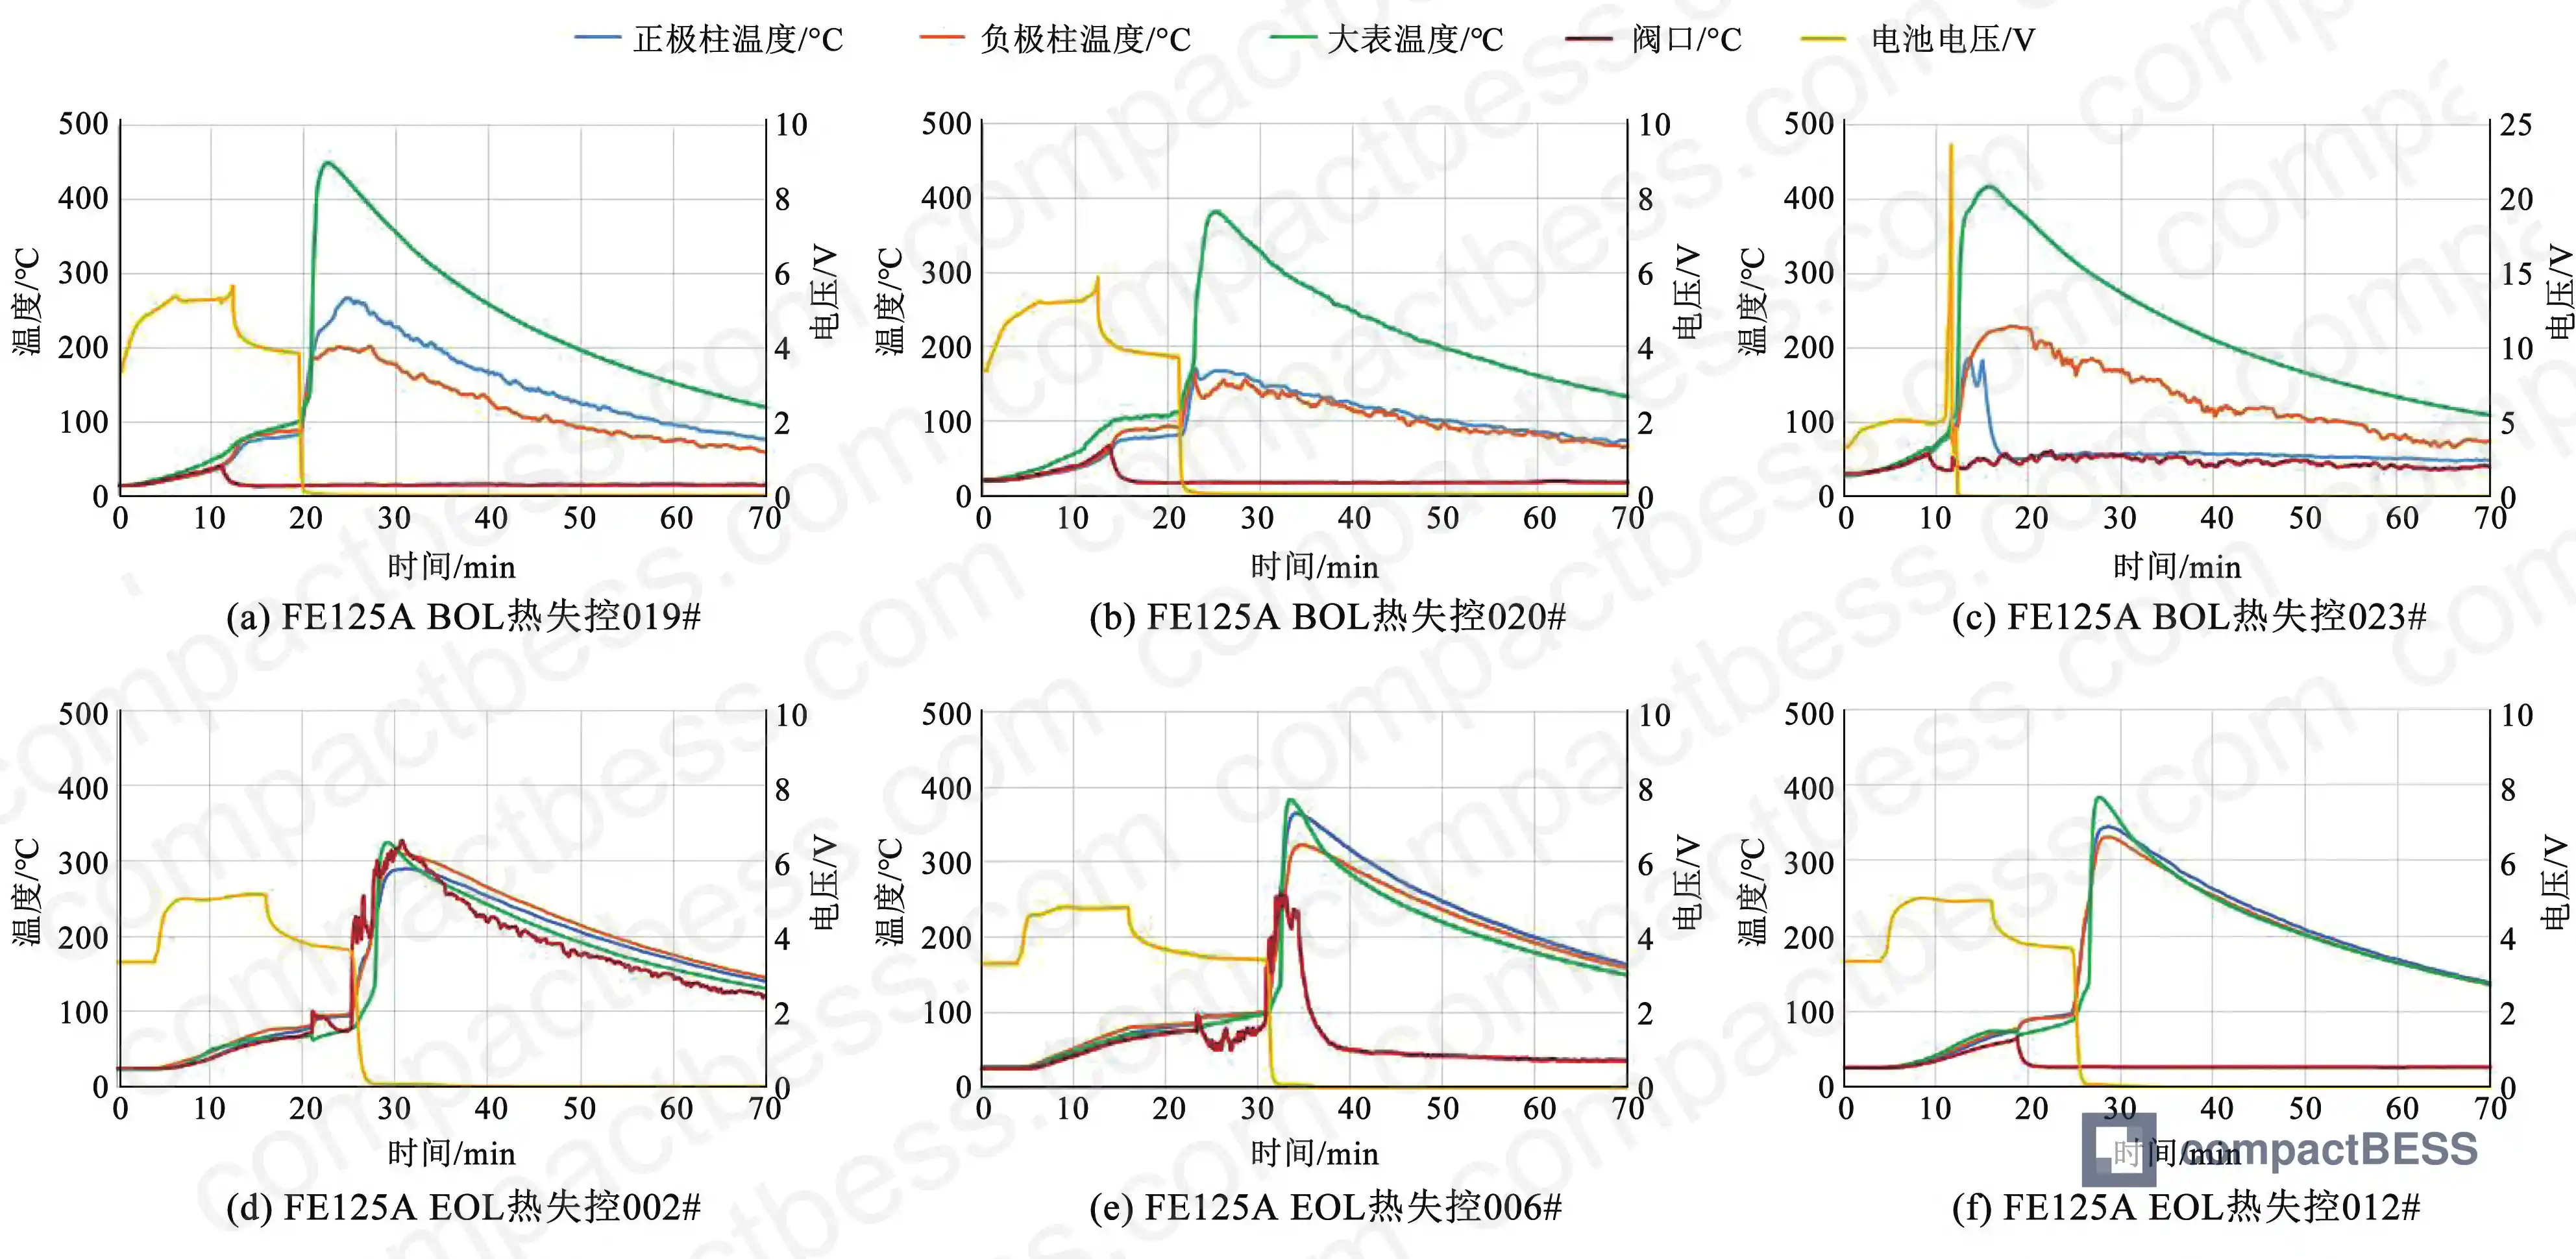
What does this mean practically? The total hazard energy is not diminished at end of life. The safety vent activated in all tested cells regardless of aging state. Any BESS thermal management system designed around BOL thermal runaway propagation timing will have a longer intervention window with aged cells — but the thermal energy released when things do go wrong remains in the same order of magnitude. Design your pack-level thermal barriers accordingly.
| Parameter | BOL Cells (avg, 3 samples) | EOL Cells (avg, 3 samples) | Delta |
|---|---|---|---|
| T1 – Self-heating onset (°C) | 69 / 105.4 / 66 | 56.2 / 75 / 74.2 | Lower at EOL |
| T2 – TR trigger temperature (°C) | 101.2 / 107.6 / 93.9 | 76.2 / 98.5 / 87.9 | Lower at EOL |
| T3 – Peak temperature (°C) | 450.1 / 382.4 / 417.2 | 324.4 / 383.6 / 384.1 | Comparable |
| Heat released Q (kJ) | 1241.3 / 902.2 / 1143.9 | 873.6 / 1005.2 / 1009.4 | Comparable |
| Time to TR peak (min) | 10–22 | 20–26 | +Longer at EOL |
| Temp curve consistency | Variable | More uniform | Better at EOL |
Can’t find a supplier meeting these specs? Submit your requirements and we’ll match you within 48 hours.
Short Circuit and Overcharge Safety Behavior at End of Life #
Short Circuit #
The short circuit test is one place where EOL cell behavior diverges from BOL in a way that is actually informative for BMS design. Per the test protocol — external short circuit with circuit resistance below 5 mΩ, 10-minute duration, followed by 1-hour observation — BOL cells showed peak short-circuit currents of 3267.6 A, 2896.8 A, and 2968.2 A, with current decaying linearly from peak to zero after the short event.
EOL cells showed lower initial peak currents of 2949.6 A, 2860.2 A, and 2737.6 A — consistent with reduced available capacity. But the waveform shape changed: after the initial current drop, EOL cells exhibited a distinct secondary current peak (sub-high point) in the 1450–1700 A range before final decay to zero. Voltage waveforms mirrored this same secondary feature simultaneously.
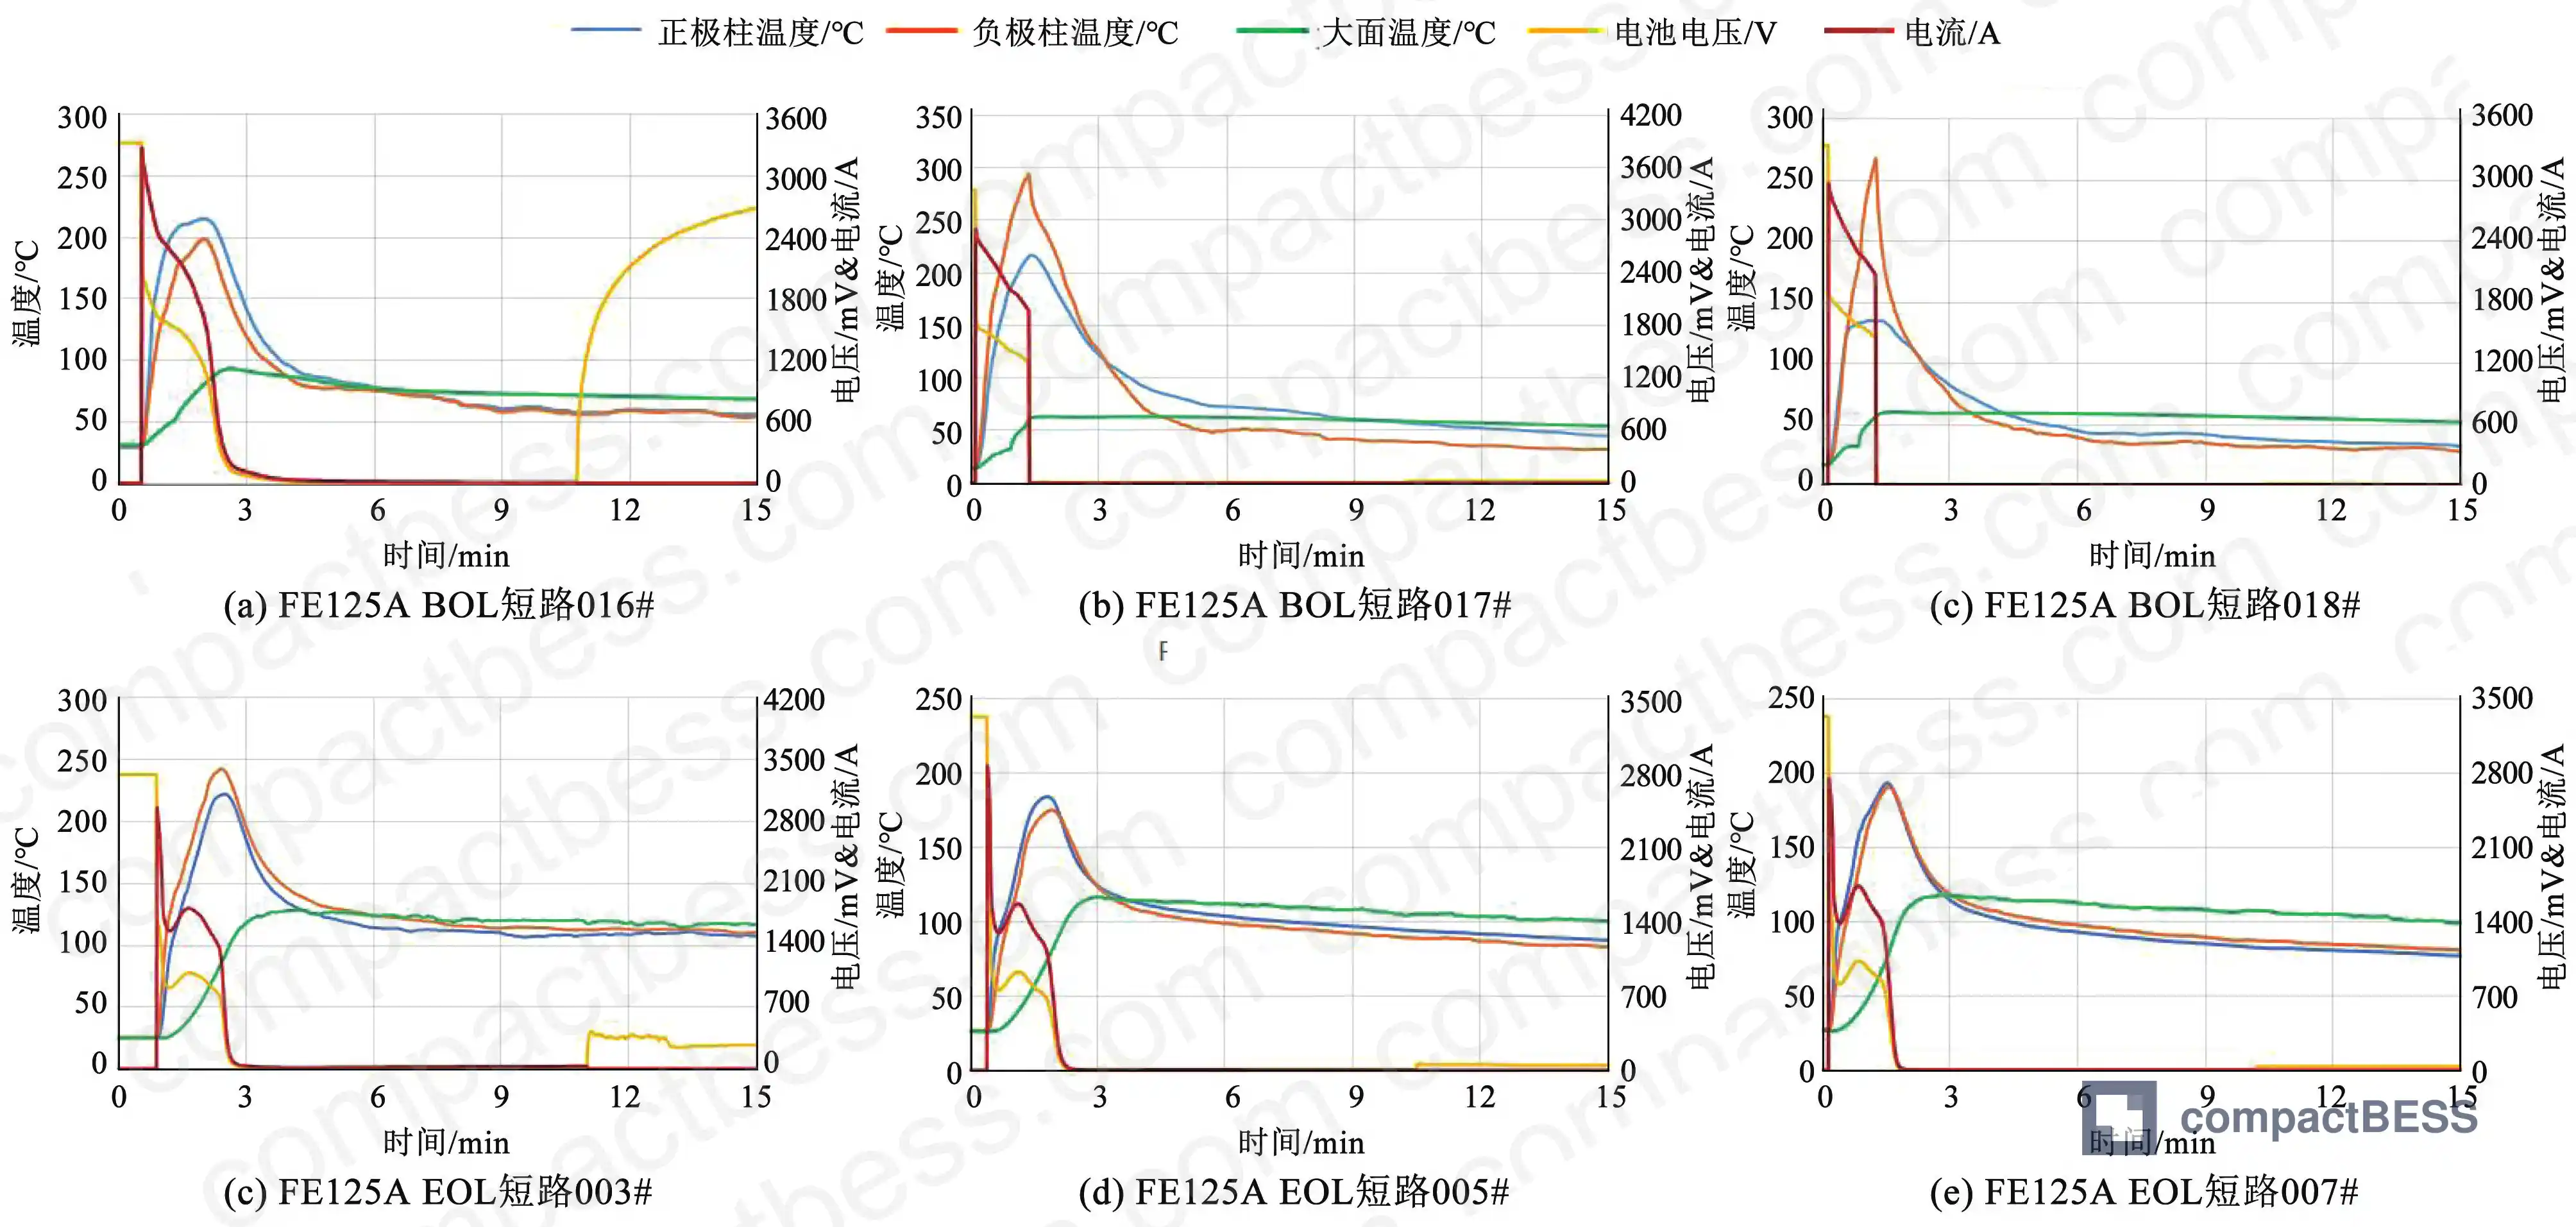
The mechanism behind this sub-peak is well understood: as internal temperature rises during the short event, concentration polarization in the aged electrolyte/electrode system decreases, temporarily reducing internal resistance and allowing a secondary current surge. Critically, none of the EOL short-circuit test cells vented or caught fire — all showed swelling only. This is good news for system designers but only if the BMS current sensing and protection circuitry is fast enough and accurate enough to respond correctly to the non-monotonic current waveform that EOL cells produce.
Honestly, most buyers specifying BMS protection thresholds don’t account for this waveform shape change. They set overcurrent cutoffs calibrated to BOL cell behavior and assume EOL cells will behave similarly. They won’t — and a secondary current peak can look like a normal transient to firmware that isn’t specifically programmed to catch it.
Overcharge #
The overcharge test followed GB/T 36276 protocol: constant-current charge at 1C to 1.5× nominal cutoff voltage (stopping at 5.475 V) or 1-hour time limit, with 1-hour post-test observation.
BOL cells (three samples) showed peak voltages of 5.13 V, 5.11 V, and 5.41 V before settling back to the 5.475 V cutoff, with peak temperatures between 70.8°C and 85.3°C. Time to reach target voltage: 13.8–14.5 minutes.
EOL cells reached target voltage in 13.2–13.7 minutes — marginally faster. But the outcome spread was dramatic. Of three EOL overcharge test cells, one (cell 008#) underwent full thermal runaway, with the large-face temperature reaching 362.5°C. The other two (009# and 014#) showed maximum large-face temperatures of only 93.5°C and 59.7°C respectively — no thermal runaway. This is the most important failure datum in the entire dataset.
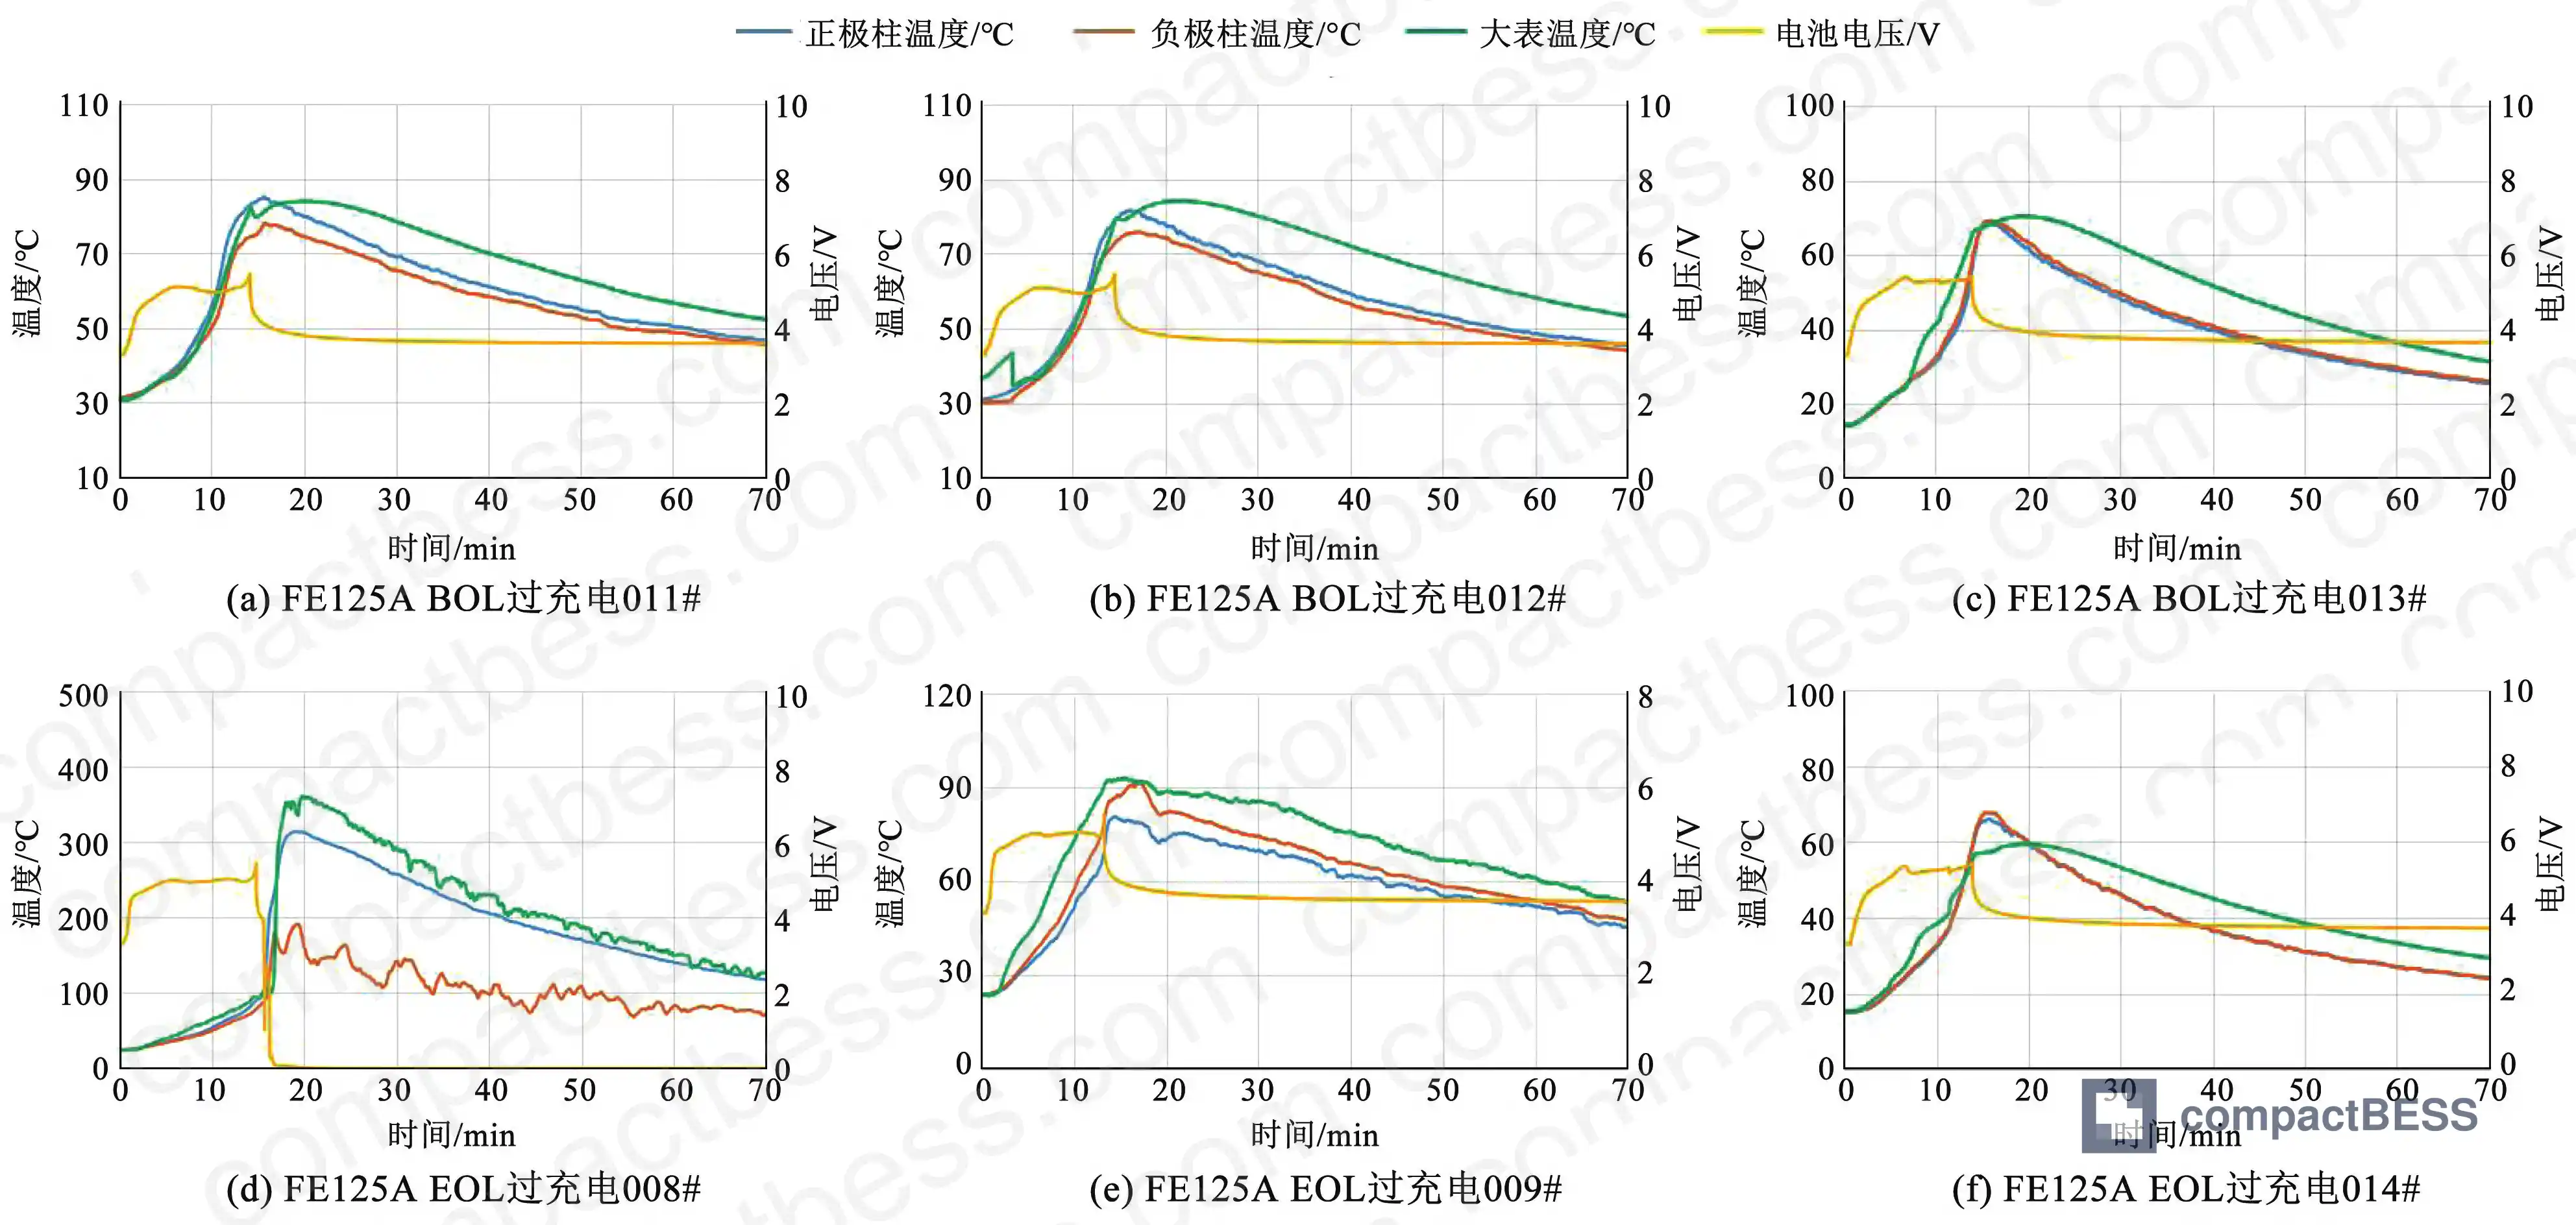
In supplier qualification, we’ve seen exactly this pattern — where three of six aged samples show divergent safety outcomes under identical abuse conditions. The cell that ran away was not defective by any incoming inspection standard. It had cycled normally, met capacity retention criteria, and showed no anomalies before the overcharge event. What the data confirms is that overcharge tolerance is the safety property most sensitive to aging state, and that at end of life, the gap between a “safe” overcharge outcome and a thermal runaway event narrows considerably.
This has direct implications for BMS overcharge protection design in systems expected to serve 8,000+ cycle lifetimes. The BMS voltage protection window that was conservative at BOL may be inadequate at EOL.
Practical Guidance for Buyers #
If you are procuring 125 Ah-class prismatic LFP cells for industrial BESS applications — and especially if your end-use system falls under IEC 62619:2022 compliance requirements — the standard certification package your supplier provides covers new cells. Full stop. It tells you almost nothing about what those cells will do at 70% SOH after years of cycling.
The data reviewed here should shift how you write your procurement specifications. First, require EOL safety test data, not just BOL. Any qualified supplier working in the stationary storage space should be able to provide cycling-aged sample test results for the three core abuse categories: thermal runaway, short circuit, and overcharge. If they can’t or won’t, treat that as disqualifying. Second, pay attention to the overcharge EOL results specifically — the divergence between cell outcomes under identical conditions tells you that capacity-retention alone is an insufficient aging proxy for safety behavior. You need to know the overcharge voltage response and temperature behavior at end-of-life SOH thresholds.
At compactbess.com, we work directly with verified Chinese manufacturers of prismatic LFP cells and battery pack assemblies, helping OEM brand owners and energy storage integrators across North America, Europe, and the Middle East navigate exactly these technical qualification questions before initiating procurement. If your project requires full-lifecycle safety data as part of supplier onboarding, our sourcing team can help you identify manufacturers who maintain it.
Need help identifying qualified suppliers for industrial-grade prismatic LFP BESS cells? Talk to our sourcing team →
Supplier Qualification Questions #
- Can you provide thermal runaway test data (per GB/T 36276-2023 or IEC 62619:2022) for cells at both beginning-of-life and end-of-life, specifically showing T1 self-heating onset, T2 trigger temperature, and T3 peak temperature values?
- What is the heat release delta (Q = C × m × [T3 − T1]) between your BOL and EOL thermal runaway test cells, and is EOL Q within 20% of BOL Q for your 125 Ah-class prismatic format?
- In your external short-circuit test data (circuit resistance <5 mΩ, 10-minute duration), do EOL cells exhibit a secondary current sub-peak, and if so, at what current range does it appear relative to the initial peak current?
- For your overcharge EOL test (1C to 1.5× cutoff voltage per GB/T 36276), what is the cell-to-cell consistency of thermal outcome across your aged sample set — specifically, has any aged cell triggered thermal runaway where others in the same test batch did not?
- What aging protocol do you use to qualify EOL safety samples — specifically, what cycle count and/or accelerated thermal exposure conditions (e.g., 80°C storage at 100% DOD) do you apply, and what minimum capacity retention threshold defines your EOL state for safety re-testing purposes?
Sourcing Checklist #
- [ ] Supplier provides thermal runaway test report showing T1, T2, and T3 temperature data for both BOL and end-of-life cells (≥70% SOH), per GB/T 36276-2023 or IEC 62619:2022
- [ ] EOL thermal runaway heat release (Q) is documented and falls within comparable range to BOL values (not more than 30% lower, confirming hazard energy is not negligible at end of life)
- [ ] Short-circuit test conducted at external resistance <5 mΩ for 10-minute duration, with waveform data confirming presence or absence of secondary current sub-peak in aged cells
- [ ] Overcharge test data available for EOL-state cells at 1C rate to 1.5× nominal cutoff voltage, with temperature outcomes documented per cell — not reported as a single-sample pass/fail
- [ ] Cells cycled to EOL state show capacity retention documented per cycle log (target: ~70% SOH after 8,000+ cycles at 100% DOD, 1C/1C or 2C/2C at 25°C ± 2°C)
- [ ] Cell physical dimensions verified: thickness 36 mm, width 130 mm, height 235 mm (for 125 Ah prismatic format); mass 2.45 kg ± tolerance
- [ ] Supplier holds valid UN 38.3 transport certification and IEC 62619 compliance documentation for the specific cell model being supplied
- [ ] Overcharge test results from EOL samples show no unexplained thermal runaway outliers, or if any outlier occurred, supplier provides root-cause analysis and corrective action documentation
Key Specifications Table #
| Parameter | Recommended Value | Verification Method |
|---|---|---|
| Cell format | Prismatic aluminum shell, 36 × 130 × 235 mm | Physical measurement, dimensional inspection report |
| Nominal capacity | 125 Ah | 1C discharge capacity test per GB/T 36276, 2.5–3.65 V window |
| Thermal runaway peak temperature (T3) at BOL | 382–450°C (test-condition dependent) | External heater TR test per GB/T 36276-2023, temperature sensor at heater-opposite face |
| EOL thermal runaway time to peak | 20–26 minutes from self-heating onset | TR test on cells cycled to ≥8,000 cycles / ≤70% SOH, 1C/1C 100% DOD at 25°C |
| Short-circuit peak current (BOL) | 2900–3300 A | External short circuit, <5 mΩ resistance, 10-minute duration, current waveform logging |
| Overcharge cutoff voltage (safety test) | 1.5× nominal = 5.475 V | 1C constant current overcharge to 1.5× single-cell cutoff voltage |
| EOL definition for safety re-test | ≤70% SOH | Capacity measurement after 8,000+ cycles 100% DOD or 80°C accelerated aging |
| Cell mass | 2.45 kg | Physical weighing at goods receipt |
Can’t find a supplier meeting these specs? Submit your requirements and we’ll match you within 48 hours.
Frequently Asked Questions #
Q1: Does a prismatic LFP cell become safer or more dangerous at end of life?
Neither straightforwardly. The total heat released during thermal runaway remains comparable between BOL and EOL states — the hazard energy does not diminish significantly. What changes is timing: EOL cells take longer to reach peak temperature (20–26 min vs. 10–22 min), and their temperature curves are more consistent across samples. However, EOL cells are more susceptible to thermal runaway under overcharge conditions, making overcharge protection more critical in aged systems, not less.
Q2: What does the IEC 62619 standard require for thermal runaway testing?
IEC 62619:2022 sets safety requirements for lithium-ion cells and batteries used in stationary applications. It requires thermal runaway testing as part of the abuse test battery, alongside short circuit and overcharge. The standard specifies test conditions, pass/fail criteria (no fire, no explosion), and documentation requirements. Importantly, it does not mandate EOL re-testing — which is precisely the gap this type of lifecycle safety research addresses. Buyers should request EOL data as a supplementary qualification item beyond the standard certification scope.
Q3: Why do aged LFP cells show a secondary current peak during short circuit?
As internal temperature rises during the short event, concentration polarization within the aged electrode/electrolyte system decreases. This temporarily reduces internal resistance, allowing current to surge again after the initial drop — producing a characteristic secondary peak in the 1450–1700 A range. This is a mechanical/electrochemical phenomenon, not a defect. But it matters for BMS firmware: protection algorithms calibrated to a monotonic current decay curve may misinterpret this secondary surge.
Q4: How should I interpret overcharge safety results when some EOL cells pass and others don’t?
This is the right question, and most buyers don’t ask it. In the test dataset described here, one of three EOL overcharge samples triggered full thermal runaway (reaching 362.5°C large-face temperature) while the other two peaked at 93.5°C and 59.7°C with no runaway. Identical abuse conditions, same production batch, same aging protocol. The scatter reflects real cell-to-cell variability in aging state. For system design, this means your BMS overcharge protection cannot rely on statistical average behavior at EOL — it must be conservative enough to protect the worst-case cell.
Q5: What cycle life should I expect from 125 Ah LFP prismatic cells before reaching the 70% SOH threshold?
Based on the test data, cells cycled at 1C/1C 100% DOD at room temperature reached approximately 70% SOH at 8,200–8,400 cycles, while cells cycled at 2C/2C reached the same threshold at around 9,100 cycles — a result that reflects the well-known LFP capacity recovery behavior under higher C-rate cycling. Under IEC 62619-relevant industrial conditions, actual cycle life will depend heavily on operating temperature, DOD, and charge voltage ceiling. Get cycle-life test data under your specific application conditions, not just the supplier’s advertised number.
References #
Data source: Lifecycle Safety Characterization of Prismatic Aluminum-Shell LFP Energy Storage Cells Under Thermal Abuse, Short Circuit, and Overcharge Conditions, H. Zhang et al., Journal of the Electrochemical Society, 2024
Published by compactbess.com Technical Team | Request a sourcing quote


