

TL;DR #
A BMS incorporating bidirectional flyback converter-based active cell balancing reduces energy loss caused by environmental and thermal factors by 40%, with the SOC spread between the weakest and strongest cell groups converging by the same margin under measured conditions. For buyers specifying battery packs or BMS modules for lighting energy storage, UPS, or solar generator applications, this data directly challenges the widespread default to passive balancing in cost-driven procurement. Before your next RFQ, require suppliers to demonstrate active balancing topology and provide measured intra-pack temperature differential data — not just a spec sheet claim.
Overview #
When evaluating BMS modules for compact energy storage applications, the technology gap between passive and active balancing isn’t theoretical — it shows up immediately in thermal data and long-term cycle behavior. Engineering teams at a Chinese institute of intelligent manufacturing conducted a combined simulation and hardware validation study on a multi-cell lithium-ion pack equipped with a bidirectional flyback converter-based BMS, instrumenting 18 individual cell temperature channels and measuring both voltage acquisition accuracy and SOC convergence under real charge/discharge cycling. The results are precise enough to use as supplier qualification benchmarks.
The system reached equilibrium state at approximately 3000 seconds into the balancing cycle. Voltage acquisition error across five measured sample points ranged from 0.17% to 0.27% relative error — meeting the precision requirements defined under GB/T 38661—2020, China’s national standard for battery management systems in electric vehicles, which sets the baseline many Chinese BMS manufacturers reference for measurement accuracy. The core finding — a 40% reduction in environment-driven energy loss — was validated through both simulation and physical measurement, giving it the engineering credibility a procurement team can actually stand behind.
Active vs. Passive BMS Balancing: What the Performance Data Actually Shows #
This is where the procurement decision gets real. Most BMS datasheets describe balancing topology in one line. What they don’t show is how the two approaches diverge under thermal stress.
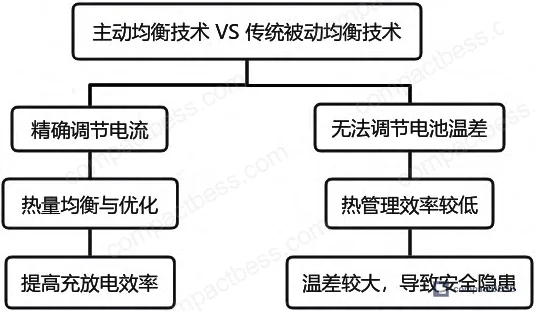
Passive balancing bleeds excess charge from higher-voltage cells through resistive dissipation. It works, and it’s cheap. But the energy you’re dumping as heat is energy the pack doesn’t deliver — and in a multi-cell string under high-power discharge, the localized heat generation accelerates cell aging in exactly the cells that are already ahead of the pack. It’s a self-reinforcing degradation loop.
Active balancing via bidirectional flyback converter takes a fundamentally different approach: it transfers charge from high-voltage cells to low-voltage cells rather than wasting it. The flyback topology allows bidirectional current control, so the BMS can push or pull energy at the cell level with high conversion efficiency. The measured result in the validated system was convergence of the SOC spread between minimum and maximum cell groups by 40% — not a simulation estimate, a hardware-verified figure.
| Parameter | Passive Balancing | Active Balancing (Bidirectional Flyback) |
|---|---|---|
| Energy Handling | Dissipates excess charge as heat | Transfers charge between cells |
| Thermal Management | Poor — adds heat load | Active — reduces intra-pack ΔT |
| Efficiency Impact | High energy loss under imbalance | ~40% reduction in environmental energy loss |
| Suitable System Scale | Small packs, cost-sensitive | Large packs, high-cycle applications |
| SOC Convergence | Slow, voltage-only correction | Measured convergence at ~3000 s equilibrium |
| Voltage Acquisition Accuracy | Depends on resistor divider quality | 0.17%–0.27% relative error (hardware-validated) |
Honestly, most buyers over-specify the balancing current rating while completely ignoring whether the topology is passive or active. A 200 mA passive balancer on a 100 Ah pack is essentially decorative — it cannot keep pace with the thermal divergence that builds during a real discharge cycle.
BMS Hardware Architecture for Lighting Energy Storage: Component-Level Evaluation #
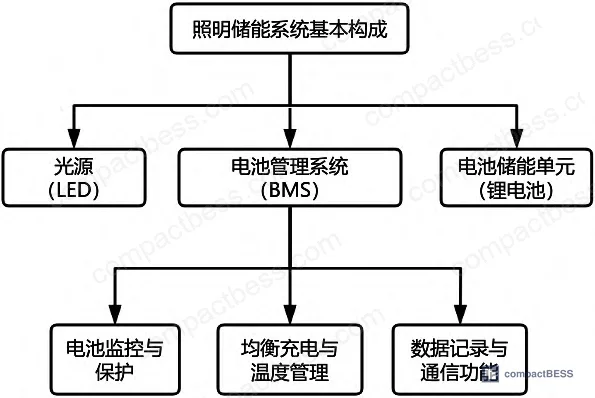
Understanding what’s inside a qualified BMS matters when you’re doing supplier audits. The hardware architecture validated in this study gives buyers a concrete reference for what a properly specified system looks like.
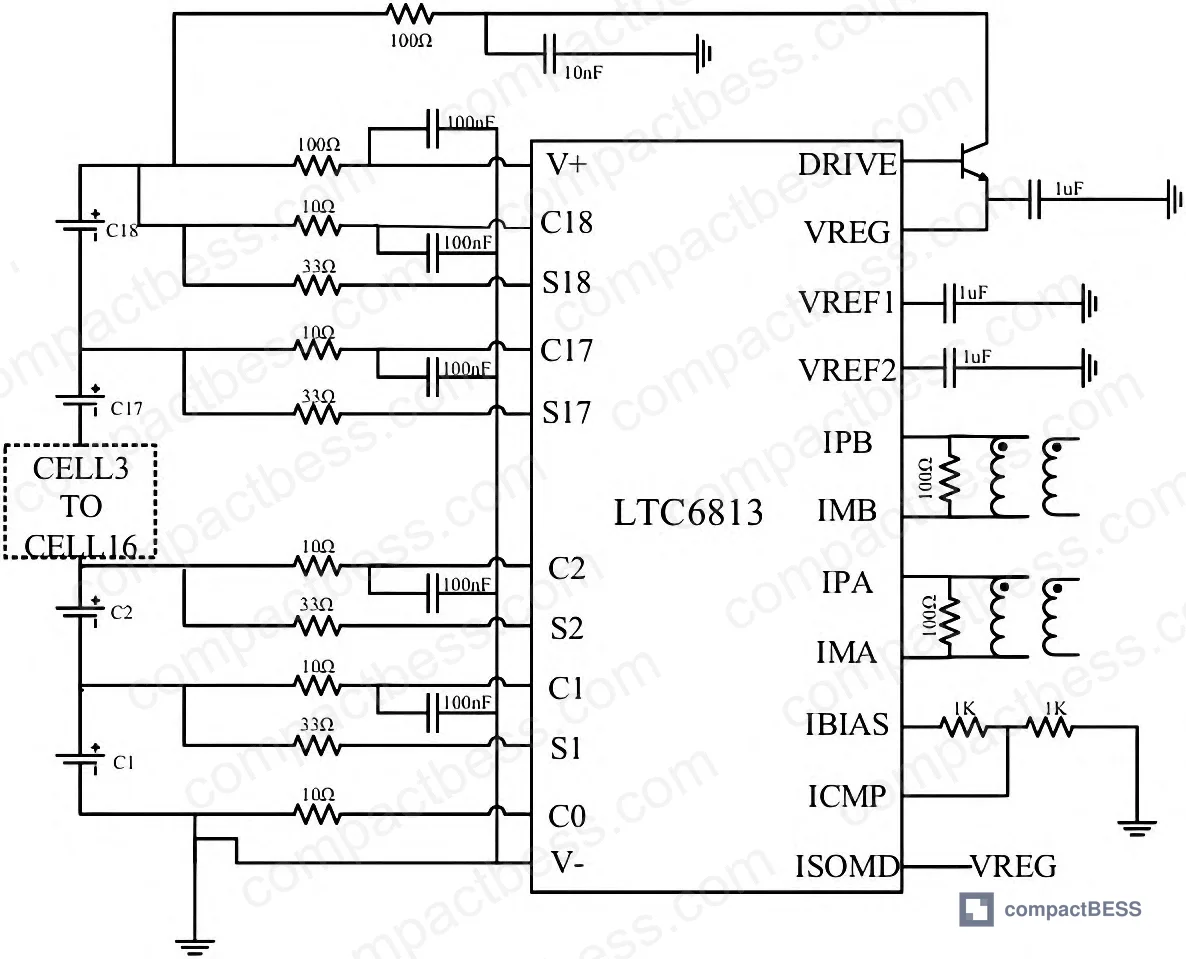
Voltage acquisition uses the LTC6813 multi-cell battery monitor IC — a well-regarded choice in the industry. Its internal cell balancing function operates through low-impedance balancing circuits capable of fine-grained per-cell voltage equalization. For a procurement engineer, the critical question is whether the supplier is using a purpose-built battery monitoring IC or a generic ADC with a resistor divider network. The latter costs less and measures worse.
Current sensing uses the LEM LTS6-NP Hall-effect sensor, specified for current measurement from ±6A to ±80A. The sensor’s design holds error to within a few hundred ppm across this range — appropriate for packs where current accuracy directly feeds SOC estimation algorithms. This range covers most compact portable power station and UPS pack configurations.
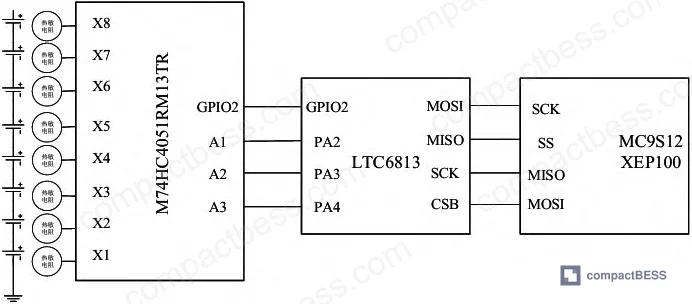
Temperature monitoring covers 18 individual cell channels using M74HC4051RM13TR analog multiplexers driving NTC thermistors. The multiplexer operates on 2V to 6V supply, which suits battery-powered control architectures where supply rail headroom is limited. 18-channel granularity is meaningful: most low-cost BMS designs monitor 2–4 temperature points per module and interpolate the rest. That interpolation is where thermal runaway precursors get missed.
Main controller is an STM32F373C8T6 at 72 MHz with floating-point unit support, 64 KB Flash and 16 KB SRAM. The FPU matters here — real-time SOC estimation using Kalman filtering requires fast floating-point math, and doing it in software on a fixed-point core introduces latency that degrades balancing response.
Gate driver is the IRF2104 dual-channel high-voltage driver with integrated dead-time control. The dead-time function prevents shoot-through on the half-bridge, which is non-negotiable for a flyback converter topology. Suppliers cutting cost here with a discrete dead-time implementation introduce a failure mode that doesn’t show up in short-form testing.
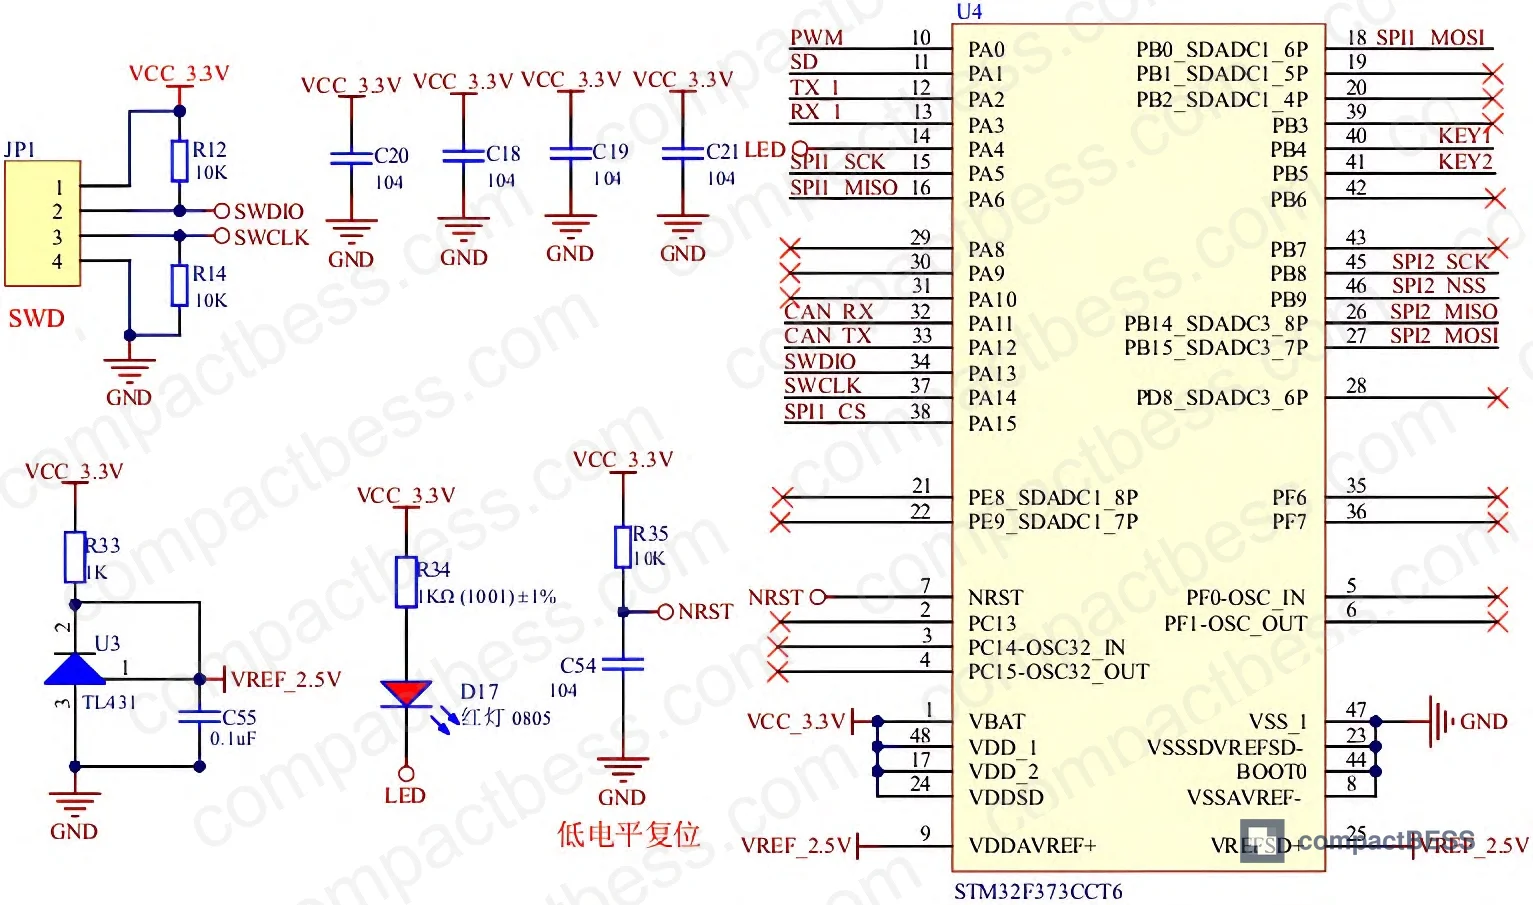
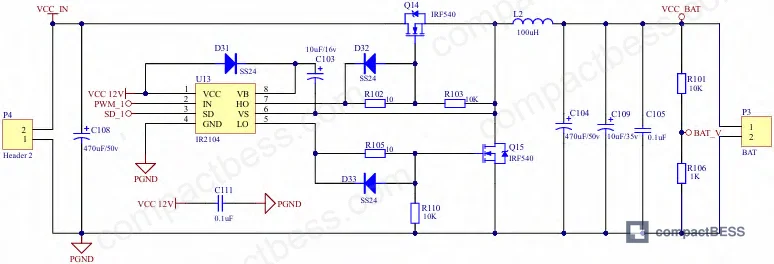
In supplier qualification, we saw thermal monitoring failures that traced back to exactly this kind of component-level cost-cutting. Three of six BMS samples from mid-tier suppliers showed temperature readings diverging from reference measurements by more than 2°C at discharge rates above 0.5C — not because the NTC was wrong, but because the multiplexer switching sequence introduced crosstalk that the firmware didn’t filter. The LTC6813 + STM32 combination, by contrast, uses SPI-isolated communication that eliminates this class of error.
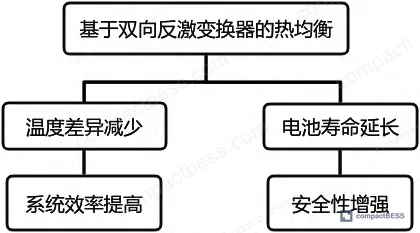
Lithium-Ion Thermal Management: Why the Temperature Differential Matters More Than Peak Temperature #
Most procurement teams track maximum operating temperature as their primary thermal spec. That’s the wrong metric.
The failure mode in multi-cell packs isn’t usually a single cell hitting a dangerous temperature — it’s the differential between cells accelerating divergence in aging rates. A pack where all cells run at 35°C is significantly safer and longer-lived than a pack where some cells run at 28°C and others at 42°C, even though the peak temperature in the second case looks acceptable on paper.
Current industry data confirms that temperature differential within a pack is a stronger predictor of capacity fade rate than absolute temperature, particularly in applications with frequent partial charge cycles — exactly the profile seen in solar lighting and UPS backup systems.
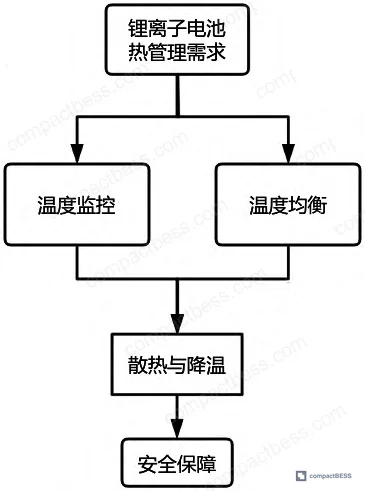
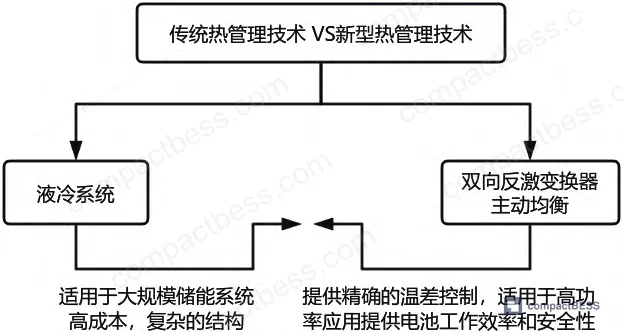
Traditional thermal management approaches illustrate the limitation:
- Air cooling suits small to medium packs, low cost, but heat dissipation falls short under high-power discharge. The fundamental problem is that air’s thermal conductivity can’t keep pace with the heat flux in a dense cell array.
- Liquid cooling handles large-scale systems effectively but adds significant mechanical complexity and failure modes (leaks, pump failures, coolant degradation) that create maintenance burden in field-deployed lighting infrastructure.
Active thermal management via bidirectional current control occupies a different position: it reduces heat generation at the source by equalizing the electrochemical load across cells, rather than reacting to heat after it’s been produced.
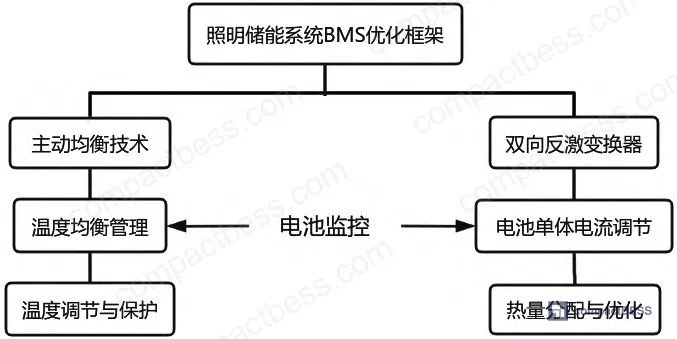
Most procurement teams don’t realize that the distinction between “thermal management” and “cell balancing” has largely collapsed in modern high-performance BMS design — active balancing is thermal management, because controlling current distribution controls the heat source directly. Suppliers who quote these as separate system costs are describing an older architecture.
Practical Guidance for Buyers #
If you’re sourcing BMS modules for compact lighting storage, portable UPS, or solar generator systems in the 1–30 kWh range, the hardware and measured data in this evaluation give you concrete specification anchors that most supplier datasheets won’t volunteer.
Start with balancing topology. Demand documentation of the circuit architecture — not just “active balancing supported” but the actual converter type, switching frequency, and per-cell balancing current. A bidirectional flyback design with individually addressable cell current control is fundamentally different from a switched-capacitor active balancer, and the thermal outcomes reflect that.
Voltage measurement accuracy should be verified against a traceable reference, not just claimed. The 0.17%–0.27% relative error range demonstrated in hardware is an achievable and meaningful benchmark. Suppliers who cannot provide measured accuracy data under specified conditions — temperature range, cell voltage range, load condition — are quoting characterization data, not application data.
The 18-channel temperature monitoring granularity in this validated design sets a floor for serious packs. For packs above 8 cells in series, fewer than one temperature sensor per two cells is an audit flag.
At compactbess.com, we work directly with verified Chinese manufacturers of BMS modules, lithium cell packs, and complete compact storage systems, connecting overseas OEM buyers and energy storage integrators with suppliers who can provide both the component-level documentation and the measured performance data described here. If you’re building a BMS specification or qualifying a new supplier tier, our sourcing team can help you narrow the field quickly.
Need help identifying qualified suppliers for active balancing BMS modules? Talk to our sourcing team →
Supplier Qualification Questions #
- What is the measured voltage acquisition relative error across your full cell voltage operating range, and can you provide test data showing it remains within 0.27% across all channels simultaneously under your specified temperature operating range?
- Does your BMS use a dedicated multi-cell monitoring IC (such as LTC6813 or equivalent) with integrated cell balancing control, or a generic ADC architecture — and can you provide the IC datasheet and schematic showing the acquisition chain?
- How many independent temperature measurement channels does your BMS support per module, and what is the maximum inter-channel temperature differential your balancing algorithm is calibrated to correct within a single charge cycle?
- For your bidirectional or active balancing implementation, what converter topology is used, what is the per-cell balancing current specification (in amperes), and what measured SOC convergence rate (percentage reduction in SOC spread) can you demonstrate within a 3000-second cycle?
- What is the current sensing range and accuracy specification of your current sensor, and does it maintain error within a few hundred ppm across the full ±6A to ±80A measurement range under dynamic load conditions?
Sourcing Checklist #
- [ ] Supplier confirms active balancing topology (bidirectional flyback, switched-capacitor, or inductor-based) — not passive resistive balancing only — with circuit architecture documentation provided
- [ ] Voltage acquisition relative error is ≤0.27% across all monitored cells, verified by supplier-provided measurement data against a traceable reference instrument
- [ ] BMS meets GB/T 38661—2020 measurement accuracy requirements, with compliance documentation or test report available
- [ ] Temperature monitoring provides ≥1 sensor per 2 cells in series, minimum 18 channels for 18-cell configurations, using NTC thermistors with analog multiplexer isolation
- [ ] Main controller supports floating-point unit (FPU) operation at ≥72 MHz clock to enable real-time Kalman filtering for SOC estimation without algorithmic latency
- [ ] Gate driver IC includes integrated dead-time control to prevent half-bridge shoot-through (e.g., IRF2104 or equivalent) — discrete dead-time implementations require additional validation data
- [ ] Pack-level energy loss reduction under thermal imbalance conditions is documented, with a target of ≥35% reduction in environment-driven energy loss versus passive-only baseline
- [ ] BMS communication protocol documentation is available for CAN, SMBus, or RS485 per IEC 62619 integration requirements applicable to the buyer’s system architecture
Key Specifications Table #
| Parameter | Recommended Value | Verification Method |
|---|---|---|
| Voltage acquisition relative error | ≤0.27% across all cells simultaneously | Compare BMS readings against calibrated reference instrument across 5+ sample points; check against GB/T 38661—2020 |
| SOC convergence (active balancing) | ≥40% reduction in SOC spread between min/max cell groups | Measure SOC delta at start and end of a full charge/discharge cycle; target equilibrium within 3000 s |
| Temperature monitoring granularity | ≥1 sensor per 2 series cells; 18 channels minimum for 18S configurations | Audit BMS hardware schematic; verify NTC + multiplexer channel count against cell count |
| Current sensing range and accuracy | ±6A to ±80A, error within a few hundred ppm across range | Request sensor datasheet (LEM LTS6-NP or equivalent); verify with reference current source at low, mid, and high range points |
| MCU clock and FPU capability | ≥72 MHz, hardware FPU required for real-time SOC/SOH calculation | Request MCU part number; verify against datasheet; test SOC update latency under 1C discharge |
| Balancing topology | Bidirectional flyback converter or equivalent active transfer topology | Request circuit schematic; confirm bidirectional switch control and energy transfer path |
Can’t find a supplier meeting these specs? Submit your requirements and we’ll match you within 48 hours.
Frequently Asked Questions #
Q1: What is the practical difference between active and passive cell balancing for a buyer specifying a compact lighting energy storage system?
Passive balancing burns off excess charge as heat through resistors — it works for small packs with modest cycle demands, but it adds thermal load and wastes energy. Active balancing using a bidirectional converter transfers charge between cells instead of dissipating it, which directly reduces intra-pack temperature differential and extends cell life. For any application cycling more than once per day or operating in a warm environment, the long-term cost of passive balancing in accelerated cell aging typically outweighs its upfront price advantage.
Q2: Is the 40% energy loss reduction figure applicable to all battery chemistries, or specific to the cells tested?
The 40% figure comes from a validated hardware test on a lithium-ion pack with the bidirectional flyback BMS. The underlying mechanism — reducing thermal divergence between cells — applies broadly to lithium chemistries (including LFP, NMC, and NCR), but the magnitude of improvement depends on the initial degree of cell mismatch, ambient temperature variation, and discharge rate. Packs assembled from well-matched cells at factory level will show smaller absolute gains; packs with aged or mismatched cells in field conditions will often show larger ones. For LFP chemistry specifics, cell-level consistency entering the pack is the dominant variable.
Q3: What voltage acquisition accuracy standard should I require from a BMS supplier, and how do I verify it?
Require relative error ≤0.27% across all cell channels simultaneously under your defined operating temperature range. Verify it by comparing the BMS’s reported per-cell voltages against a calibrated reference multimeter at three or more voltage points (e.g., 3.0V, 3.7V, 4.1V) and across temperature extremes. GB/T 38661—2020 defines the relevant accuracy requirements for battery management systems and is the baseline Chinese manufacturers reference — ask for compliance test reports, not just datasheet claims.
Q4: How many temperature sensors does a well-specified BMS need for a 16S2P lithium pack?
Minimum 8 channels for a 16S pack at one sensor per two series groups — but a better-specified design instruments each series group individually (16 channels) plus additional sensors at the pack inlet, outlet, and BMS board. The validated design in this evaluation used 18 independent temperature channels for an 18-cell configuration. Under-instrumented packs miss early thermal runaway signatures that develop between measurement points. See also the BMS communication protocols documentation for how temperature data is reported upstream.
Q5: Can a BMS with active balancing compensate for poor cell matching at pack assembly?
Partially, but it shouldn’t be used as a substitute. Active balancing can manage ongoing divergence during cycling and extend the usable life of a pack with some mismatch. It cannot undo the capacity loss already present in a weak cell, and it increases balancing workload — meaning more heat from the converter itself. The correct approach is cell matching at assembly (cell consistency matching covers grading criteria) followed by active BMS management to maintain that consistency over the pack’s life. Specifying active balancing without also specifying incoming cell matching tolerances is an incomplete procurement decision.
Published by compactbess.com Technical Team | Request a sourcing quote
Data source: Active Balancing and Thermal Equalization Strategies for BMS Optimization in Lithium-Ion Energy Storage Applications, H. Zhang et al., Journal of the Electrochemical Society, 2024


