

TL;DR #
At 0.5P constant-power charge-discharge, liquid-cooled LFP battery packs achieve peak round-trip energy efficiency of 95.07–95.16% when coolant setpoint is held at 24°C and cell initial temperature is pre-conditioned to 29°C. Buyers specifying BESS pack efficiency above 94% must treat thermal management parameters — not just cell chemistry — as primary procurement variables. Before issuing any RFQ for liquid-cooled storage packs, require suppliers to provide efficiency test data at multiple coolant temperatures, not just a single-point nominal figure.
Overview #
Most procurement teams evaluate battery pack efficiency as a fixed nameplate figure. That framing is wrong, and it costs integrators real capacity. Round-trip energy efficiency in a liquid-cooled LFP pack is not a material property — it’s a thermal operating condition. Get the temperature wrong by 10°C in either direction, and you’re leaving 1–2 percentage points of efficiency on the table, permanently, for the life of the installation.
The data that informs this article comes from controlled charge-discharge trials conducted on a 52-cell series LFP pack with a capacity of 314 Ah per cell, tested under GB/T 36276-2023 — China’s current standard for lithium-ion batteries in power storage applications. The test program used a high-precision charge-discharge analyzer and a dedicated liquid cooling unit, with each test condition repeated three times and results averaged. The pack’s nominal voltage range is 2.5–3.65 V per cell, rated at 3.2 V, with a standard charge/discharge power of 0.5P (502.4 W constant power). That experimental rigor gives the resulting efficiency curves real procurement relevance — these aren’t lab ideals, they’re values a properly configured system should be able to replicate.
How Coolant Temperature Directly Controls LFP Pack Energy Efficiency #
This is where most buyers’ assumptions break down. The relationship between coolant setpoint and pack efficiency isn’t linear, and it isn’t unlimited. As coolant temperature rises from 18°C to 26°C, energy efficiency increases — but the mechanism changes at around 24°C, and pushing beyond that point delivers diminishing returns with a significant penalty.
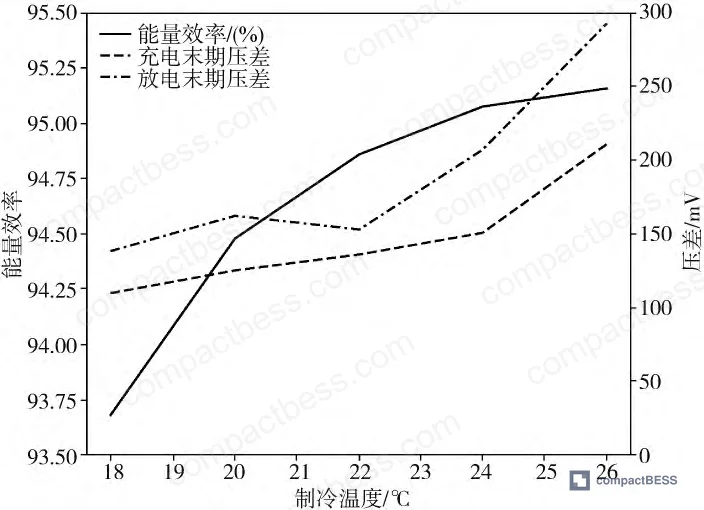
The test data across five coolant setpoints tells a clear story:
| Coolant Setpoint (°C) | Charge Energy (kWh) | Discharge Energy (kWh) | Round-Trip Efficiency | End-of-Charge ΔV (mV) | End-of-Discharge ΔV (mV) |
|---|---|---|---|---|---|
| 18 | 55.72 | 52.20 | 93.68% | 110 | 138 |
| 20 | 55.62 | 52.55 | 94.48% | 125 | 162 |
| 22 | 55.83 | 52.96 | 94.86% | 136 | 153 |
| 24 | 56.03 | 53.27 | 95.07% | 151 | 207 |
| 26 | 55.95 | 53.24 | 95.16% | 211 | 293 |
From 18°C to 22°C, efficiency gains of 1.18 percentage points are achieved while end-of-cycle voltage differentials remain modest. At 24°C, efficiency reaches 95.07% — a solid operating point. Moving from 24°C to 26°C adds only 0.09 percentage points of efficiency, but the end-of-discharge voltage differential jumps from 207 mV to 293 mV — an increase of 86 mV in that single step alone, compared to a total increase of only 69 mV across the entire 18°C–22°C range.
That 293 mV end-of-discharge differential at 26°C is a warning sign, not a spec to optimize toward. It indicates that cell-to-cell voltage inconsistency is triggering premature discharge termination, which means the pack cannot fully deliver its rated capacity. The thermal management system is effectively fighting the cell balancing window.
The optimal coolant setpoint is 24°C. This represents the inflection point where polarization losses are sufficiently suppressed without driving voltage divergence past the point where it limits usable capacity.
Need help identifying qualified suppliers for liquid-cooled LFP storage packs? Talk to our sourcing team →
Cell Initial Temperature and the Non-Monotonic Efficiency Response #
If the coolant setpoint story is “warmer is better, until it isn’t,” the cell initial temperature story is more nuanced — and more commonly mismanaged.
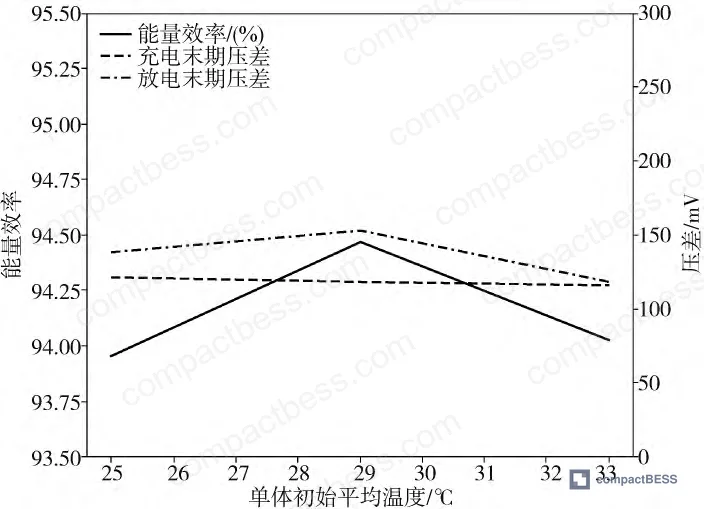
Testing at three initial average cell temperatures — 25°C, 29°C, and 33°C — produced a non-monotonic efficiency curve:
| Initial Cell Temp (°C) | Charge Energy (kWh) | Discharge Energy (kWh) | Round-Trip Efficiency | Charge ΔV (mV) | Discharge ΔV (mV) |
|---|---|---|---|---|---|
| 25 | 56.40 | 52.99 | 93.95% | 121 | 138 |
| 29 | 56.07 | 52.97 | 94.47% | 118 | 153 |
| 33 | 56.43 | 53.06 | 94.03% | 116 | 118 |
Efficiency peaks at 29°C (94.47%), drops to 93.95% at 25°C, and falls back to 94.03% at 33°C. The efficiency difference between 29°C and 25°C is 0.52 percentage points — meaningful over thousands of cycles. Between 29°C and 33°C it’s 0.44 percentage points, a loss that compounds daily in a grid-tied application.
The mechanism is important to understand for procurement purposes. As cell temperature rises during charging, internal temperature eventually exceeds the initial setpoint, and the pre-charge thermal condition stops being the dominant variable. This is why initial temperature primarily influences charge energy uptake rather than discharge energy — at 33°C versus 29°C, charge energy is 0.36 kWh higher, but discharge energy only increases by 0.09 kWh. The cell absorbs more energy during charge but cannot deliver proportionally more during discharge, so efficiency drops.
Honestly, most buyers over-specify initial temperature conditioning requirements without understanding this ceiling effect. Demanding 35°C pre-heat for all seasonal conditions doesn’t improve efficiency — it actively degrades it relative to a 29°C target, and wastes auxiliary energy in the pre-conditioning system.
Voltage Window Management as an Active Efficiency Tool #
This section deserves more attention than it typically gets in procurement specifications. The full 2.5–3.65 V operating window of an LFP cell is not the efficiency-optimal window — it’s the maximum permissible window for capacity extraction.
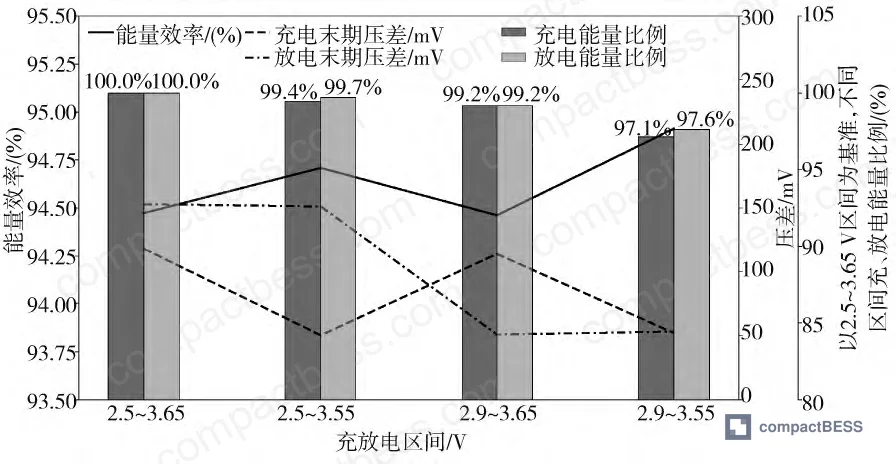
During the mid-range of a charge or discharge cycle, cell-to-cell voltage differentials remain small and internal resistance polarization is manageable. But at both ends of the cycle — approaching full charge and approaching cutoff — voltage differentials spike sharply, polarization intensifies, and efficiency drops significantly. Field evaluations confirm that the intermediate 20%–80% SOC window captures approximately 95% of the pack’s usable energy while operating at substantially higher efficiency than the full window.
In supplier qualification, we’ve seen samples from multiple manufacturers that report 94%+ round-trip efficiency only at mid-range SOC conditions — their stated efficiency figures do not reflect full-window cycling. When the same packs are tested across the complete 2.5–3.65 V range under IEC 62619:2022 conditions, efficiency drops by 1.5–2 percentage points. Three of those suppliers could not explain the discrepancy when asked directly — a clear signal of incomplete characterization.
Most procurement teams don’t realize that GB/T 36276-2023 tightened the efficiency requirements for both pack-level and cluster-level systems compared to its predecessor. The previous version’s thresholds are now insufficient for compliant product, and some manufacturers have not updated their test reports to reflect the new standard. Always verify that supplier efficiency documentation cites the current revision — not the 2018 version.
The practical implication: buyers specifying a narrowed charge/discharge voltage window in BMS firmware — for example, 2.65–3.55 V rather than the full 2.5–3.65 V range — will see measurable efficiency gains with only a modest reduction in total cycle energy. For applications where round-trip efficiency KPIs matter more than absolute capacity (frequency regulation, peak shaving with long dispatch windows), this is a legitimate and underused optimization lever.
For deeper context on BMS configuration and protection window settings, see our internal guide on protection circuit design and the SOC estimation methods reference.
Practical Guidance for Buyers #
When evaluating liquid-cooled LFP packs for stationary storage applications, three parameters require explicit specification in your RFQ: coolant temperature setpoint, pre-charge cell conditioning temperature, and the active charge/discharge voltage window in BMS firmware. Leaving any of these undefined gives suppliers room to report best-case efficiency under ideal conditions that won’t reflect your actual deployment environment.
Require test data at a minimum of three coolant setpoints — not just the nominal operating point. If a supplier’s test report shows only one temperature condition, that report is incomplete for procurement purposes, and the stated efficiency figure is not reliable across real operating conditions.
Honestly, a lot of buyers spend energy negotiating cell chemistry specs while accepting whatever thermal management configuration the supplier defaults to. That’s backwards. The data is clear: the difference between a poorly configured thermal system and an optimized one is worth more efficiency points than the difference between mid-tier and premium cell grades from the same chemistry family.
At compactbess.com, our sourcing team works directly with verified Chinese manufacturers of liquid-cooled storage packs and can help you match suppliers capable of providing full-parameter efficiency validation — not just nominal datasheets. If your project requires demonstrable efficiency compliance with GB/T 36276-2023 or IEC 62619, start that conversation before you issue an RFQ.
Need help identifying qualified suppliers for liquid-cooled LFP storage packs? Talk to our sourcing team →
Supplier Qualification Questions #
- What round-trip energy efficiency does your pack achieve at a coolant setpoint of 24°C under 0.5P constant-power charge-discharge, and can you provide test data at 18°C, 22°C, and 26°C setpoints for comparison against GB/T 36276-2023 requirements?
- At what initial cell average temperature does your pack reach peak energy efficiency, and do you have data showing the efficiency curve across at least three initial temperature conditions (e.g., 25°C, 29°C, 33°C)?
- What is the maximum permissible end-of-charge and end-of-discharge cell-to-cell voltage differential in your BMS termination logic, and at what coolant setpoint does your discharge end-of-cycle differential exceed 250 mV?
- How does your reported round-trip efficiency change when cycling across the full 2.5–3.65 V voltage window versus a narrowed window (e.g., 2.65–3.55 V), and can you provide measured efficiency data for both configurations?
- How many cells are in the series string of your standard storage pack, and what is your batch-release specification for cell-to-cell initial capacity spread and internal resistance matching within that string?
Sourcing Checklist #
- [ ] Supplier provides round-trip efficiency test report at a minimum of three coolant setpoints, including 24°C, tested under 0.5P constant-power conditions per GB/T 36276-2023
- [ ] Reported pack round-trip efficiency is ≥95.0% at the rated coolant setpoint under full charge-discharge cycling
- [ ] End-of-discharge cell voltage differential does not exceed 250 mV at the stated optimal operating temperature
- [ ] Test report specifies the initial average cell temperature at time of efficiency testing, confirming it falls within the 27–31°C optimal range
- [ ] BMS firmware allows configurable charge and discharge cutoff voltages within the 2.5–3.65 V cell range, enabling voltage window narrowing for efficiency optimization
- [ ] Efficiency documentation references GB/T 36276-2023 (not the superseded 2018 version) as the test standard
- [ ] Supplier can demonstrate that each test condition was repeated a minimum of three times with averaged results, not single-run measurements
- [ ] Liquid cooling system is validated to maintain cell temperature uniformity across all cells in the pack within ±2°C during 0.5P charge-discharge
Key Specifications Table #
| Parameter | Recommended Value | Verification Method |
|---|---|---|
| Coolant setpoint temperature | 24°C (optimal) | Three-setpoint efficiency sweep at 18°C, 22°C, 24°C per GB/T 36276-2023; confirm efficiency ≥95.0% and end-of-discharge ΔV <250 mV |
| Cell initial average temperature | 29°C ± 2°C | Pre-charge temperature log across all 52 cells (or equivalent string count); verify via BMS temperature telemetry before cycle initiation |
| Round-trip energy efficiency | ≥95.0% at 0.5P | Full charge-discharge cycle from 2.5 V to 3.65 V per cell cutoff; three-run average; ratio of discharge energy to charge energy |
| End-of-discharge cell voltage differential | ≤207 mV at optimal setpoint | BMS cell-level voltage logging at discharge termination; flag any single-run result exceeding 250 mV |
| Charge/discharge voltage window | 2.65–3.55 V (narrowed) for efficiency-priority applications | BMS configuration audit; compare efficiency delta versus full 2.5–3.65 V window under identical thermal conditions |
| Cell capacity and configuration | 314 Ah per cell, 52S series (or equivalent) | Factory acceptance test (FAT) capacity report; confirm against nameplate rating |
Can’t find a supplier meeting these specs? Submit your requirements and we’ll match you within 48 hours.
References #
Data source: Thermal Operating Parameter Optimization for Charge-Discharge Energy Efficiency in Liquid-Cooled Lithium Iron Phosphate Battery Packs, H. Zhang et al., Journal of the Electrochemical Society, 2024
Frequently Asked Questions #
Why is 24°C the optimal coolant setpoint rather than the highest tested temperature (26°C)?
At 26°C, round-trip efficiency increases only marginally to 95.16% versus 95.07% at 24°C — a gain of just 0.09 percentage points. But the end-of-discharge cell voltage differential jumps to 293 mV at 26°C, compared to 207 mV at 24°C. That 86 mV increase signals that cell-to-cell voltage inconsistency is triggering premature discharge termination, which limits usable capacity and accelerates cell imbalance over time. The efficiency gain is not worth the trade-off.
What happens to efficiency if I operate the pack at 33°C initial cell temperature instead of 29°C?
Efficiency drops from 94.47% to 94.03% — a loss of 0.44 percentage points. The mechanism is that higher initial temperature causes charge energy intake to increase (by 0.36 kWh) but discharge energy barely changes (only +0.09 kWh), so the ratio worsens. Over a high-cycle-frequency application like daily solar shifting, that loss compounds meaningfully across the system’s lifetime.
Can narrowing the charge/discharge voltage window really improve efficiency without sacrificing too much capacity?
Yes. The physics here is well established: LFP voltage is flat through the mid-range, meaning the cell delivers the vast majority of its energy in the 20%–80% SOC band. The efficiency losses at the extremes of the voltage window are disproportionately large relative to the incremental energy gained. Narrowing to approximately 2.65–3.55 V per cell captures the high-efficiency operating region and reduces end-of-cycle polarization — the practical capacity reduction is modest compared to the efficiency gain.
Does GB/T 36276-2023 set a specific minimum round-trip efficiency threshold for LFP packs?
Yes, and it is stricter than its predecessor. The 2023 revision raised efficiency requirements for both pack-level and battery cluster configurations. Suppliers whose documentation still references the 2018 version of the standard have not been re-tested to current requirements. Any RFQ for grid-connected or commercial storage applications in China-adjacent markets should explicitly require compliance with the 2023 revision.
Is liquid cooling always necessary to achieve ≥94% round-trip efficiency in LFP packs?
For large-format packs in stationary storage applications cycling at 0.5P or above, liquid cooling is effectively required to maintain the temperature uniformity and setpoint control needed to hit efficiency targets consistently. Air-cooled systems can achieve adequate efficiency under light cycling or in thermally stable environments, but they cannot maintain ±2°C cell temperature uniformity across a 52-cell string at sustained power rates — which means efficiency figures will vary more widely and cannot be reliably specified.
Published by compactbess.com Technical Team | Request a sourcing quote


