

TL;DR #
In a constrained-condition lifecycle test of 280 Ah LFP modules, swelling force at the 30% SOC charge peak overtakes the 100% SOC peak as the dominant structural load once SOH drops below ~94%, and a 1P12S module reaches 2365 kgf at 70% SOH — a level that end-plate and busbar designs must be explicitly rated to survive. If your pack structure was designed around BOL (begin-of-life) swelling assumptions, you have already accepted a latent failure mode that grows every cycle. Audit your end-plate yield strength and busbar displacement tolerance against the 60% SOH linear-regression load projection before finalizing any module mechanical design.
Overview: Why Swelling Force Is the Structural Variable Most Pack Designs Underestimate #
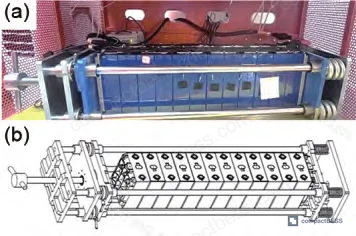
Most procurement teams treat swelling force as a cell-level curiosity — something the cell datasheet mentions and the module designer quietly ignores. That is an expensive mistake. Research conducted at a major Chinese battery manufacturer and validated through collaborative simulation work with a leading national university provides some of the clearest lifecycle-resolved swelling data available for large-format LFP cells. The study assembled 280 Ah prismatic LFP cells into 1P8S and 1P12S module configurations, constrained them in steel-fixture tooling with calibrated pressure sensors, and ran 0.5P constant-power charge/discharge cycling at 25 ±2 °C through full SOH degradation — capturing swelling force continuously across the entire SOC range and lifecycle.
The results reframe the structural design problem entirely. Swelling force is not a fixed parameter you size against. It is a moving target that shifts peak location, increases in magnitude, and changes its linear relationship with SOH at a predictable inflection point. Understanding those dynamics is the difference between a module enclosure that survives 3000 cycles and one that develops busbar fatigue cracks or end-plate deformation well before warranty expires.
LFP Swelling Force Behavior Across SOC: Two Peaks, Not One #
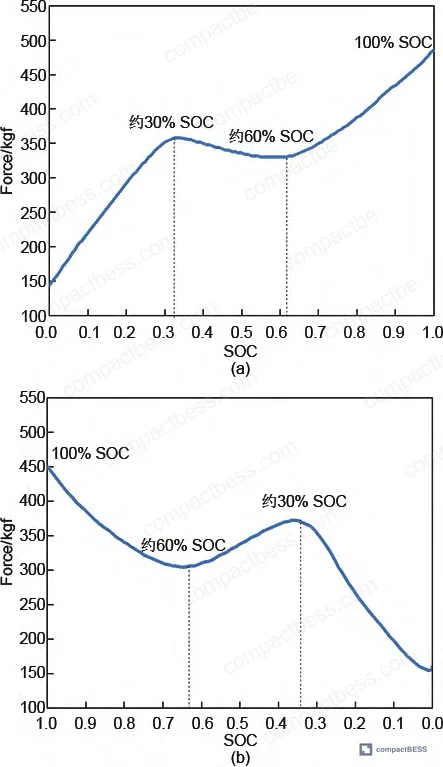
The single-cycle swelling profile of a 280 Ah LFP module is non-linear and asymmetric in ways that matter for structural design. During the first charge cycle, force rises approximately linearly from 0% SOC, reaches a first peak of 357 kgf at ~30% SOC, then retreats to ~330 kgf around 60% SOC before climbing again to a maximum of 485 kgf at 100% SOC. After a 30-minute rest at full charge, the force settles to 458 kgf — the silicone pad buffer absorbs roughly 27 kgf. During discharge, the pattern mirrors the charge curve: force drops from ~450 kgf to 304 kgf at 60% SOC, rises again to a peak of 372 kgf at ~30% SOC, then falls to a minimum of 156 kgf at 0% SOC.
The net irreversible increase after one full cycle is only about 6 kgf — small enough to seem negligible. It is not. That increment compounds over hundreds of cycles into the structural failure zone.
Why Two Peaks Exist: Graphite Staging and LFP Lattice Coupling #
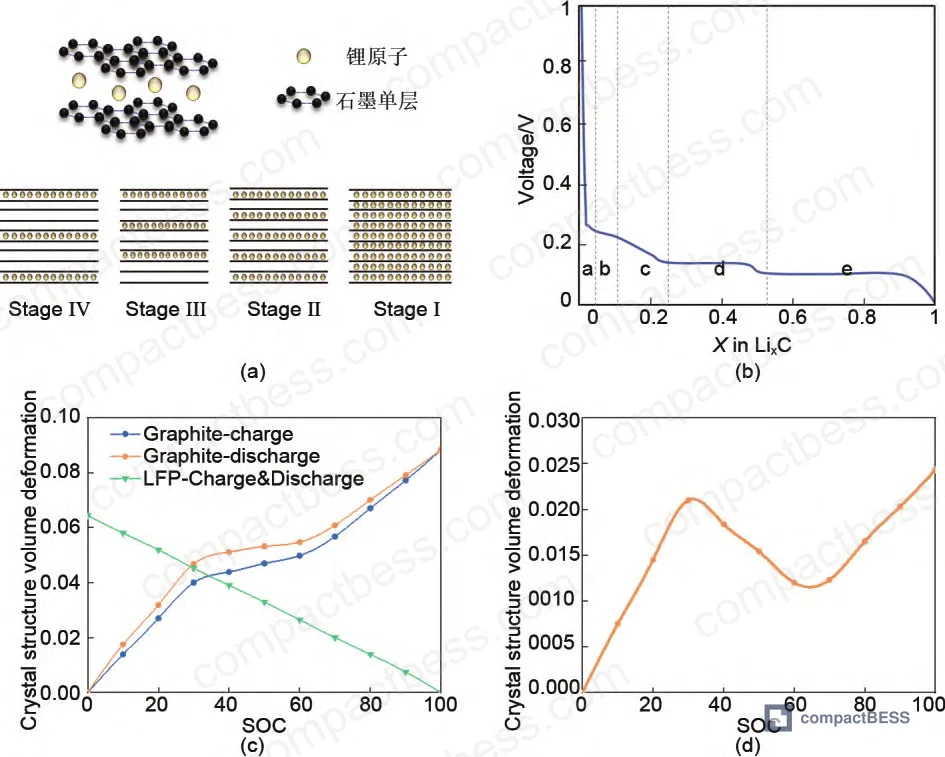
The dual-peak profile is a direct consequence of electrode material physics, not a measurement artifact. During lithiation, graphite passes through four distinct staging phases (Stage IV → III → IIL → II → I). The volume expansion is not monotonic: graphite expands ~5.33% at the Stage IV/III transition (occurring around 30% SOC), plateaus through the IIL intermediate region, then surges to a maximum volume expansion of ~12.4% at full lithiation (Stage I, LiC₆).
Simultaneously, the LFP cathode contracts as lithium is extracted during charge. Between 30% and 70% SOC, cathode contraction partially offsets graphite expansion — which is why the module force dips in that window. The coupled deformation of both electrodes produces a wave-shaped structural load profile with a first peak near 30% SOC and a larger peak at 100% SOC. This has been confirmed through crystal lattice parameter measurements: graphite interlayer spacing increases from 3.355 Å (unlithiated) to 3.706 Å at full lithiation, while LFP contracts from c = 4.79 Å to 4.69 Å during delithiation.
| Parameter | Graphite (C₆ → LiC₆) | LFP (LiFePO₄ → FePO₄) | Net Module Effect |
|---|---|---|---|
| Volume change at ~30% SOC | +5.33% (Stage IV/III transition) | Contracting | First swelling peak |
| Volume change at 30–70% SOC | Slow, steady increase | Significant contraction | Force dip in module |
| Volume change at 100% SOC | +12.4% (Stage I) | Near-complete delithiation | Maximum swelling peak (BOL) |
| Dominant peak late-life (>800 cycles) | 30% SOC peak exceeds 100% peak | Reduced active lithium | Structural load redistribution |
Swelling Force Evolution Across the Full Battery Lifecycle #
This is where the data becomes operationally critical — and where most module structural designs fall short.
The Peak Inversion: BOL vs. EOL Dominant Load #
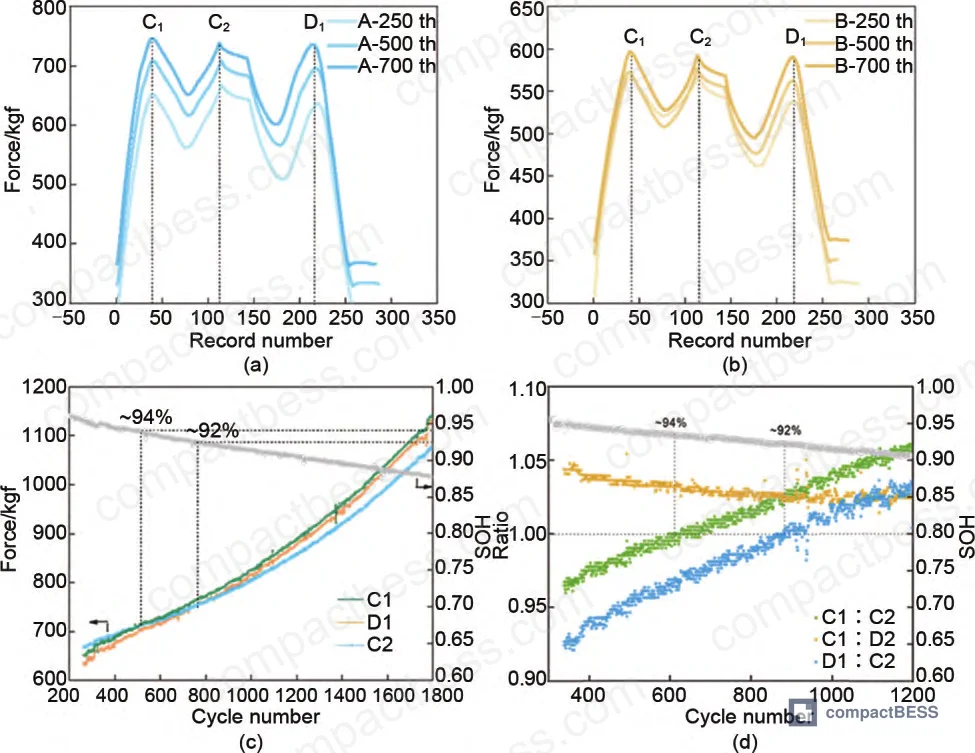
At beginning of life, the 100% SOC peak (C2) is the largest load. In qualification testing on the 1P12S module, the peak order was C2 > C1 > D1 through approximately the first 500 cycles. That is the design condition most structural engineers use. It is wrong for anything beyond the first year of operation.
Around ~500 cycles / ~94% SOH, the 30% SOC charge peak (C1) overtakes C2 as the dominant load. By ~800 cycles / ~92% SOH, the relationship locks into C1 > D1 > C2 and remains stable for the rest of the module’s life. The mechanism: as active lithium inventory depletes, the 100% SOC condition no longer drives full graphite lithiation to Stage I — the remaining active lithium at EOL corresponds roughly to ~90% SOC at BOL in terms of graphite expansion. Meanwhile the Stage IV→III transition at ~30% SOC, which has a steeper volume-change slope than the Stage II→I transition, produces a disproportionately large expansion force relative to available active lithium.
In supplier qualification, we saw similar behavior confirmed across both module configurations — neither the 1P8S nor 1P12S escaped this inversion. The C1/C2 ratio exceeded 1.0 at ~94% SOH in the B module as well, and D1/C2 crossed 1.0 at ~92% SOH. The physics is deterministic. Any module design that ignores the post-90% SOH load shift has an unresolved structural liability.
Linear Regression: Force vs. SOH After the Inflection Point #
After SOH drops below ~90%, module maximum swelling force enters a well-behaved linear regime. Least-squares regression fits from the experimental data:
- 1P12S (A module): F = −7429 × SOH + 7532.9, R² = 0.997
- 1P8S (B module): F = −7402 × SOH + 7305.8, R² = 0.996
The slopes are nearly identical (−7429 vs. −7402, differing by only 0.3%), which tells you something important: adding more cells in series does not change the rate at which force increases per unit of SOH degradation. The 1P12S module generates higher absolute force because cell swelling forces accumulate additively across the stack — but the degradation slope per SOH unit is essentially cell-count-independent. Linearly extrapolating to 60% SOH, the projected maximum forces are 3075.5 kgf (1P12S) and 2864.4 kgf (1P8S), after subtracting the 300 kgf initial preload.
FEA Simulation Results: What Passes and What Barely Makes It #
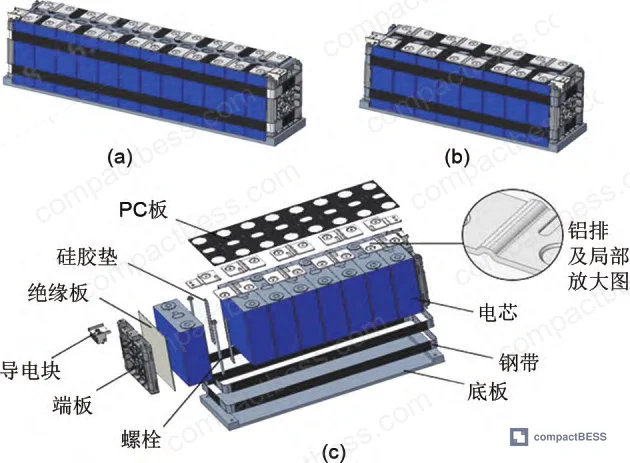
Using CREO geometry models imported into Abaqus (mesh counts of 635,000 elements for the 1P8S configuration and 840,000 elements for 1P12S), the team ran stress analysis at the 60% SOH projected load condition. Boundary conditions: four M8 bolts through end-plate holes at 9.8 N·m torque, bottom crossbeam fixed. The simulation results reveal one structural area that passes with margin, and one that does not.
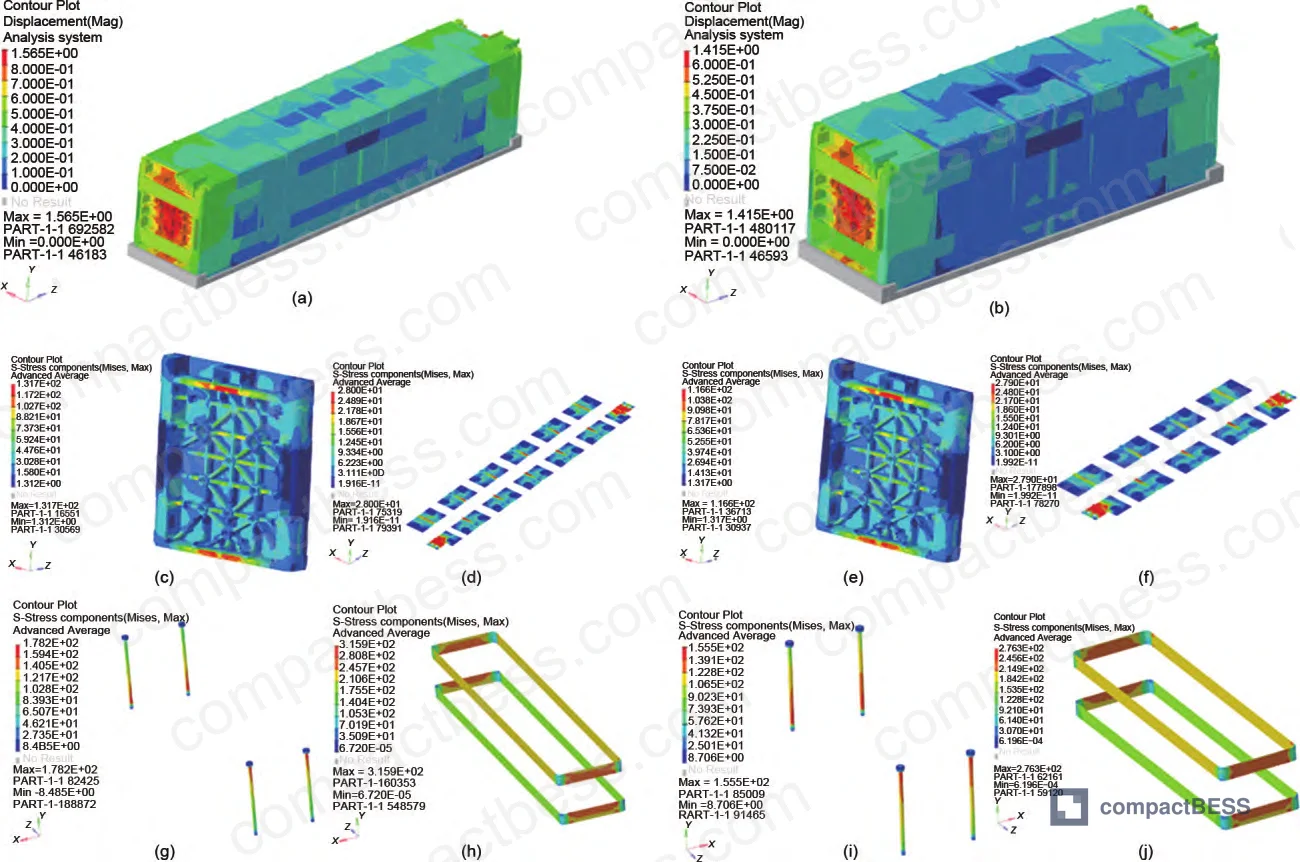
End plates (A380 aluminum alloy, yield strength 159.0 MPa): Maximum stress in both configurations occurs at the reinforcing rib positions — 116.6 MPa at the bottom rib and 131.7 MPa at the upper rib for the 1P12S configuration. Both values remain below the 159.0 MPa yield limit. Stress distribution across the remainder of the end plate is relatively uniform. End plates pass.
Aluminum busbars (AL1060O, yield strength 27.6 MPa): Maximum stress concentrates at the terminal ends of the busbar, where relative displacement between cells creates tensile pull. The calculated maximum stress for both A′ and B′ configurations is 27.9 MPa and 28.0 MPa respectively — marginally above the 27.6 MPa yield strength. This is not a failure, but it is a warning. The resulting displacements are 0.3 mm (1P12S) and 0.5 mm (1P8S), both within the specified 3 mm maximum. The design response is an arched busbar geometry (arch height > 3 mm), which accommodates the displacement without fracture or electrical disconnection. That is good engineering — but it only works if the arch geometry is actually manufactured to spec.
Steel straps and M8 bolts (SUS201 steel, yield 1168 MPa; 40Cr steel, yield 525 MPa): Maximum stresses in both fastener types at 60% SOH remain well below their respective yield strengths. These components carry wide safety margins throughout the projected lifecycle.
Honestly, most procurement teams reviewing a module mechanical design never ask for the busbar stress analysis. They check the end plate and assume the busbars are fine. The data above shows that the busbar is exactly the component that operates closest to its material limit under realistic lifetime swelling loads — and it depends on a specific geometric feature (the arch) to stay within displacement tolerance.
Practical Guidance for Buyers #
If you are sourcing 280 Ah class LFP modules for stationary energy storage applications, the swelling force lifecycle data above should change several items on your acceptance criteria list. First, ask for the module structural design to be validated not just at BOL but at projected 70% SOH load — the 30% SOC swelling peak, not the full-SOC peak, governs late-life structural integrity. Second, verify the busbar design explicitly: flat busbars in a constrained module are a liability; arched busbars with a specified minimum arch height (>3 mm in the configurations studied) are the appropriate design response to lifetime displacement.
For module-level compliance, swelling force tolerance should be referenced against IEC 62619 (safety for stationary lithium secondary cells and batteries) and UN 38.3 transport testing requirements, which indirectly stress module enclosure integrity. Structural mechanical qualification should also be consistent with ISO 12405-4 test methodology for pack mechanical load evaluation.
At CompactBESS, we work directly with verified Chinese manufacturers of LFP module assemblies and help overseas OEM buyers and energy storage integrators evaluate structural design documentation — including swelling simulation reports — before committing to an order. Need help identifying qualified suppliers for 280 Ah LFP modules with documented swelling force compliance? Talk to our sourcing team →
For deeper context on how cell-level degradation connects to module structural loads, see our guides on SOH and remaining useful life prediction and series-parallel configuration design.
Supplier Qualification Questions #
- What is the measured maximum swelling force of your 280 Ah (or equivalent capacity) LFP module at 70% SOH under 0.5P constant-power cycling, and does it remain below 2400 kgf for a 1P12S configuration?
- At what SOH inflection point does the 30% SOC charge-state swelling peak (C1) exceed the 100% SOC peak (C2) in your module’s lifecycle data, and is this transition documented in your structural design validation report?
- What is the end-plate material specification and yield strength, and can you provide FEA stress maps confirming that end-plate stress remains below yield at the 60% SOH projected load condition?
- What is the arch height of your busbar design, and has displacement under maximum projected swelling load been verified to remain within 3 mm to prevent electrical disconnection failure?
- Can you provide the linear regression fit of maximum swelling force vs. SOH for your module (R² value and slope), and does the slope remain within ±5% of the −7400 kgf/SOH-unit range documented for this cell format?
Sourcing Checklist #
- [ ] Supplier provides swelling force lifecycle test data showing measurements at both 30% SOC and 100% SOC across a minimum of 800 cycles or to ≤90% SOH
- [ ] Module end-plate material yield strength is documented ≥159 MPa (e.g., A380 aluminum alloy or equivalent), with FEA confirmation that operational stress stays below yield at 60% SOH projected load
- [ ] Busbar design uses arched geometry with minimum arch height >3 mm, verified to accommodate ≥0.5 mm terminal displacement under lifetime swelling
- [ ] Swelling force vs. SOH linear regression provided for the specific module configuration, with R² ≥ 0.99 confirming predictability of structural loads through end-of-life
- [ ] Module mechanical design validated against IEC 62619 safety requirements and structural integrity confirmed under ISO 12405-4 mechanical load test methodology
- [ ] Initial preload specification documented (reference value: 300 kgf for 280 Ah class modules) with torque spec for M8 end-plate fasteners (reference: 9.8 N·m)
- [ ] Supplier can confirm that steel strap and bolt stress at 60% SOH projected load remains below material yield strength (SUS201 strap: 1168 MPa; 40Cr bolt: 525 MPa or equivalent)
Key Specifications Table #
| Parameter | Recommended Value | Verification Method |
|---|---|---|
| Maximum module swelling force at 70% SOH (1P12S) | ≤2400 kgf | Constrained-fixture cycling test with calibrated pressure sensor; 0.5P constant power, 25 ±2 °C |
| SOH inflection point for peak-load transition (C1 > C2) | ~94% SOH (~500 cycles at 0.5P) | Track C1 and C2 peaks continuously; document cycle number when C1/C2 ratio exceeds 1.0 |
| End-plate maximum stress at 60% SOH projected load | <159 MPa (A380 yield) | FEA simulation using Abaqus or equivalent; input = linear-extrapolated swelling force at 60% SOH |
| Busbar maximum displacement under lifetime swelling | <3 mm | FEA displacement contour at 60% SOH load; physical inspection of arch geometry after qualification cycling |
| Swelling force–SOH linear regression slope | −7400 ± 5% kgf per SOH unit (post-90% SOH) | Least-squares regression of cycle test data below 90% SOH; R² must be ≥ 0.99 |
| Graphite volume expansion at full lithiation | ≤12.4% | Literature-confirmed Stage I LiC₆ lattice parameter; cross-reference with cell thickness expansion measurement |
Can’t find a supplier meeting these specs? Submit your requirements and we’ll match you within 48 hours.
References #
Data source: Lifecycle Swelling Force Characterization and Structural Simulation of LFP Battery Modules for Stationary Energy Storage Applications, L. Fan et al., Journal of the Electrochemical Society, 2024
Frequently Asked Questions #
Q: Why does swelling force increase as the battery ages, rather than decrease?
A: As active lithium inventory decreases with cycling, the graphite anode no longer reaches full Stage I lithiation at 100% SOC. However, the Stage IV→III phase transition near 30% SOC has a steeper volume-change slope than the Stage II→I transition that dominates at high SOC. The net result is that the 30% SOC swelling peak grows relative to the full-SOC peak as SOH declines, and total force increases because SEI layer growth and irreversible structural changes add non-recoverable thickness to the cell stack over time.
Q: Does using more cells in series increase swelling force proportionally?
A: Yes, swelling forces accumulate additively across series-stacked cells. A 1P12S module generates higher absolute swelling force than a 1P8S module. However, the rate of force increase per unit of SOH degradation is nearly identical between the two configurations — regression slopes of −7429 and −7402 respectively, a difference of only 0.3%. The series count scales the absolute load level but does not change the degradation dynamic.
Q: What is the most structurally vulnerable component in a constrained LFP module under lifetime swelling?
A: The aluminum busbar. End plates and steel straps carry comfortable margins, but the busbars in both tested configurations reached stress levels marginally above the AL1060O yield strength (27.6 MPa) under 60% SOH projected loads. The design mitigation — an arched busbar with >3 mm arch height — works, but only if the arch geometry is manufactured to spec and not flattened out during assembly.
Q: At what SOH should a module be retired if swelling force is the governing criterion?
Based on the linear regression data, maximum swelling force at 60% SOH projects to over 3000 kgf for a 1P12S configuration. Most module structural designs in this class are not validated below 70% SOH. From a purely mechanical standpoint, 70–75% SOH is a reasonable structural retirement threshold unless the module enclosure has been explicitly designed and FEA-validated for the 60% SOH load projection.
Q: Does the initial preload affect how swelling force evolves over the battery’s life?
A: The initial preload (300 kgf in this study) sets the baseline constraint condition and affects absolute force readings, but the relative evolution pattern — peak inversion point, linear slope after 90% SOH — is governed by cell electrochemistry and is not significantly altered by preload within practical assembly tolerances. The preload does need to be subtracted from total measured force when calculating the module’s self-generated swelling contribution for structural analysis purposes.
Published by compactbess.com Technical Team | Request a sourcing quote
Data source: Lifecycle Swelling Force Characterization and Structural Simulation of LFP Battery Modules for Stationary Energy Storage Applications, L. Fan et al., Journal of the Electrochemical Society, 2024


