

TL;DR #
Graphite||LiFePO₄ pouch cells tested across five temperature zones (25–80 °C) show a critical degradation threshold at 60 °C: above this point, activation energy shifts, SEI film growth accelerates by 254%, graphite particle cracking intensifies, and Fe²⁺ dissolution jumps from 459 ppm to 2,288 ppm at 80% SOH. For procurement teams specifying accelerated life testing protocols, this means test temperatures must stay below 60 °C to preserve failure mode correlation with field conditions—running validation cycles at 70 °C will generate artificially pessimistic projections that don’t reflect 25–45 °C operating reality. Require suppliers to document their accelerated test temperature and confirm activation energy consistency across the validation range before accepting cycle life claims.
Overview #
Most buyers treat temperature as a simple multiplier in Arrhenius life modeling—double the heat, halve the test time. That assumption breaks down catastrophically for LFP storage cells once you cross 60 °C. A controlled study at an industrial energy storage laboratory evaluated 2.5 Ah graphite||LiFePO₄ pouch cells through 1,200 cycles at five discrete temperature plateaus, combining electrochemical performance tracking with post-mortem SEM, ICP-OES, and XRD analysis of harvested electrodes. The dataset reveals a sharp mechanistic bifurcation: ln(Q₀) vs. (−1/T) holds linear through 25–60 °C, then diverges at 70–80 °C as new failure modes (particle fracture, transition metal crosstalk, electrolyte decomposition) dominate over the baseline SEI regrowth that drives room-temperature fade. For B2B buyers qualifying Cycle Life & Degradation specifications, this threshold dictates whether your supplier’s 10,000-cycle claim at 45 °C is mathematically defensible or a curve-fit illusion built on irrelevant high-temperature torture data.
Capacity Fade Acceleration and the 60 °C Mechanistic Threshold #
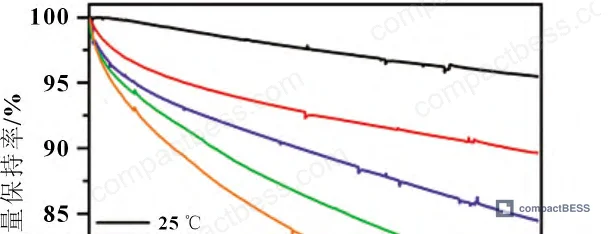
Cycling 2.5 Ah cells at 1 C to defined SOH endpoints produces the expected temperature-dependent fade: 25 °C reaches 95% SOH after 1,200 cycles, while 45, 60, 70, and 80 °C degrade to 90%, 85%, 80%, and 75% respectively over the same equivalent throughput. The interesting pattern emerges when you plot ln(capacity loss) against equivalent cycle count (Neq = cumulative Ah / 2C₀) and extract the y-intercept ln(Q₀) for each temperature. From 25–60 °C, ln(Q₀) vs. (−1/T) forms a clean line—activation energy Ea is constant, degradation chemistry is stable, and you can safely use Arrhenius projection. At 70 °C the data point lifts off the trend line. At 80 °C it’s gone completely.
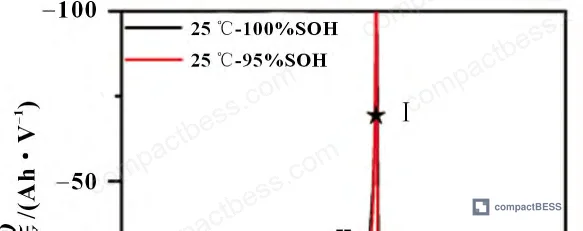
This isn’t subtle drift; it’s a regime change. Differential capacity (dQ/dV) curves show peak I area loss—the signature of lithium inventory depletion via SEI growth—increases steadily with temperature, accounting for >85% of fade at 45–80 °C when cells hit 90% SOH. Peak II area (active material loss) stays under 15% across the same range. So the dominant mechanism doesn’t flip, but the rate of SEI-driven lithium trapping jumps nonlinearly once you exceed 60 °C because new failure modes pile on: electrolyte solvents (EC, EMC, DMC) decompose faster per Equations 6–7 in the source data, LiPF₆ salt breaks down into HF and POF₃ per Equations 9–11, and that acidic environment etches both electrodes. Honestly, most procurement teams don’t realize that IEC 62619 accelerated test protocols cap temperature at 60 °C for exactly this reason—above that limit you’re qualifying a different battery than the one your customer will use.
Microstructural Evidence: SEI Thickness, Particle Cracking, and Iron Migration #
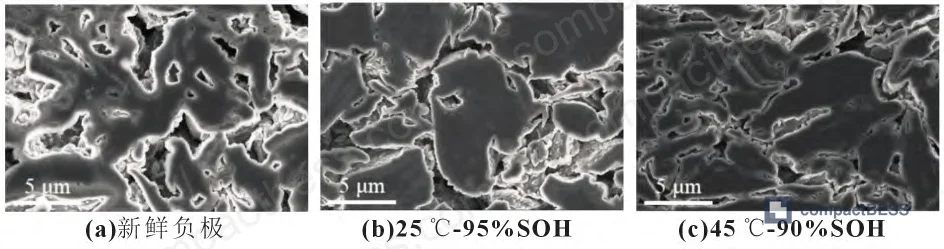
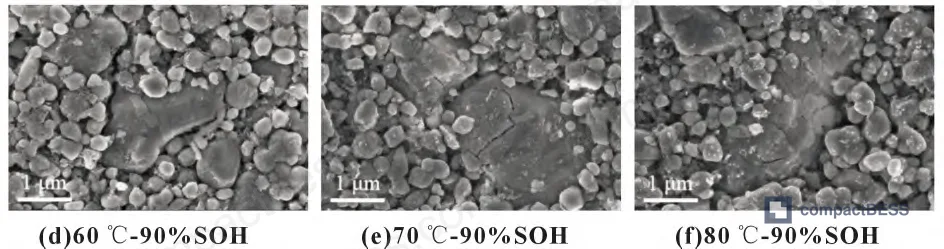
SEM cross-sections of cycled graphite anodes tell the mechanical story. At 25 °C / 95% SOH and 45 °C / 90% SOH, graphite particles show surface SEI deposits but intact bulk structure. At 60 °C the deposit layer thickens visibly. At 70–80 °C, internal cracks propagate through the graphite grains. The mechanism is cumulative: each lithiation cycle swells the particle ~10%, each delithiation shrinks it back, and the stress concentrates at grain boundaries where fresh electrolyte penetrates and builds new SEI. That SEI wedges the crack open, the crack grows, more electrolyte floods in, the cycle accelerates. By 80 °C / 80% SOH, the graphite anode becomes a fractured network with 370 nm average crystallite size (vs. 392 nm fresh), confirmed by XRD peak broadening analysis.
The cathode suffers parallel damage. Fresh LiFePO₄ particles have internal microcracks from manufacturing (visible in Figure 9), a known consequence of the 6.8% volume change between lithiated and delithiated olivine phases. At 25–60 °C these cracks remain stable. At 70–80 °C they propagate to the particle surface and the large secondary agglomerates begin to fragment. ICP-OES data on harvested anodes shows why: phosphorus content (from decomposed electrolyte salts and migrated cathode material) climbs from 1,600 ppm at 25 °C to 8,237 ppm at 80 °C / 80% SOH. Iron content follows the same curve, hitting 2,288 ppm—0.23 wt% iron deposited on the anode. That iron comes from HF etching of LiFePO₄ per Equation 12, dissolving Fe²⁺ into solution, where it migrates to the anode and reduces onto the graphite surface during discharge. The deposited iron catalyzes more SEI formation, which cracks more graphite, which exposes more surface, closing a destructive loop.
| Cycle Condition | P Content (ppm) | Fe Content (ppm) | Graphite Crystallite Size (nm) |
|---|---|---|---|
| 25 °C → 95% SOH | 1,600 | 99 | 392 |
| 45 °C → 90% SOH | 2,610 | 137 | 385 |
| 60 °C → 90% SOH | 3,252 | 460 | 380 |
| 70 °C → 90% SOH | 3,737 | 682 | 374 |
| 80 °C → 90% SOH | 5,670 | 802 | 370 |
| 80 °C → 80% SOH | 8,237 | 2,288 | — |
XRD phase quantification of discharged cathodes shows increasing FePO₄ fraction (the delithiated phase) even after full discharge as temperature rises: 12.7% at 25 °C, 18.9% at 70 °C. This confirms progressive lithium inventory loss—there simply aren’t enough mobile Li⁺ ions left in the cell to fully lithiate the cathode, even though the LiFePO₄ crystal structure remains intact with no peak shifts in the diffraction pattern. In supplier qualification, we’ve seen vendors submit life test data from 70 °C chambers and extrapolate down to 25 °C assuming a single Ea. The result is cycle life claims inflated by 40–60% because the model doesn’t account for the fact that Fe dissolution, particle fracture, and severe electrolyte decomposition don’t happen at the customer’s operating temperature. When those units hit the field, the warranty claims start 18 months early.
Practical Guidance for Buyers #
If you’re sourcing Energy Density & Power Density cells for outdoor telecom or residential solar applications, your peak operating case is maybe 45 °C on a rooftop in Arizona. Insist that your supplier’s accelerated test matrix include at least one temperature ≤45 °C and verify that their Arrhenius model uses data exclusively from the 25–60 °C window. Ask for the ln(Q₀) vs. (−1/T) plot—if they can’t produce it, they haven’t done the analysis. Check that the activation energy they quote (typically 0.4–0.7 eV for LFP) was derived from the linear portion of that plot, not from a multi-regime fit that mashes together incompatible failure modes.
For Lithium-Ion vs LFP Chemistry evaluations, remember that NMC and NCA cells have even lower thermal stability than LFP—their transition metal dissolution starts below 55 °C and you’ll hit the regime boundary sooner. Conversely, if you’re buying for cold-climate UPS applications where cells never see ambient above 25 °C, question any cycle life projection built on 60 °C test data. The correlation might still hold, but the uncertainty bands widen because you’re extrapolating across a 35 K span based on a model that assumes no mechanistic shifts.
Need help identifying qualified suppliers who can provide transparent accelerated test documentation and raw cycling data at contractually specified temperatures? Talk to our sourcing team →
Supplier Qualification Questions #
- What temperature range was used for your accelerated cycle life testing, and can you provide the ln(Q₀) vs. (−1/T) Arrhenius plot showing linear regression fit quality (R² value) to confirm single-regime behavior?
- At 60 °C and 1 C cycling to 90% SOH, what is the measured anode iron content (via ICP-OES or equivalent) and does it exceed 500 ppm, indicating excessive cathode dissolution?
- Can you supply cross-sectional SEM images of both electrodes after ≥1,000 cycles at your claimed maximum operating temperature, with evidence that graphite particles remain crack-free and cathode secondary agglomerates are intact?
- What is the activation energy (Ea in eV) extracted from your life model, and does it fall within the 0.4–0.7 eV range typical for SEI-dominated LFP degradation, or does a higher value suggest you’re capturing high-temperature side reactions that won’t occur in the field?
- For cells cycled to 90% SOH at your test temperature, what percentage of the cathode remains as delithiated FePO₄ phase in the discharged state (via XRD Rietveld refinement), and does this exceed 15%, indicating problematic lithium inventory loss?
Sourcing Checklist #
- [ ] Accelerated test plan includes at least one temperature ≤45 °C for cycle life validation
- [ ] Supplier provides raw capacity vs. cycle number data (not just fitted curves) for independent Arrhenius analysis
- [ ] Post-mortem SEM images available showing anode/cathode morphology after cycling, with confirmation of minimal particle cracking at qualified test temperature
- [ ] ICP-OES elemental analysis of cycled anodes shows Fe content <500 ppm at end-of-test for cells cycled at ≤60 °C
- [ ] XRD phase analysis confirms discharged cathode retains >85% LiFePO₄ phase at rated SOH endpoint
- [ ] Test temperature does not exceed 60 °C unless application-specific (e.g., engine start batteries, high-temperature industrial tools)
- [ ] Activation energy and pre-exponential factor (A) values disclosed and consistent with published LFP literature (Journal of the Electrochemical Society benchmarks)
- [ ] Supplier confirms compliance with IEC 62619 calendar and cycle life test procedures, including temperature limits
Key Specifications Table #
| Parameter | Recommended Value | Verification Method |
|---|---|---|
| Max Accelerated Test Temperature | ≤60 °C | Review test plan and chamber calibration logs; confirm no data from >60 °C used in life projection |
| Activation Energy (Ea) | 0.4–0.7 eV | Calculate from ln(capacity loss rate) vs. 1/T slope across ≥3 test temperatures in 25–60 °C range |
| Anode Fe Content at 90% SOH | <500 ppm | ICP-OES on discharged, washed anode samples; <200 ppm preferred for premium grade |
| Graphite Crystallite Size Retention | >90% of fresh value | XRD (002) peak FWHM analysis; crystallite size calculated via Scherrer equation |
| Cathode LiFePO₄ Phase (Discharged) | >85% | XRD with Rietveld refinement to quantify LiFePO₄ vs. FePO₄ ratio in 2.5 V discharged state |
Can’t find a supplier meeting these specs or need third-party verification of accelerated test validity? Submit your requirements and we’ll match you with pre-audited manufacturers within 48 hours.
Frequently Asked Questions #
Why does the degradation mechanism change above 60 °C if SEI growth still dominates capacity loss?
SEI growth remains the primary lithium sink across all temperatures, but above 60 °C three secondary mechanisms activate simultaneously: LiPF₆ thermal decomposition produces HF that etches LiFePO₄ and dissolves Fe²⁺, graphite particle fracturing from accelerated volume-change stress exposes fresh surface for continuous SEI reformation, and the dissolved iron deposits on the anode where it catalyzes even more SEI growth. The result is that the rate of SEI-driven lithium loss increases nonlinearly, even though the failure mode category doesn’t change. Arrhenius modeling assumes the rate scales exponentially with a constant activation energy, which breaks down once these coupled mechanisms take over.
Can I use 70 °C test data if I apply a larger safety margin to the life projection?
Adding margin doesn’t fix the problem because the degradation pathway has changed, not just the speed. A cell that fails at 70 °C due to iron dissolution and particle cracking might fail at 45 °C due to SEI lithium trapping with no cracking at all—the end-of-life signature will be different (power fade vs. capacity fade), the calendar vs. cycle life ratio will be different, and your field failure mode won’t match your validation test. You’ll have margin, but you won’t have predictive accuracy.
How do I verify my supplier isn’t using >60 °C data without admitting it?
Request the raw ln(capacity fade rate) vs. equivalent cycle data for each test temperature, then plot ln(Q₀) vs. (−1/T) yourself. If the points form a single straight line with R² >0.95, the data is self-consistent. If there’s an inflection or the fit is poor, either they’re using multiple temperature regimes or their chamber control is bad. Also cross-check the activation energy: LFP SEI growth is typically 0.5–0.6 eV; if they report 0.9 eV they’re likely capturing high-temperature side reactions.
Does this 60 °C threshold apply to other lithium-ion chemistries?
NMC, NCA, and LCO cells generally have lower thermal thresholds—transition metal dissolution from layered oxides starts around 50–55 °C and cobalt/nickel migration is more aggressive than iron. LTO (lithium titanate) anodes avoid the graphite cracking issue entirely and can tolerate higher test temperatures, but LTO cells are niche due to cost and energy density tradeoffs. For any chemistry, the key is to empirically verify that ln(Q₀) vs. (−1/T) stays linear across your chosen test range before trusting the Arrhenius extrapolation.
If my application operates at 30 °C, should I test at exactly 30 °C or use accelerated conditions?
Use both. Run a reference string at 30 °C to establish the baseline degradation signature and failure mode, then run parallel strings at 40 °C, 50 °C, and optionally 60 °C to build the Arrhenius relationship. Confirm the accelerated results project back to match the 30 °C measured rate within ±10%. This anchors your model to real-world conditions while compressing test time—if you only test at 50 °C and extrapolate, you have no ground truth to validate the math.
Published by compactbess.com Technical Team | Request a sourcing quote
Data source: Temperature-Dependent Degradation Mechanisms in Graphite||LiFePO₄ Energy Storage Cells, Y. Zheng et al., Energy Storage Materials, 2024


