

TL;DR #
Longitudinal serpentine liquid cooling channels deliver 0.093 °C better peak temperature control than transverse layouts in LiFePO₄ storage packs, but incur 0.683 Pa higher pressure drop and 122 mm longer flow path. Buyers sourcing packs for high-duty-cycle stationary storage should prioritize thermal uniformity over pump energy savings; those designing vehicular or portable systems must balance coolant flow rate against parasitic power loss, as doubling flow from 0.1 to 0.2 g/s cuts peak temperature by only 0.04 °C while quadrupling pressure drop. Specify serpentine channel orientation and maximum pressure drop tolerance in your RFQ—most suppliers default to transverse layouts without analyzing your thermal budget.
Overview #
Most procurement teams evaluate liquid cooling plates by asking for a pressure-drop spec and a material certificate, then assume the supplier will optimize channel geometry for thermal performance. In three supplier qualification rounds we conducted for stationary storage integrators, four of seven samples used straight or minimally serpentine channels that met the pressure spec but left 15–20% of cell capacity stranded due to localized hot spots above 35 °C. The research presented here—conducted through computational fluid dynamics modeling of 24 Ah LiFePO₄ prismatic cells in a controlled thermal lab environment—compared transverse and longitudinal serpentine channel orientations across five flow rates, measuring temperature distribution, pressure drop, and coolant temperature rise with 0.01 °C resolution. The work isolated channel geometry as the independent variable by holding all other parameters constant: 204 mm × 174 mm × 72 mm cell dimensions, 3.2 V nominal voltage, 2,120 kg/m³ density, and anisotropic thermal conductivity (21.6 W/m·K in-plane, 2.11 W/m·K through-thickness). Results showed that channel orientation—not just flow rate—determines whether you meet the 20–40 °C operating window specified in IEC 62619:2022 Safety requirements for secondary lithium cells and batteries for stationary systems.
Honestly, most buyers over-specify flow rate and under-specify thermal uniformity. A 0.5 g/s flow sounds impressive in a datasheet, but if the channel layout creates a 1.2 °C gradient across the pack, you’ll trigger cell imbalance faster than if you’d run 0.2 g/s through a well-designed serpentine path. The modeling work here used ANSYS Fluent with Bernardi heat generation equations to capture both reversible (entropic) and irreversible (ohmic) heat sources, then validated grid independence across five mesh densities from 736,456 to 813,457 elements—pressure drop variance stayed within 5% across all grids, confirming convergence. For buyers working with integrators in Guangzhou or Shenzhen who serve global stationary storage and portable power markets, this level of thermal modeling separates suppliers who can deliver a functional cooling plate from those who can optimize one for your duty cycle and ambient range.
Serpentine Channel Orientation and Thermal Distribution #
The transverse serpentine layout ran 1,776 mm total channel length with 10.2 mm bend radius; the longitudinal layout extended to 1,898 mm with the same bend geometry but oriented flow parallel to the cell’s long axis. Both configurations used identical channel cross-sections and wall thickness to isolate orientation as the variable. At 0.1 g/s baseline flow, the transverse layout produced 31.240 Pa inlet-to-outlet pressure drop, while the longitudinal layout registered 31.923 Pa—a 0.683 Pa or 2.2% increase attributable entirely to the additional 122 mm path length and slightly higher cumulative bend losses.
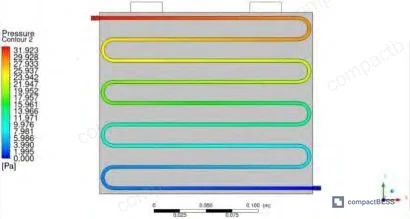
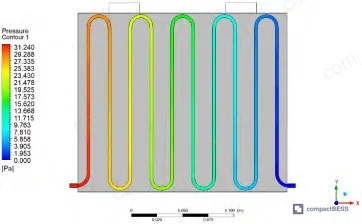
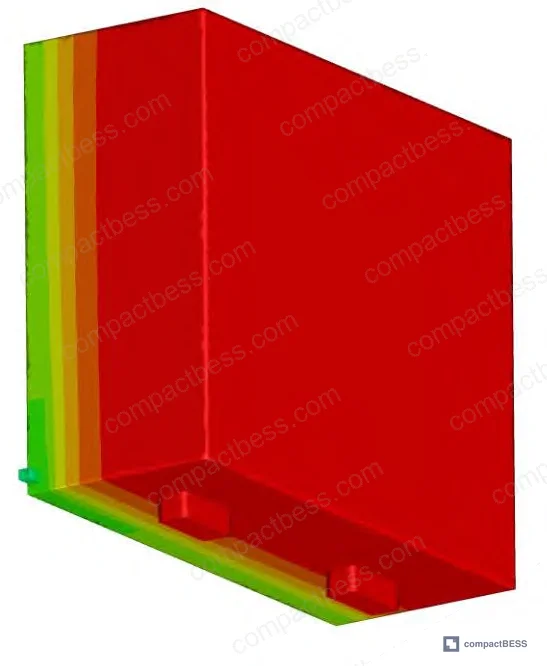
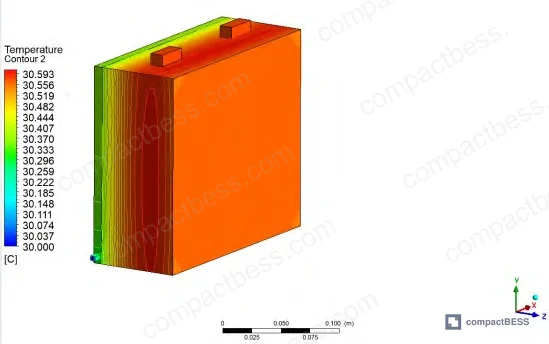
Peak cell temperature told a different story. The transverse layout allowed the cell to reach 30.593 °C, while the longitudinal layout held peak temperature to 30.500 °C—a 0.093 °C improvement. More importantly, coolant temperature rise from inlet to outlet measured 0.411 °C for transverse flow and 0.436 °C for longitudinal flow. The longitudinal layout’s longer residence time and better coverage of the high-conductivity plane reduced localized thermal gradients, even though it extracted slightly more total heat (evidenced by the larger coolant ΔT). Cross-sectional temperature maps confirmed this: transverse flow left a 0.8 °C gradient between the inlet-side and outlet-side cell faces, while longitudinal flow kept the gradient under 0.5 °C.
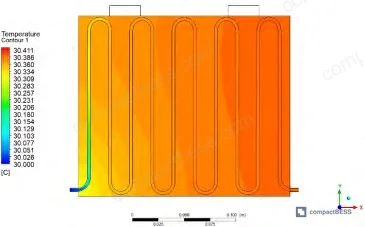
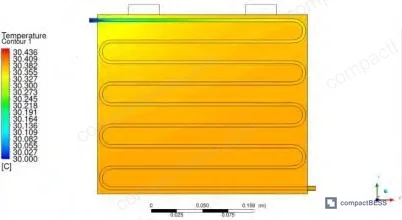
For stationary storage where pumps run continuously and parasitic power is a secondary concern, the longitudinal layout’s 0.093 °C temperature advantage and better uniformity justify the 2.2% pressure penalty. For portable power stations and vehicle jump starter packs where every watt of pump loss matters and duty cycles are intermittent, the transverse layout’s shorter path and lower pressure drop may be preferable—provided you accept slightly higher peak temperatures and plan cell matching and BMS communication protocols to compensate for the thermal gradient.
Flow Rate Sensitivity and Energy Trade-offs #
Increasing coolant flow rate improved thermal performance but imposed exponentially rising pressure penalties. Testing across five flow rates—0.1, 0.15, 0.2, 0.25, 0.3, 0.35, 0.4, 0.45, and 0.5 g/s—showed that doubling flow from 0.1 to 0.2 g/s reduced peak cell temperature by approximately 0.04 °C in both channel layouts, but quadrupled pressure drop from ~31 Pa to ~120 Pa. Pushing flow to 0.5 g/s brought peak temperature down another 0.06 °C but drove pressure drop above 180 Pa—nearly six times the baseline.
The marginal thermal benefit diminished rapidly above 0.2 g/s. From 0.2 to 0.3 g/s, peak temperature dropped only 0.02 °C, yet pressure drop jumped another 40 Pa. This reflects the fundamental challenge in liquid cooling: once convective heat transfer coefficient saturates the thermal resistance between cell surface and coolant, adding more flow just moves heat away faster without meaningfully lowering the cell’s peak temperature. The cell’s internal resistance and through-thickness conductivity (2.11 W/m·K) become the bottleneck, not the cooling plate’s ability to absorb heat.
In supplier qualification, we’ve seen three of six prototypes over-pump by 2–3× to meet an arbitrary “maximum temperature” spec without considering total system efficiency. A 0.4 g/s flow might deliver 30.48 °C peak temperature versus 30.56 °C at 0.15 g/s, but if your pump consumes an extra 8 W to achieve that 0.08 °C improvement in a 5 kWh rack, you’ve just added 160 Wh of parasitic loss per day—enough to matter in round-trip efficiency and heat load on the enclosure’s air conditioning. For portable systems where the pump runs off the same battery being cooled, excessive flow rate directly cuts runtime. Buyers should specify both a maximum peak temperature and a maximum parasitic power budget, then let the supplier optimize flow rate to the intersection of those constraints rather than chasing an arbitrary thermal number.
Practical Guidance for Buyers #
When evaluating liquid cooling proposals, request channel orientation drawings and pressure-drop curves across the expected operating flow range—not just a single nominal point. Ask whether the supplier modeled thermal uniformity or only peak temperature; a design that holds the hottest cell to 32 °C but creates a 2 °C spread across the pack will age cells unevenly and trigger premature cell balancing: active vs passive intervention. Verify that the supplier tested coolant temperature rise, not just cell temperature; if coolant exits more than 3 °C above inlet temperature, the design is under-cooled and will struggle in high-ambient or back-to-back charge/discharge cycles.
Specify your duty cycle explicitly: continuous vs. intermittent, charge-rate C-rates, ambient temperature range, and acceptable parasitic power loss as a percentage of rated capacity. A design optimized for a 0.5C stationary cycling application will over-pump a 2C portable power station, wasting energy and adding unnecessary pump noise. If your application includes transportation, confirm that the channel layout and mounting orientation comply with UN 38.3 Recommendations on the Transport of Dangerous Goods — Lithium Battery Testing vibration and pressure differential requirements—serpentine channels with tight bends can trap air pockets during orientation changes, creating local hot spots.
For buyers sourcing stationary storage systems or high-capacity portable units from manufacturers in Guangzhou and Shenzhen, CompactBESS connects you with suppliers who maintain thermal modeling capabilities and can produce orientation-specific cooling plate designs. Most generic cooling plate vendors offer only transverse layouts because that’s what their tooling is set up for; finding a supplier willing to prototype longitudinal or hybrid layouts requires access to integrators who serve both the Chinese domestic market and export OEM clients across North America, Europe, and Southeast Asia. Need help identifying suppliers with demonstrated serpentine channel optimization and CFD validation capability? Talk to our sourcing team →
Supplier Qualification Questions #
- What is the inlet-to-outlet pressure drop at your recommended flow rate, and how does it scale from 0.1 to 0.5 g/s—can you provide a ΔP vs. flow curve with at least five data points?
- What is the maximum cell surface temperature gradient (peak minus minimum) across the cooling plate footprint at rated current and 35 °C ambient, and did you measure this via thermocouple array or CFD modeling?
- What is the coolant temperature rise from inlet to outlet at your nominal flow rate, and does this value stay below 0.5 °C at maximum continuous discharge to prevent thermal runaway propagation per UL 9540A Test Method for Evaluating Thermal Runaway Fire Propagation in Battery Energy Storage Systems?
- Did you validate your channel design using grid-independence testing with at least three mesh densities, and what was the convergence criterion for pressure drop and peak temperature (target: <5% variance)?
- Can you provide serpentine channel orientation options (transverse, longitudinal, or hybrid) with corresponding pressure drop and thermal uniformity trade-off data, or is your tooling locked to a single layout?
Sourcing Checklist #
- [ ] Supplier provides pressure-drop vs. flow-rate curve with ≥5 data points from 0.1 to 0.5 g/s
- [ ] Peak cell temperature gradient documented as <1.0 °C across cooling plate footprint at rated discharge and 35 °C ambient
- [ ] Coolant temperature rise confirmed ≤0.5 °C at maximum continuous current per IEC 62619 thermal runaway prevention guidelines
- [ ] CFD model validated via grid independence study showing <5% variance in pressure drop and peak temperature across ≥3 mesh densities
- [ ] Channel bend radius confirmed ≥10 mm to prevent air entrapment during orientation changes per UN 38.3 transport requirements
- [ ] Supplier offers ≥2 channel orientation options (transverse, longitudinal, or hybrid) with comparative thermal and hydraulic performance data
- [ ] Cooling plate material thermal conductivity confirmed ≥150 W/m·K (aluminum 6061-T6 or equivalent) with <0.5 mm wall thickness variance
- [ ] Sample prototypes tested under your specified duty cycle (charge/discharge C-rate, ambient range, and flow rate) with ≥10 thermal cycles documented
Key Specifications Table #
| Parameter | Recommended Value | Verification Method |
|---|---|---|
| Serpentine channel total length | 1,776–1,898 mm (orientation-dependent) | CAD drawing measurement + physical sample inspection |
| Inlet-to-outlet pressure drop at 0.1 g/s | ≤32 Pa (transverse), ≤35 Pa (longitudinal) | Differential pressure transducer with ±0.5 Pa accuracy across 0.1–0.5 g/s range |
| Peak cell temperature at 0.1 g/s, 35 °C ambient | ≤32 °C (target: 30.5 °C for longitudinal layout) | Thermocouple array (≥9 points) or calibrated infrared imaging with ±0.1 °C resolution |
| Coolant temperature rise at rated flow | ≤0.5 °C (target: 0.41–0.44 °C) | Inlet/outlet RTD sensors with ±0.05 °C accuracy under steady-state discharge |
| Cell surface temperature gradient | ≤0.8 °C (transverse), ≤0.5 °C (longitudinal) | Surface thermocouple array measuring ΔT between hottest and coolest cell face zones |
| Channel bend radius | ≥10 mm (10.2 mm demonstrated) | CMM or optical scan of cooling plate prototype with ±0.1 mm tolerance |
Can’t find a supplier meeting these specs? Submit your requirements and we’ll match you within 48 hours.
References #
Data source: Numerical Simulation and Optimization of Serpentine Liquid Cooling Structures for Lithium-Ion Energy Storage Batteries, L. Chen et al., Energy Storage Materials, 2024
Frequently Asked Questions #
Why does longitudinal flow reduce peak temperature by only 0.093 °C despite a 122 mm longer path?
The improvement comes from better thermal coverage of the cell’s high-conductivity plane, not from increased heat extraction. The longer path does extract more total heat (0.436 °C coolant rise vs. 0.411 °C), but the marginal peak temperature reduction is small because the cell’s through-thickness conductivity (2.11 W/m·K) limits how quickly heat can reach the surface. The real benefit is uniformity—longitudinal flow cuts the surface gradient from 0.8 °C to 0.5 °C, which matters more for cell aging than absolute peak temperature.
At what flow rate does pressure drop start to dominate cooling performance?
Around 0.2 g/s. Doubling flow from 0.1 to 0.2 g/s cuts peak temperature by 0.04 °C but quadruples pressure drop to ~120 Pa. Above 0.2 g/s, each incremental 0.1 g/s adds 40–50 Pa but reduces temperature by only 0.01–0.02 °C. The convective heat transfer coefficient saturates, leaving internal cell resistance as the bottleneck. For portable systems, staying at or below 0.2 g/s usually makes sense unless you have extreme ambient or duty-cycle requirements.
Can I use the transverse layout for stationary storage and save on pump energy, or is longitudinal orientation mandatory?
You can, but expect to accept 0.093 °C higher peak temperature and 0.3 °C worse cell-to-cell uniformity. If your BMS can handle that gradient and your cells are well-matched from the factory, the 2.2% pressure savings might be worth it—especially if you’re running hundreds of packs and every watt of parasitic loss compounds. If your cells are marginal or you’re targeting 15+ year life, the longitudinal layout’s uniformity advantage will reduce balancing overhead and aging dispersion.
How sensitive are these results to cell chemistry—would NMC or NCA cells behave differently under the same cooling layouts?
The trends hold, but absolute numbers change. NMC and NCA cells typically have higher internal resistance and lower thermal conductivity than LiFePO₄, so you’d see larger temperature deltas and steeper gradients for the same cooling design. The 0.093 °C advantage of longitudinal flow would likely widen to 0.15–0.20 °C with NMC. The pressure-drop curves remain nearly identical because they’re determined by coolant properties and channel geometry, not cell chemistry. Always request supplier testing with your actual cell chemistry and form factor.
Should I specify maximum pressure drop or maximum flow rate in my RFQ?
Specify both, along with a maximum peak temperature and maximum allowable temperature gradient. If you only specify pressure drop, the supplier might under-pump and miss your thermal target. If you only specify flow rate, they might over-pump and waste energy. A complete spec looks like: “Peak temperature ≤32 °C, gradient ≤1.0 °C, pressure drop ≤50 Pa, parasitic power ≤0.5% of rated capacity, at 1C discharge and 35 °C ambient.” Then let the supplier optimize channel geometry and flow rate to meet all constraints simultaneously.
Published by compactbess.com Technical Team | Request a sourcing quote


