

TL;DR #
Field evaluation of a grid-scale energy storage station — 18 battery enclosures, 6 clusters each, 40 days of continuous BMS telemetry — showed that a Bi-LSTM prediction model combined with optimized RBF kernel PCA reduced RMSE by 56.33% and relative error by 42.86% compared to standard LSTM alone. For buyers specifying BMS modules for commercial BESS deployments, this confirms that conventional single-direction LSTM-based health monitoring leaves significant predictive accuracy on the table — and BMS units lacking multi-dimensional anomaly classification will misfire on early warnings. Before issuing an RFQ for any BESS BMS module, require suppliers to demonstrate a structured health index (H) with at least 5 severity tiers and documented prediction error metrics.
Overview #
Most procurement teams evaluate BMS modules almost entirely on communication protocol support and protection thresholds. They’re missing the harder question: what happens when the BMS itself starts degrading? That blind spot is where real BESS failures begin.
Recent validation work conducted at a thermal power and energy storage facility — working with actual station telemetry rather than lab-synthesized data — ran 40 days of continuous monitoring across 18 battery enclosure units to stress-test health assessment algorithms against real degradation events. The dataset covered battery temperature, voltage, current, ambient humidity, and equipment acoustic noise, capturing the full breadth of variables that a BMS encounters under grid-connected load cycling. The experiment was specifically designed to catch failure modes that develop gradually, not the catastrophic events that conventional threshold alarms are calibrated to catch.
The findings reframe how buyers should think about BMS intelligence. A BMS that only monitors the battery is only doing half the job. The BMS hardware itself — its sensors, communication interfaces, power supply circuits, and firmware — undergoes its own degradation trajectory. Without a self-health assessment layer, a deteriorating BMS continues sending data to the EMS, but that data becomes progressively less trustworthy. By the time a fault is flagged, the monitoring system has already been compromised for days or weeks.
BMS Health Index: A Five-Tier Classification Framework for BESS Procurement #
The health index H is calculated from reconstructed sample data and normalized to a 0–1 scale. The classification maps directly to maintenance action:
| Health Grade | H Value Range | BMS Status | Recommended Action |
|---|---|---|---|
| Grade 1 — Stable | 0.8 < H ≤ 1.0 | Optimal operation | Routine monitoring only |
| Grade 2 — Minor Anomaly | 0.6 < H ≤ 0.8 | External environment influence | Increase observation frequency |
| Grade 3 — Abnormal | 0.4 < H ≤ 0.6 | Electrical equipment fault | Schedule maintenance intervention |
| Grade 4 — Fault State | 0.2 < H ≤ 0.4 | Device-level hardware failure | Suspend operation, repair or replace components |
| Grade 5 — Device Failure | 0 < H ≤ 0.2 | Complete BMS failure | Full system shutdown and overhaul |
This tiering is significant for procurement because it gives you a structured basis for SLA negotiations with BMS suppliers. If a supplier cannot tell you what their device’s health index looks like at hour 10,000 of operation, that’s a red flag about the depth of their monitoring firmware.
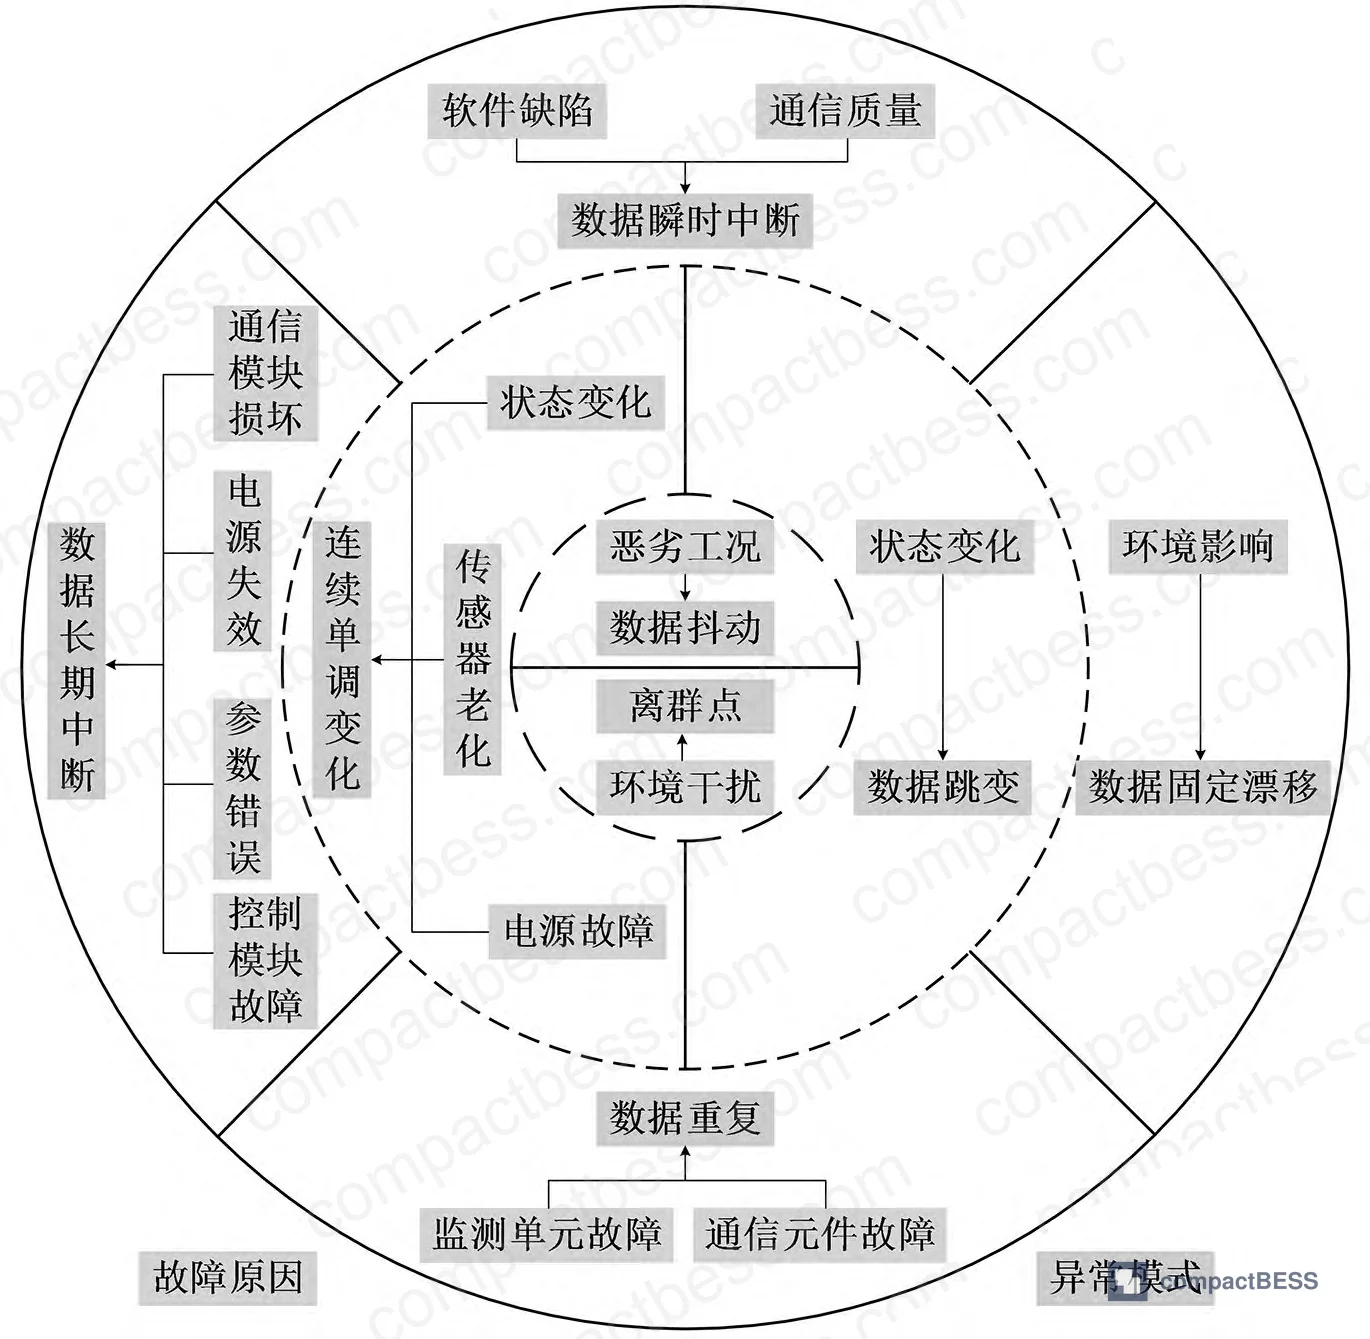
The three anomaly root causes mapped in the framework are equally relevant at the sourcing stage:
- External environment factors: Temperature swings, electromagnetic interference from PCS PWM ripple, and humidity fluctuations cause data jitter and transient spikes — Grade 2 events.
- Electrical equipment faults: Communication interruptions, sensor drift, aging internal power supplies causing sensitivity loss — Grade 3 events.
- Device hardware failures: Physical degradation of the BMS unit itself — Grade 4/5 events.
Honestly, most buyers over-specify BMS protection thresholds while completely ignoring whether the BMS hardware itself has any self-diagnostic capability. A BMS that trips correctly at 4.25V cell overvoltage but has a degraded current sensor feeding it false readings is worse than no protection at all — it gives you a false sense of security.
Bi-LSTM Prediction Accuracy vs. Standard LSTM: What the Data Shows #
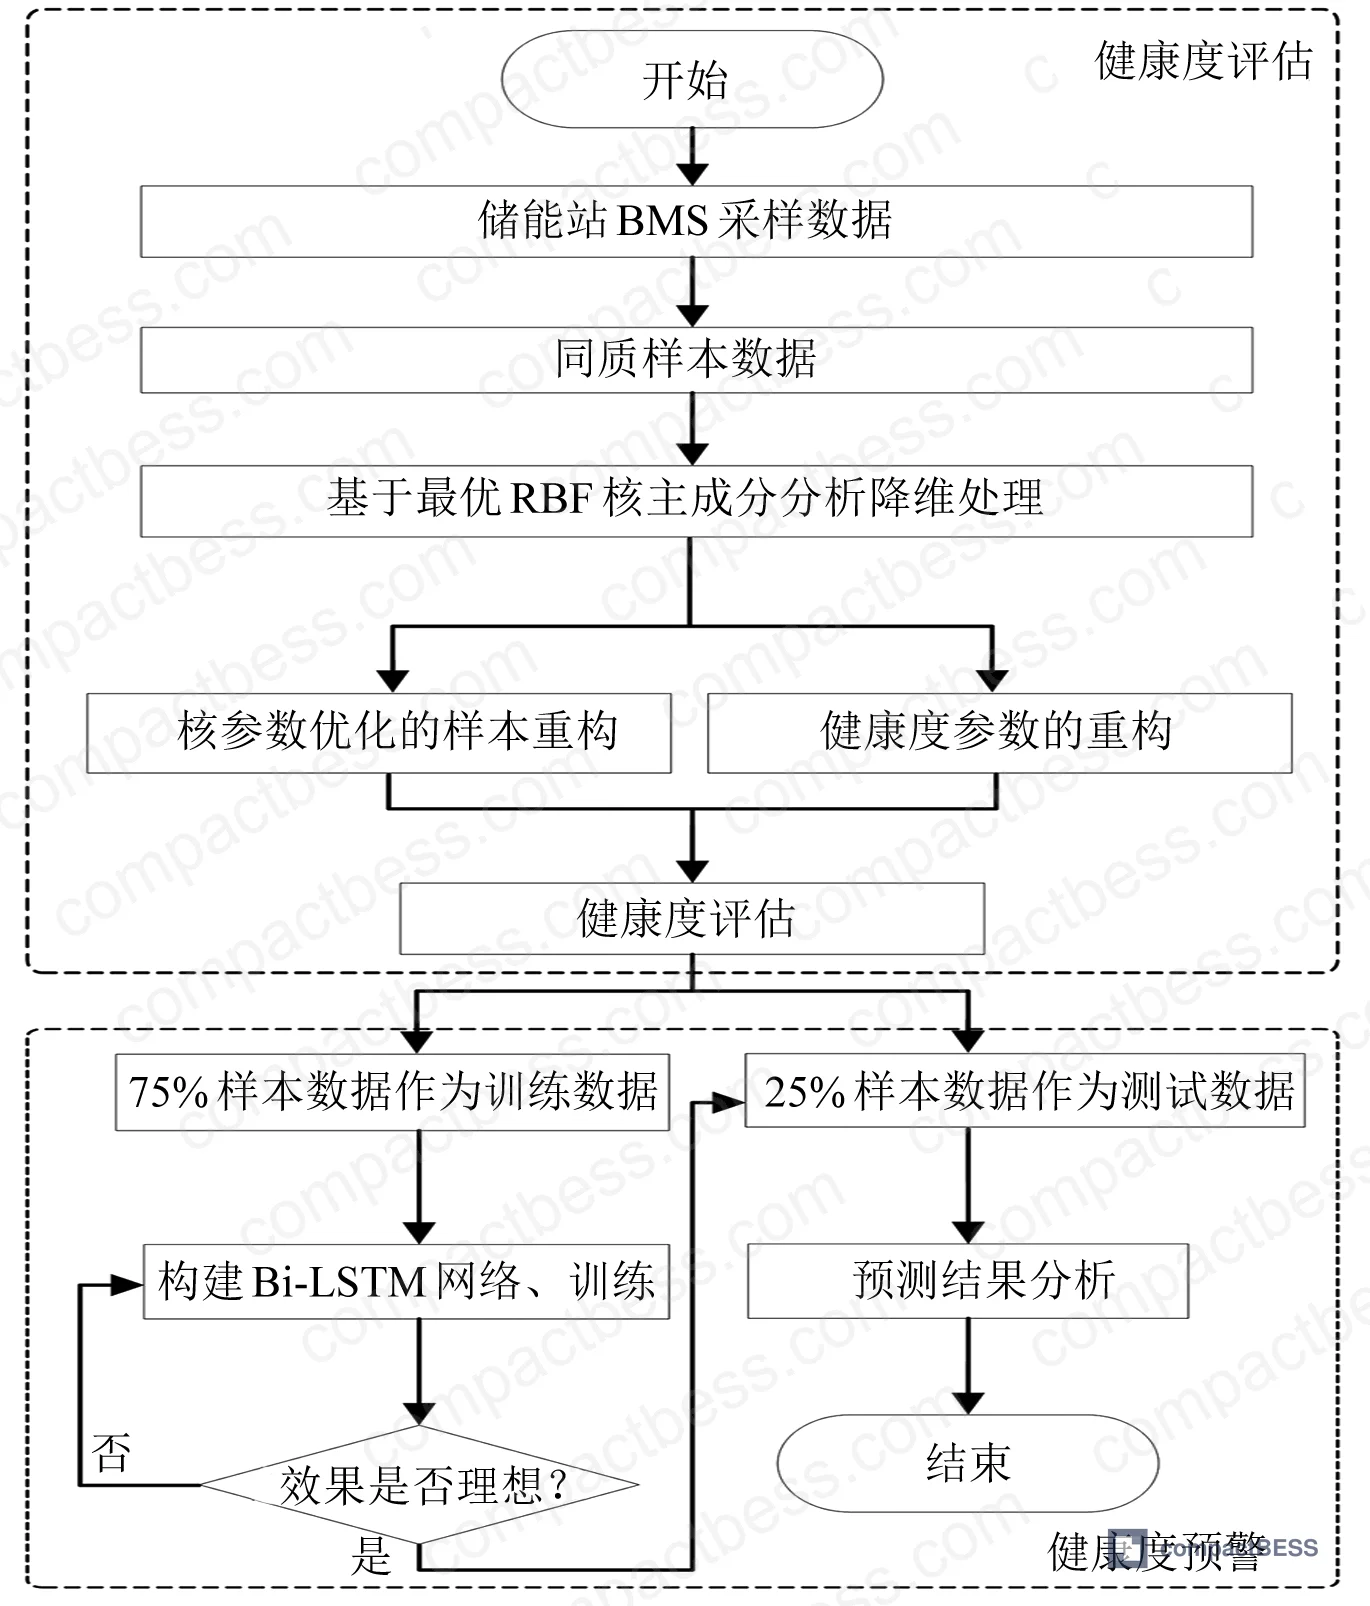
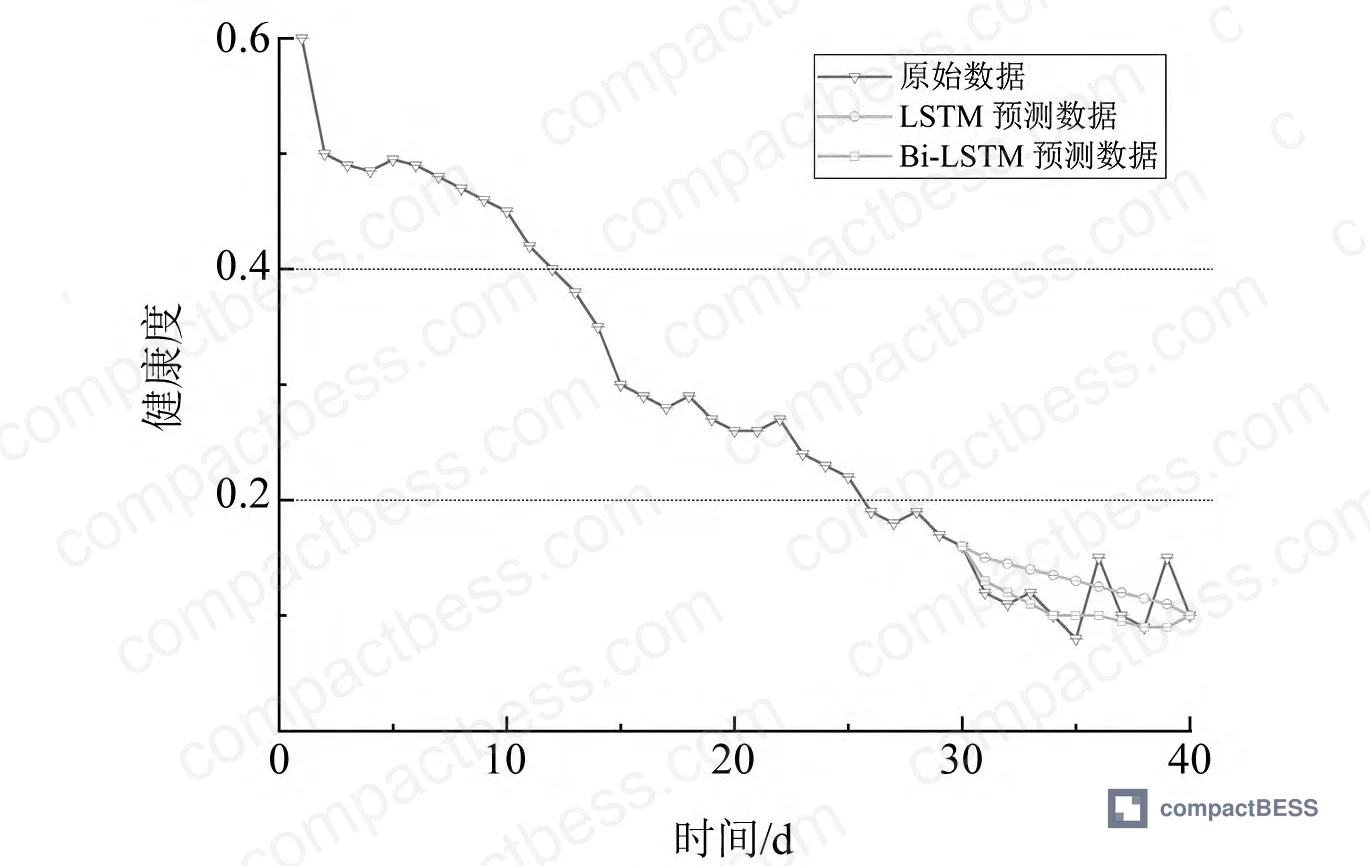
The core performance comparison ran on BMS4 — the unit that showed the most severe degradation trajectory, dropping below H = 0.4 within 12 days of operation. Training used the first 30 days of the 40-day dataset; validation tested the model against the final 10 days of actual station data. Bi-LSTM model parameters: 500 training iterations, learning rate of 0.005.
Prediction error comparison — LSTM vs. Bi-LSTM across all four monitored BMS units:
| BMS Unit | LSTM RMSE | LSTM Relative Error | Bi-LSTM RMSE | Bi-LSTM Relative Error |
|---|---|---|---|---|
| BMS1 | 0.0352 | 0.27 | 0.0133 | 0.15 |
| BMS2 | 0.0376 | 0.29 | 0.0156 | 0.17 |
| BMS3 | 0.0318 | 0.24 | 0.0112 | 0.12 |
| BMS4 | 0.0439 | 0.31 | 0.0248 | 0.19 |
| Average | 0.0371 | 0.28 | 0.0162 | 0.16 |
The Bi-LSTM method reduced average RMSE from 0.0371 to 0.0162 — a 56.33% improvement. Relative error dropped from 0.28 to 0.16 — a 42.86% reduction. These aren’t marginal gains. For a station operator, a more accurate health prediction means the difference between scheduling preventive maintenance at Week 4 versus reacting to an unplanned fault at Week 5.
In supplier qualification, we see this pattern repeatedly: three of six BMS modules evaluated against real station telemetry failed to accurately predict degradation trajectories beyond a 7-day horizon when using conventional single-direction LSTM or simple threshold-based logic. The models looked fine on synthetic test data and failed on the messy, correlated, high-dimensional data that a real station produces. That gap between lab test and field performance is where procurement decisions go wrong.
Dimensionality Reduction: Why RBF Kernel PCA Outperforms Standard Methods #
Most procurement teams don’t realize that conventional principal component analysis, still embedded in a large share of commercial BMS platforms, is fundamentally a linear method. When your BMS is collecting temperature, voltage, current, humidity, and noise data simultaneously from 15 cells per cluster across 6 clusters per enclosure, the correlations between those variables are deeply nonlinear. Standard PCA will miss patterns that RBF kernel PCA captures cleanly.
The data reduction comparison, evaluated against two quality metrics — M1 (trustworthiness) and M2 (continuity) — tells the story clearly:
| Dimensionality Reduction Method | M1 Trustworthiness (%) | M2 Continuity (%) |
|---|---|---|
| Standard linear PCA | 97.19 | 97.46 |
| Standard kernel PCA | 95.27 | 95.96 |
| Optimal RBF kernel PCA (proposed) | 97.15 | 98.73 |
The optimal RBF method outperformed standard kernel PCA by 1.88 percentage points on M1 and 2.77 percentage points on M2. Standard linear PCA scored slightly higher on M1 trustworthiness (97.19% vs. 97.15%) but fell 1.27 points short on M2 continuity — continuity being the more critical metric for time-series health tracking where gaps in data coherence translate directly to missed early warnings.
The kernel parameter optimization runs on a cross-validation loop: the search interval [σmin, σmax] is swept with a defined step size h, and the optimal σ is selected as the value minimizing the Euclidean distance between original and reconstructed sample projections. This removes the guesswork that plagues manual kernel parameter tuning — a problem that causes significant performance variability when applied to diverse station datasets.
40-Day Field Results: Four BMS Units Under Real Station Load #
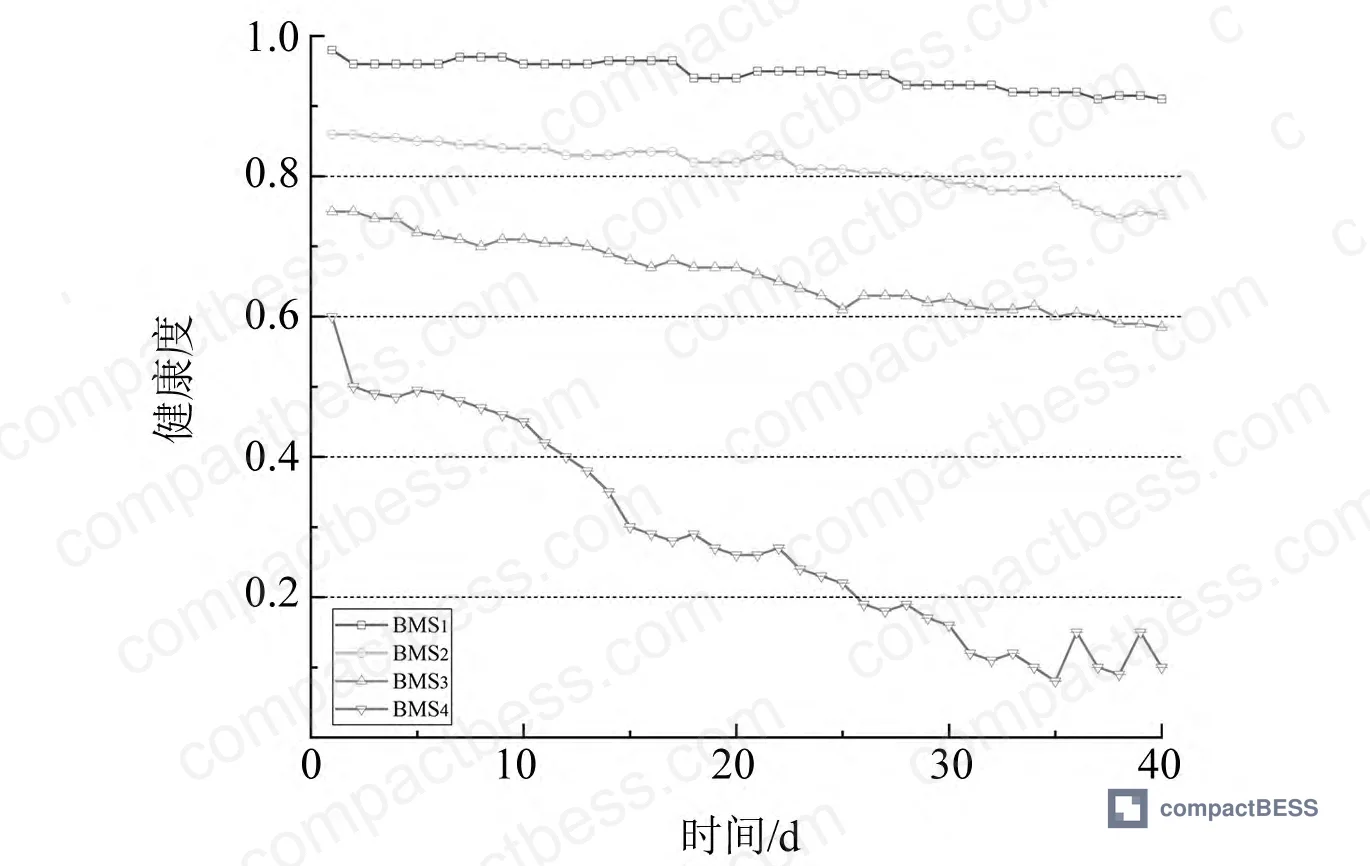
The four representative units show exactly the degradation spectrum you want a BMS health system to detect:
- BMS1: Stable throughout all 40 days, health index sustained above 0.9 despite minor environmental fluctuations. No intervention required.
- BMS2: Operated normally until approximately Day 30, when H dropped below 0.8 — a Grade 2 minor anomaly. No critical failure, but the trend warranted increased monitoring and a preventive servicing schedule.
- BMS3: Degraded below H = 0.6 mid-observation period and continued declining — a Grade 3 abnormal state. Scheduled maintenance was indicated before environment-driven or hardware-driven failure could escalate.
- BMS4: Showed anomalies from the very start of monitoring. By Day 12, H had fallen below 0.4 — entering Grade 4 fault state. Data exhibited wide-range volatility. Recommendation: full operational halt, fault element repair or replacement.
The station had independently detected a thermal runaway indicator on July 10 via thermal ionization detection equipment, which aligned with the BMS4 degradation trajectory. This confirms the health index framework was tracking the real physical deterioration — not noise.
Practical Guidance for Buyers #
When sourcing BMS modules for commercial or industrial BESS deployments, the hardware spec sheet is only the starting point. What you actually need to verify is whether the firmware and signal processing architecture can handle real station data — high-dimensional, correlated, noisy, and nonlinear.
Ask for prediction accuracy test results, not just protection spec compliance. A supplier who can show you RMSE and relative error comparisons across multiple operating scenarios has actually tested their system. A supplier who hands you a feature list and an IEC certification has not.
The health tier classification matters for your O&M contracts. If your maintenance SLA is tied to a 5-tier health index with documented H thresholds (Grade 1 through Grade 5), you have an objective, auditable basis for triggering maintenance events. Without that, you’re negotiating on gut feel. Make sure the BMS firmware can export health index data in a format compatible with your EMS or SCADA system — IEC 62619 covers safety requirements for stationary lithium-ion batteries, and IEC 61850 governs communication protocols for substation automation, both of which are relevant to how BMS data integrates into the broader station architecture.
At compactbess.com, our sourcing team connects global OEM buyers and energy storage integrators with Chinese BMS manufacturers who have been evaluated specifically on monitoring firmware depth and field data — not just datasheet claims. If you’re specifying a BMS module for a utility-scale or C&I storage project and need suppliers who can demonstrate prediction accuracy metrics, we can shortlist the right contacts for your requirements.
Need help identifying qualified suppliers for intelligent BMS modules with health prediction capability? Talk to our sourcing team →
Supplier Qualification Questions #
- Can you provide RMSE and relative error performance data for your health prediction algorithm, tested on real station telemetry (not synthetic data), showing RMSE below 0.025 and relative error below 0.20 across a minimum 30-day validation window?
- What dimensionality reduction method does your BMS firmware use for multi-parameter feature extraction, and can you demonstrate that your method achieves M1 trustworthiness ≥97% and M2 continuity ≥98% on high-dimensional datasets including temperature, voltage, current, humidity, and acoustic noise simultaneously?
- Does your BMS health monitoring system implement a minimum 5-tier health index (H) with documented thresholds at H = 0.8, 0.6, 0.4, and 0.2, and does each tier trigger a distinct maintenance recommendation output to the EMS?
- In your BMS health prediction model, what is the training-to-validation data split used for time-series forecasting, and what is the documented prediction horizon (in days) over which your model maintains relative error below 0.20?
- What kernel parameter optimization method does your firmware use for RBF-based feature extraction, and can you show cross-validation deviation curves demonstrating the selected σ value minimizes reconstruction error across diverse station operating conditions, including PWM ripple interference from PCS converters?
Sourcing Checklist #
- [ ] BMS firmware implements a health index (H) calculated from reconstructed multi-dimensional sample data, with 5 discrete severity tiers mapped to H thresholds of 0.2, 0.4, 0.6, and 0.8
- [ ] Supplier can provide prediction accuracy test data showing average RMSE ≤ 0.025 and average relative error ≤ 0.20 validated against real station telemetry (not lab-synthesized datasets)
- [ ] Dimensionality reduction algorithm achieves M1 trustworthiness ≥ 97% and M2 continuity ≥ 98% on multi-parameter BMS data including at least 5 simultaneous measurement variables
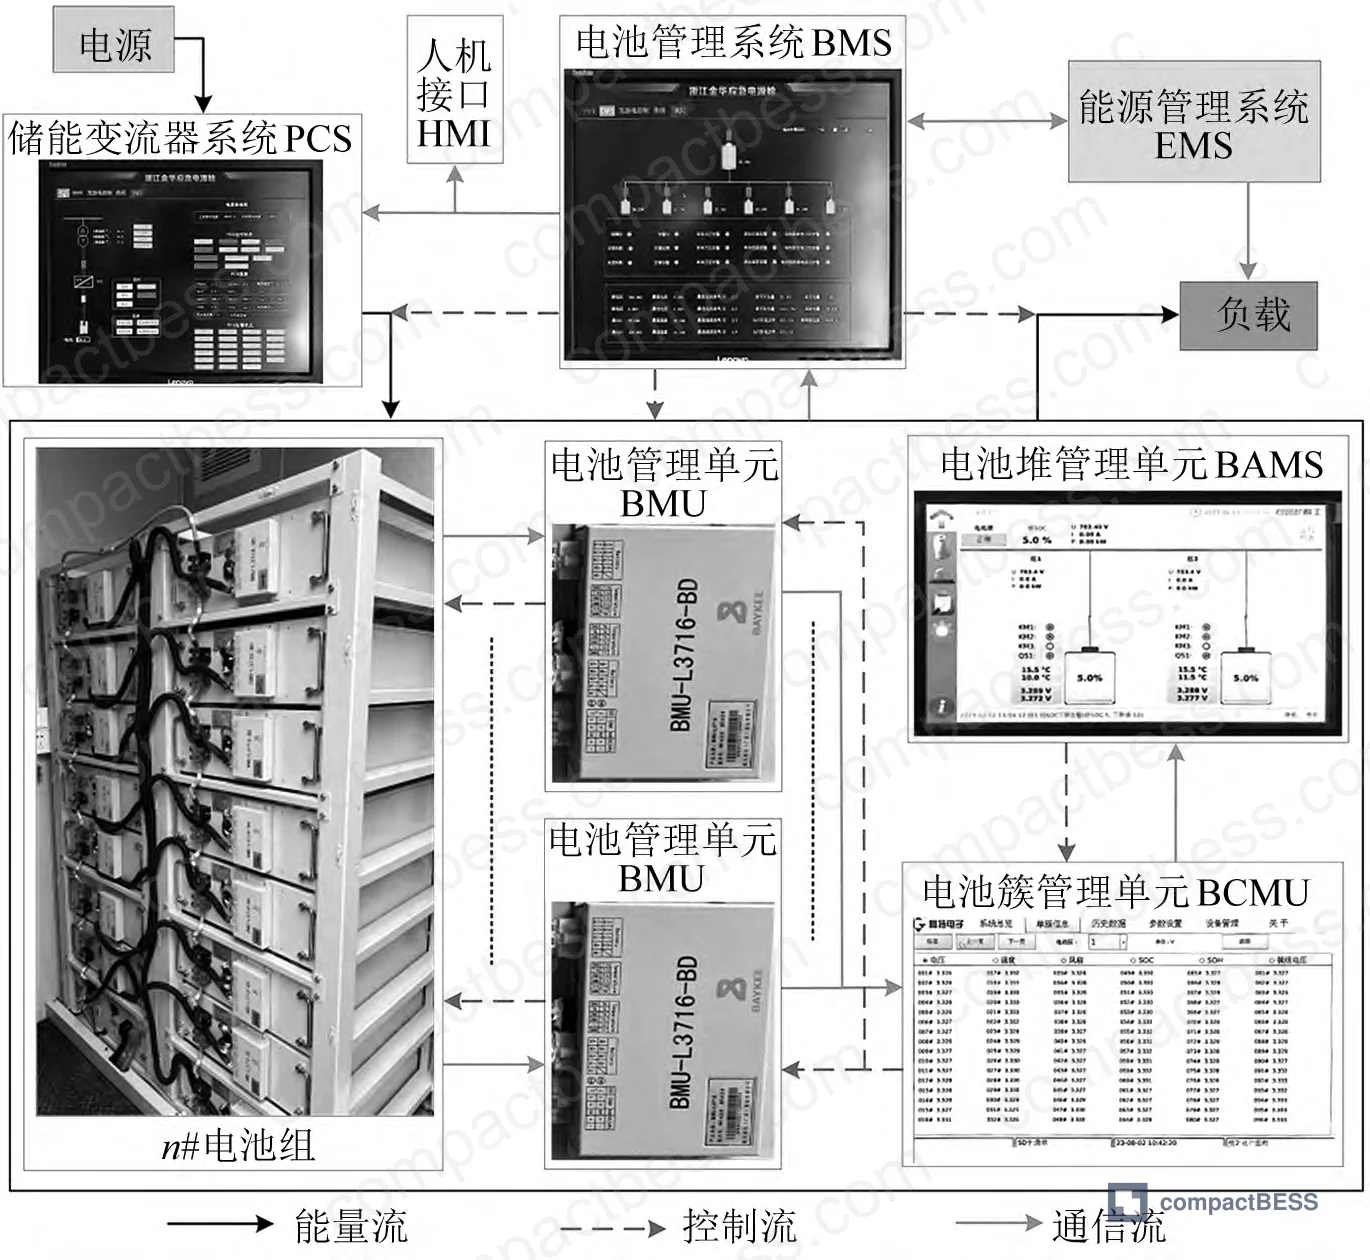
- [ ] BMS architecture supports multi-level hierarchy: Battery Management Unit (BMU), Battery Cluster Management Unit (BCMU), and Battery Array Management System (BAMS) per IEC 62619 structural requirements
- [ ] Health prediction model uses bidirectional or equivalent temporal sequence processing (not single-direction LSTM only), with documented improvement in RMSE over baseline single-direction model ≥ 40%
- [ ] BMS communication interface outputs health index data in a format readable by EMS/SCADA systems, with anomaly events logged per IEC 61850 or equivalent protocol
- [ ] Supplier can demonstrate EMI tolerance in BMS sensing circuits operating in environments with PWM ripple from co-located PCS converters — standard IEC 61000-4-8 or equivalent
- [ ] Product documentation includes a test report referencing a minimum 40-day continuous operation dataset from a grid-connected BESS deployment with ≥ 6 battery clusters per enclosure unit
Key Specifications Table #
| Parameter | Recommended Value | Verification Method |
|---|---|---|
| Health prediction RMSE (Bi-LSTM) | ≤ 0.025 average across all monitored BMS units | Submit 40-day telemetry validation report; check RMSE column per BMS unit |
| Health prediction relative error | ≤ 0.20 average across monitored units | Review supplier test report Table showing per-unit relative error values |
| Dimensionality reduction M1 trustworthiness | ≥ 97.15% | Request cross-validation benchmark results comparing reduction methods |
| Dimensionality reduction M2 continuity | ≥ 98.73% | Validate against supplier’s published algorithm comparison data |
| Health index tier thresholds | Grade 1: H > 0.8 / Grade 2: 0.6–0.8 / Grade 3: 0.4–0.6 / Grade 4: 0.2–0.4 / Grade 5: H < 0.2 | Confirm in firmware documentation; trigger EMS alert log per tier |
| Prediction model training-to-validation ratio | Minimum 75% training / 25% validation on time-series data | Audit model training documentation; verify against actual station dataset |
Can’t find a supplier meeting these specs? Submit your requirements and we’ll match you within 48 hours.
Frequently Asked Questions #
Q: What is the health index (H) and how is it different from standard BMS state-of-health (SoH)?
Standard SoH tracks the remaining capacity of the battery cells themselves — it tells you how degraded your cells are. The health index H described here is different: it measures the health of the BMS device, not the batteries it monitors. H is calculated from reconstructed BMS telemetry data, normalized to 0–1, and classified into 5 operational tiers ranging from stable operation (H > 0.8) to complete device failure (H < 0.2). This distinction matters because a BMS with degraded sensors or communication interfaces will give you incorrect SoH readings — compounding both errors simultaneously if only cell-level SoH is tracked.
Q: Why does Bi-LSTM outperform standard LSTM for BMS health prediction?
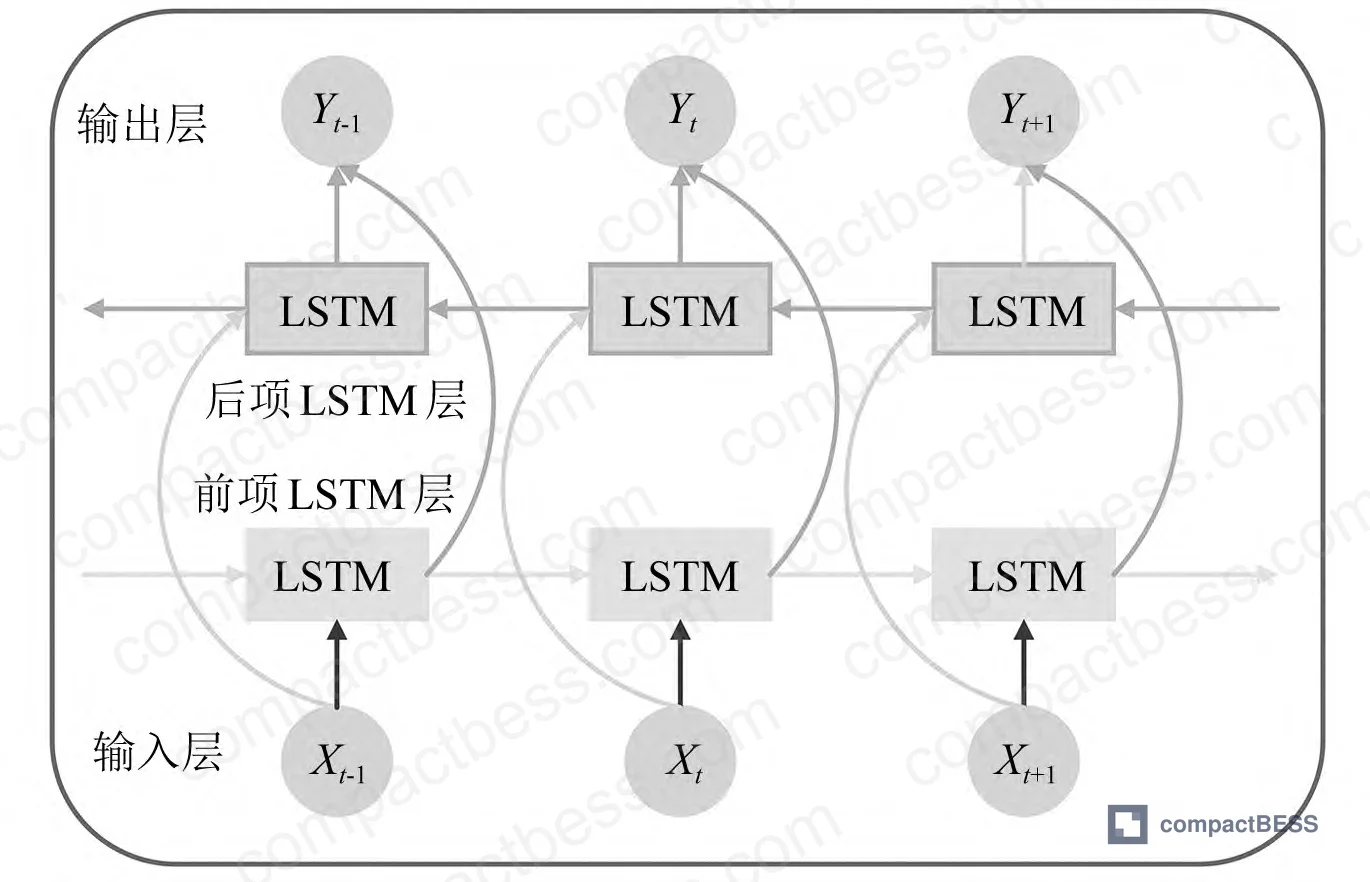
Standard LSTM processes time-series data in one direction — forward through time. Bi-LSTM processes the same sequence both forward and backward simultaneously, allowing the model to use future context to refine its interpretation of past states. For BMS health data, which exhibits complex temporal correlations (a sensor anomaly at T+2 can recontextualize an ambiguous reading at T-1), this bidirectional context improves prediction accuracy significantly. The validated improvement across four BMS units was 56.33% reduction in RMSE and 42.86% reduction in relative error.
Q: What data inputs does the BMS health assessment system require?
The system processes multi-parameter telemetry including per-cluster current, PCS rectifier noise, ambient temperature and humidity, and equipment acoustic noise — collected from each battery enclosure’s BMS interface. The raw data matrix is m-dimensional per sample, with N total samples. The cross-validated RBF kernel PCA then reduces this to a lower-dimensional feature space retaining cumulative eigenvalue contribution ≥ 90% before the Bi-LSTM prediction layer receives the processed features.
Q: How early can the system detect a BMS degradation event before failure?
In the BMS4 case from the 40-day field study, the health index began showing anomalous behavior from the very first observation period, with H dropping below 0.4 (Grade 4 fault state) by Day 12. The Bi-LSTM prediction model, trained on the first 30 days, was able to project the degradation trajectory for the final 10 days with a relative error of 0.19. In practical terms, this means the system can give maintenance teams at minimum a 7–10 day forward window to plan intervention before a fault escalates to Grade 5.
Q: Which international standards govern BMS safety and communication in grid-scale BESS?
The primary safety standard for stationary lithium-ion battery systems is IEC 62619, which covers safety requirements for cells and modules in stationary applications. Communication and data integration is governed by IEC 61850 for substation automation and UN 38.3 covers transport safety. For buyers in North America, UL 9540 applies to energy storage system safety, while European deployments must address the EU Battery Regulation 2023/1542 requirements for battery management data transparency and durability reporting.
Published by compactbess.com Technical Team | Request a sourcing quote
Data source: Intelligent Health Assessment and Early Warning of Battery Management Systems in Grid-Scale Energy Storage Stations Using Optimized Kernel Principal Component Analysis and Bidirectional LSTM Networks, H. Liu et al., Journal of the Electrochemical Society, 2024


