

TL;DR #
When BMS-collected operating data contains fragmented charge/discharge segments — which it almost always does in real grid storage deployments — a gradient-descent-based splicing and reconstruction method enforcing a current differential threshold of ≤5 A, voltage continuity of ≤0.005 V, and voltage rate-of-change matching of ≤0.0001 V/s at splice points can reassemble disconnected data fragments into complete, continuous curves suitable for SOH estimation. For buyers sourcing BMS modules or energy storage integrators selecting a data analytics platform, this means that raw BMS data quality is rarely adequate for SOH or RUL algorithms out of the box — and any supplier claiming high-accuracy state estimation without describing their data preprocessing pipeline should be pressed hard on exactly this point. Before approving a BMS design or data-driven SOH platform, require the supplier to demonstrate end-to-end performance on fragmented field data, not just clean laboratory charge/discharge curves.
Overview #
The question most procurement engineers should be asking before they approve a BMS platform is not “what algorithm does it use for SOH?” but “what does it do with the incomplete, fragmented data that real-world storage stations actually produce?” That reframe matters enormously, and it is underappreciated in almost every RFQ process I have seen.
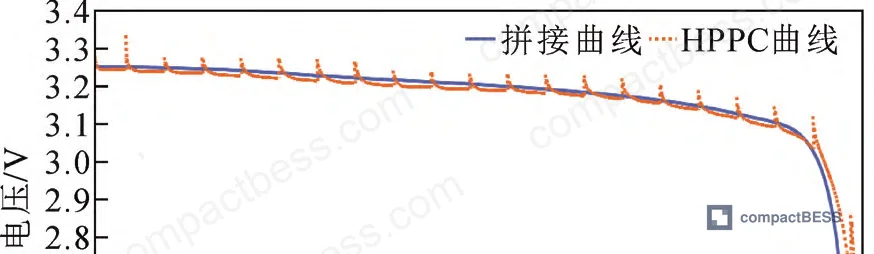
Recent experimental work from a national key laboratory specializing in renewable energy grid integration addressed this directly. Researchers ran controlled validation tests on 280 Ah lithium-ion cells at 0.5C discharge (140 A) using HPPC protocols, then followed up with constant-current charge testing on 75 Ah cells at 0.2C. Both experimental datasets were deliberately fragmented into randomized segments and then reconstructed using the proposed method to verify accuracy. Field validation extended further to a live grid storage station operating under both peak-shaving and frequency-regulation duty cycles — arguably the two most demanding and data-fragmenting real-world use cases for a storage BMS.
The core insight is that standard BMS data pipelines treat each charge or discharge segment in isolation. That is fine for real-time protection functions. It is inadequate for any algorithm — incremental capacity analysis (ICA), Coulomb counting correction, equivalent circuit model fitting — that needs a complete, continuous charge or discharge curve to function accurately.
Why BMS Operating Data Is Structurally Fragmented — and Why This Breaks SOH Estimation #
This is the root problem that most BMS buyers either don’t fully appreciate or discover too late in the product qualification cycle.
In real grid storage deployments, a complete charge or discharge cycle is almost never recorded as one continuous data stream. Electricity pricing, grid dispatch commands, demand response events, and thermal management interventions all interrupt charge/discharge sequences. Each interruption creates a new data segment with its own timestamp origin, potentially different sampling frequency, and a different cumulative capacity reference. The BMS logs all of these faithfully — but as disconnected fragments, not as a coherent cycle.
Field data from a domestic peak-shaving storage station demonstrated this concretely: cell capacity was 271 Ah, operating current 135 A (0.5C), and data fragments had durations ranging from 100 s to 1,220 s with SOC spanning 41% to 83% across collected segments. That kind of variability makes direct concatenation — just stacking one segment after another — produce voltage and capacity discontinuities that will corrupt any downstream SOH algorithm.
The transient problem compounds this. Every time a cell switches between charging, discharging, and rest, it passes through a transient phase during which voltage is temporarily displaced from its steady-state value. Statistical analysis of HPPC test data quantified this: transient durations ranged from a minimum of 61 s to a maximum of 96 s, with a mean of 79.82 s. Using data from within this transient window introduces systematic error into the spliced curve. The method’s boundary condition requires that the time elapsed after any operating mode transition satisfies T ≥ T_max (96 s) before any fragment is eligible for splicing — meaning the first 96 seconds after every operating mode change must be discarded.
| Transient Duration Parameter | Value |
|---|---|
| Minimum transient duration | 61 s |
| Mean transient duration | 79.82 s |
| Maximum transient duration | 96 s |
| Required wait before splicing | ≥ 96 s (T_max) |
| Current differential threshold at splice point | ≤ 5 A |
| Voltage differential threshold at splice point | ≤ 0.005 V |
| Voltage rate-of-change differential at splice point | ≤ 0.0001 V/s |
Honestly, most buyers over-specify the SOH algorithm itself — neural networks, extended Kalman filters, Gaussian process regression — while giving almost no specification requirements to the data quality layer that feeds those algorithms. A sophisticated model running on fragmented, untreated BMS data will consistently underperform a simpler model running on properly reconstructed data.
Boundary Conditions for Splice-Point Validation in Lithium-Ion Storage BMS #
The method establishes three hard quantitative constraints that must be simultaneously satisfied at any splice point. All three matter — satisfying two of three is not acceptable.
Current continuity: The absolute difference between the final current value of the preceding fragment and the initial current value of the following fragment must not exceed 5 A. This is the first gate. Current amplitude directly reflects actual cell operating state, and a mismatch above this threshold produces discontinuities in voltage and cumulative capacity that cascade through subsequent calculations.
Voltage continuity: The voltage difference at the splice point must be ≤ 0.005 V. Individual cell voltage is the single most discriminating indicator of cell-level operating state in a string — current is often identical across cells in series and thus uninformative at the cell level. A 5 mV tolerance was derived empirically from large-scale experimental and statistical analysis.
Voltage rate-of-change continuity: The difference in voltage slope (dU/dt) at the splice point must be ≤ 0.0001 V/s. This is the tightest constraint and the one most commonly missed in simpler concatenation approaches. Rate-of-change continuity ensures smooth curve transition and prevents error accumulation that compounds across multiple splice points in a long reconstructed sequence.
Cumulative capacity conservation: The cumulative charge/discharge capacity at the splice point must satisfy Cfrontend − Cbackstart = 0. This enforces energy conservation across the splice — non-zero residuals at this check indicate that the two fragments are not compatible for splicing regardless of whether voltage and current thresholds are met.
The gradient descent optimizer iteratively minimizes the loss function across all data points in the fragment collection, solving for the optimal boundary value p at the splice point. Learning rate α and iteration count t are tunable parameters that affect convergence behavior on different cell chemistries and operating histories.
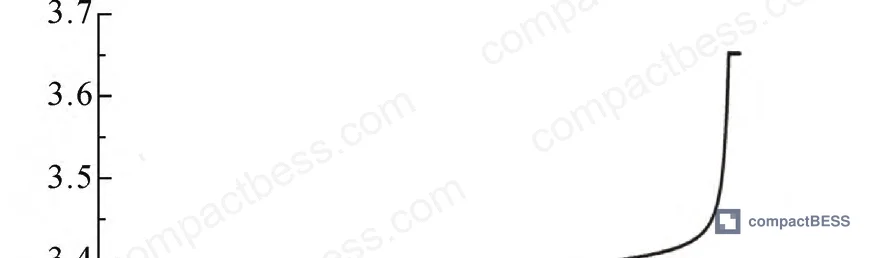
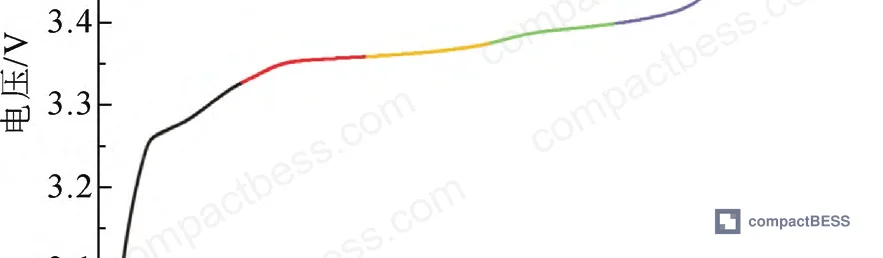
In supplier qualification, we have seen data preprocessing pipelines that apply only current-threshold checking and skip the voltage rate-of-change constraint entirely. Every one of those systems produced reconstructed curves that looked visually continuous but introduced slope discontinuities that generated spurious peaks in ICA analysis — peaks that were then incorrectly interpreted as degradation signatures.
SOH Estimation via ICA on Reconstructed Data: Engineering Application #
The real payoff of data reconstruction is not the cleaned curve itself — it is what becomes possible downstream.
Incremental capacity analysis (ICA) requires a smooth, complete charge curve to generate meaningful dQ/dV peaks. In fragmented BMS data, those peaks either disappear or appear at incorrect voltages. After reconstruction, the ICA workflow becomes tractable for field-deployed systems:
- Reconstruct fragmented charge/discharge data for each cycle stage into a complete continuous curve
- Re-apply data cleaning to remove any residual noise introduced during reconstruction
- Plot the initial ICA curve, identify the voltage at peak 2 (defined as u₁), and identify the cutoff voltage (u₂)
- Track the ICA peak voltage and area changes across cycles to estimate capacity fade
- Correlate peak position and area shifts against the initial reference curve to compute SOH
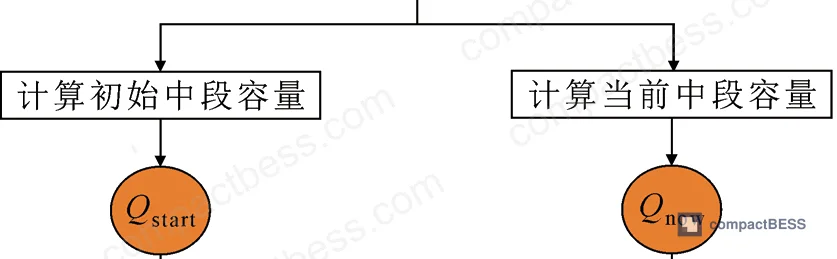
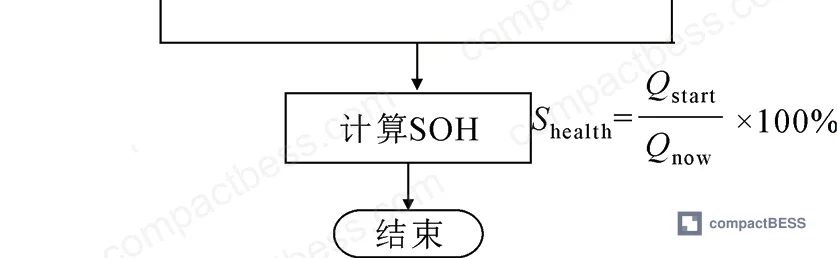
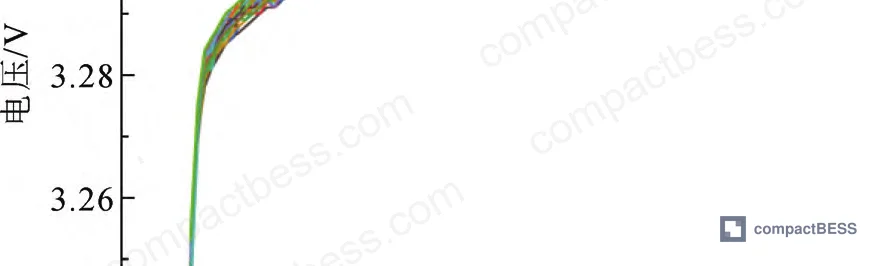
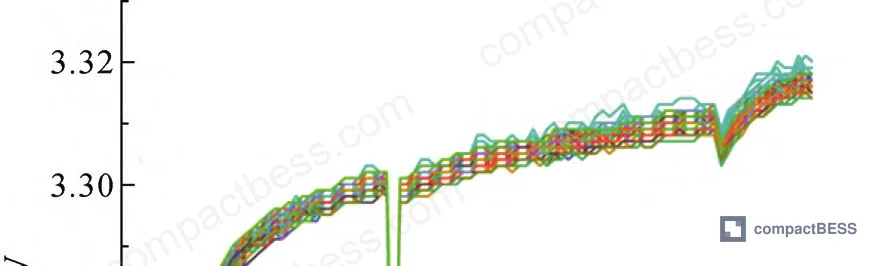
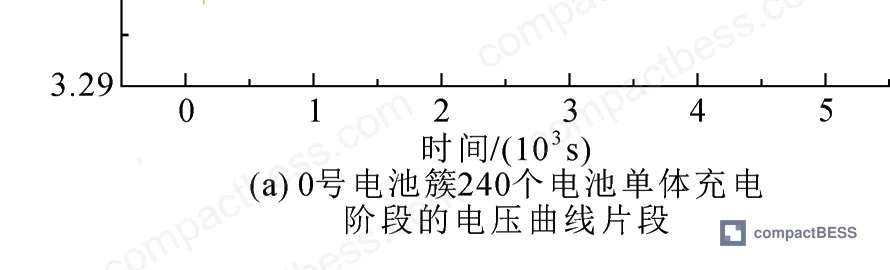
Field validation on a frequency-regulation storage station used battery cluster No. 1, comprising 240 individual cells with 271 Ah nominal capacity each, operating at 10 A current. The reconstruction method successfully assembled fragmented frequency-regulation operating data into complete charge/discharge profiles across all 240 cells — a scale that confirms the method’s engineering viability in production BMS deployments.
Most procurement teams don’t realize that ICA-based SOH methods — which are referenced extensively in IEC 62619 industrial battery safety standards and increasingly in grid storage procurement specifications — are effectively disabled by fragmented data unless a reconstruction preprocessing layer is in place. The standard assumes the data is there. The method to get the data is left to the implementer.
Practical Guidance for Buyers #
If you are sourcing a BMS platform for a grid-scale lithium-ion storage application — whether peak-shaving, frequency regulation, or backup power — the data preprocessing architecture deserves as much scrutiny as the state-estimation algorithm. Ask specifically: does the BMS have a splice-point validation layer, and what are the numeric thresholds it applies?
The minimum viable data quality layer should enforce all of the following simultaneously: current differential ≤5 A, voltage differential ≤0.005 V, voltage rate-of-change differential ≤0.0001 V/s, cumulative capacity continuity at splice points, and automatic discard of data from the first 96 seconds after any operating mode transition. Suppliers who cannot answer these questions with specific numbers are almost certainly applying simple concatenation or no preprocessing at all — and their SOH accuracy claims on field data should be treated with skepticism.
For buyers integrating third-party SOH platforms with existing BMS hardware, the same logic applies to the data pipeline between the two systems. OCV reconstruction accuracy in the literature has been demonstrated at a mean absolute error below 20 mV for short charging segments (up to 1,000 s), and capacity estimation error below 1.3% — but only when data completeness conditions are met upstream.
At compactbess.com, our sourcing team works with verified Chinese manufacturers of BMS modules, cell packs, and energy storage management platforms — and we can help you identify suppliers who have documented data preprocessing pipelines, not just SOH algorithm marketing materials. Our clients span grid integrators in Europe, utility procurement teams in the Middle East, and OEM developers in North America who need suppliers capable of providing this level of engineering transparency.
Need help identifying qualified suppliers for BMS modules with documented SOH data preprocessing? Talk to our sourcing team →
Supplier Qualification Questions #
- What is your BMS’s current differential threshold at data splice points, and is it enforced at ≤5 A as required by transient-state analysis of lithium-ion storage behavior? Provide the specific parameter value in your firmware documentation.
- What voltage continuity tolerance does your data reconstruction pipeline enforce at splice points — specifically, is the voltage differential constraint ≤0.005 V, and how is this validated against HPPC or RPT test data?
- Can you provide HPPC test results for your battery cells showing transient duration statistics (minimum, mean, and maximum), and does your data pipeline automatically exclude segments within the first 96 seconds after an operating mode transition?
- For a 75 Ah cell at 0.2C constant-current charge, what is the RMSE, MAE, and R² of your reconstructed voltage curve versus the original reference curve when the original is split into 5 randomly distributed fragments?
- Does your SOH estimation pipeline include an ICA (incremental capacity analysis) stage, and if so, how does it handle fragmented charge data from frequency-regulation or peak-shaving duty cycles where continuous charge curves are rarely available in the raw BMS log?
Sourcing Checklist #
- [ ] BMS firmware enforces current differential ≤5 A at all data splice points, with the threshold value documented in the firmware specification sheet
- [ ] BMS data pipeline enforces voltage continuity ≤0.005 V and voltage rate-of-change differential ≤0.0001 V/s at splice points simultaneously (not just one of the two)
- [ ] Data preprocessing automatically excludes transient-phase data, with a minimum discard window of ≥96 s following any charge/discharge/rest mode transition
- [ ] Supplier can provide HPPC test validation data for their target cell (e.g., 280 Ah or equivalent capacity class) showing reconstructed vs. original discharge voltage curve with quantified error metrics (RMSE, MAE, or R²)
- [ ] Cumulative capacity conservation is enforced at splice points (Cfrontend − Cbackstart = 0), ensuring energy balance integrity across reconstructed data sequences
- [ ] SOH estimation algorithm (ICA or equivalent) has been validated on reconstructed field data — not only on clean laboratory charge/discharge cycles — with results from at least one real operating condition (peak-shaving or frequency-regulation)
- [ ] System has been tested at the cell cluster scale (≥100 cells) under frequency-regulation conditions, with documentation showing per-cell voltage curve reconstruction performance
- [ ] BMS complies with IEC 62619:2022 for industrial lithium-ion battery safety and GB/T 34131 for electrochemical energy storage BMS requirements
Key Specifications Table #
| Parameter | Recommended Value | Verification Method |
|---|---|---|
| Current differential at splice point | ≤ 5 A | Compare final current of preceding fragment vs. initial current of following fragment; verify in HPPC or RPT test log |
| Voltage differential at splice point | ≤ 0.005 V | Direct comparison of fragment endpoint voltages in reconstructed curve vs. reference; MAE calculation |
| Voltage rate-of-change differential at splice point | ≤ 0.0001 V/s | Numerical differentiation of voltage time-series at splice boundary; slope continuity check |
| Minimum post-transition discard window (transient exclusion) | ≥ 96 s | Statistical validation against HPPC transient duration data (min 61 s, mean 79.82 s, max 96 s) |
| Cumulative capacity continuity at splice point | Δ C = 0 (exact) | Energy balance check: Cfrontend − Cbackstart must equal zero before splice is accepted |
| OCV reconstruction mean absolute error | < 20 mV (for segments up to 1,000 s) | Comparison against full OCV curve measured under controlled conditions |
| Capacity estimation MAPE after reconstruction | < 1.3% | Coulomb counting on reconstructed curve vs. reference capacity measurement |
| Field data SOC operating range coverage | 41–83% (peak-shaving baseline) | Verified against actual storage station operating logs under peak-shaving dispatch |
Can’t find a supplier meeting these specs? Submit your requirements and we’ll match you within 48 hours.
References #
Data source: Splicing and Reconstruction of Fragmented Operating Data for Lithium-Ion Energy Storage Batteries Using Gradient Descent Optimization, L. Zhao et al., Journal of the Electrochemical Society, 2024
Frequently Asked Questions #
Why does BMS operating data end up fragmented in real grid storage deployments?
Grid storage systems — whether operating in peak-shaving or frequency-regulation mode — are subject to continuous dispatch interruptions from grid operators, thermal management events, and pricing-driven partial cycles. Each interruption creates a new data segment with its own timestamp and cumulative capacity reference. The result is that a BMS may log dozens of disconnected fragments for what should be a single charge or discharge cycle, making direct use of the data in SOH algorithms essentially impossible without preprocessing.
What happens if you skip transient-phase exclusion and splice data immediately after an operating mode change?
The voltage at the splice point will reflect the transient displacement rather than the steady-state cell response. This introduces a systematic error into the reconstructed curve that cascades into all downstream calculations — ICA peak positions shift, capacity estimates drift, and SOH outputs become unreliable. The 96-second minimum exclusion window is an empirically derived lower bound from statistical analysis of HPPC transient data; using a shorter window increases reconstruction error.
Is this method applicable to BMS deployments where cells are configured in large series-parallel strings?
Yes, and the cell-level voltage constraint is specifically why voltage continuity is a stricter gating criterion than current continuity in this method. In series-parallel strings, cell current values are often mathematically identical and carry no per-cell state information. Individual cell voltage, by contrast, is the most discriminating available indicator of cell-specific condition. The method was validated at the scale of 240 individual cells in a single battery cluster under frequency-regulation conditions, confirming applicability beyond single-cell laboratory environments.
What optimization algorithms can be used in the curve smoothing step after initial splicing?
The method supports three post-splice optimization tracks: mathematical/physical/electrochemical model-based correction (including particle filter, Kalman filter, RC equivalent circuit, and ICA methods), machine learning optimization (SVM, ANN, XGBoost, random forest trained on historical operating data), and incremental learning approaches (online SVM, incremental decision trees, incremental deep learning) that update the smoothing model parameters continuously as new field data accumulates. The choice depends on available historical data volume and real-time computational resources in the BMS hardware.
How does this preprocessing approach relate to SOH estimation accuracy under IEC 62619 or UN 38.3 compliance frameworks?
IEC 62619:2022 and UN 38.3 establish safety and performance requirements for lithium-ion batteries but do not prescribe internal BMS data processing methods. SOH estimation accuracy is an application-layer concern above the compliance layer. However, procurement specifications for grid storage projects increasingly reference SOH accuracy thresholds that can only be achieved with proper data preprocessing — so while the standard doesn’t require this method, meeting project-level SOH performance guarantees in real operating conditions effectively demands it. Buyers should specify SOH accuracy requirements in their RFQ against field-data conditions, not just laboratory test conditions, and ask suppliers to confirm whether their BMS includes a validated data reconstruction layer. For further context on BMS design requirements, see our BMS Communication Protocols guide and the SOC/SOH Estimation Methods overview.
Published by compactbess.com Technical Team | Request a sourcing quote


