

TL;DR #
A field evaluation of 18 battery storage units across a 40-day operational window showed that BMS4 deteriorated to a health index below 0.4 by day 12 — a fault state requiring full shutdown and component replacement. For buyers procuring BMS modules for grid-scale or commercial BESS installations, this means the health monitoring algorithm embedded in the BMS is not a secondary feature: it is a primary safety qualification criterion. Before issuing any RFQ, require suppliers to demonstrate a multi-tier health index system with documented early-warning thresholds and time-series prediction capability.
Overview: Why BMS Health Monitoring Should Be a Hard Procurement Requirement #
Most procurement specs for battery energy storage systems focus on cell chemistry, capacity, and cycle life. The BMS gets a footnote. That’s a mistake that shows up later — sometimes catastrophically.
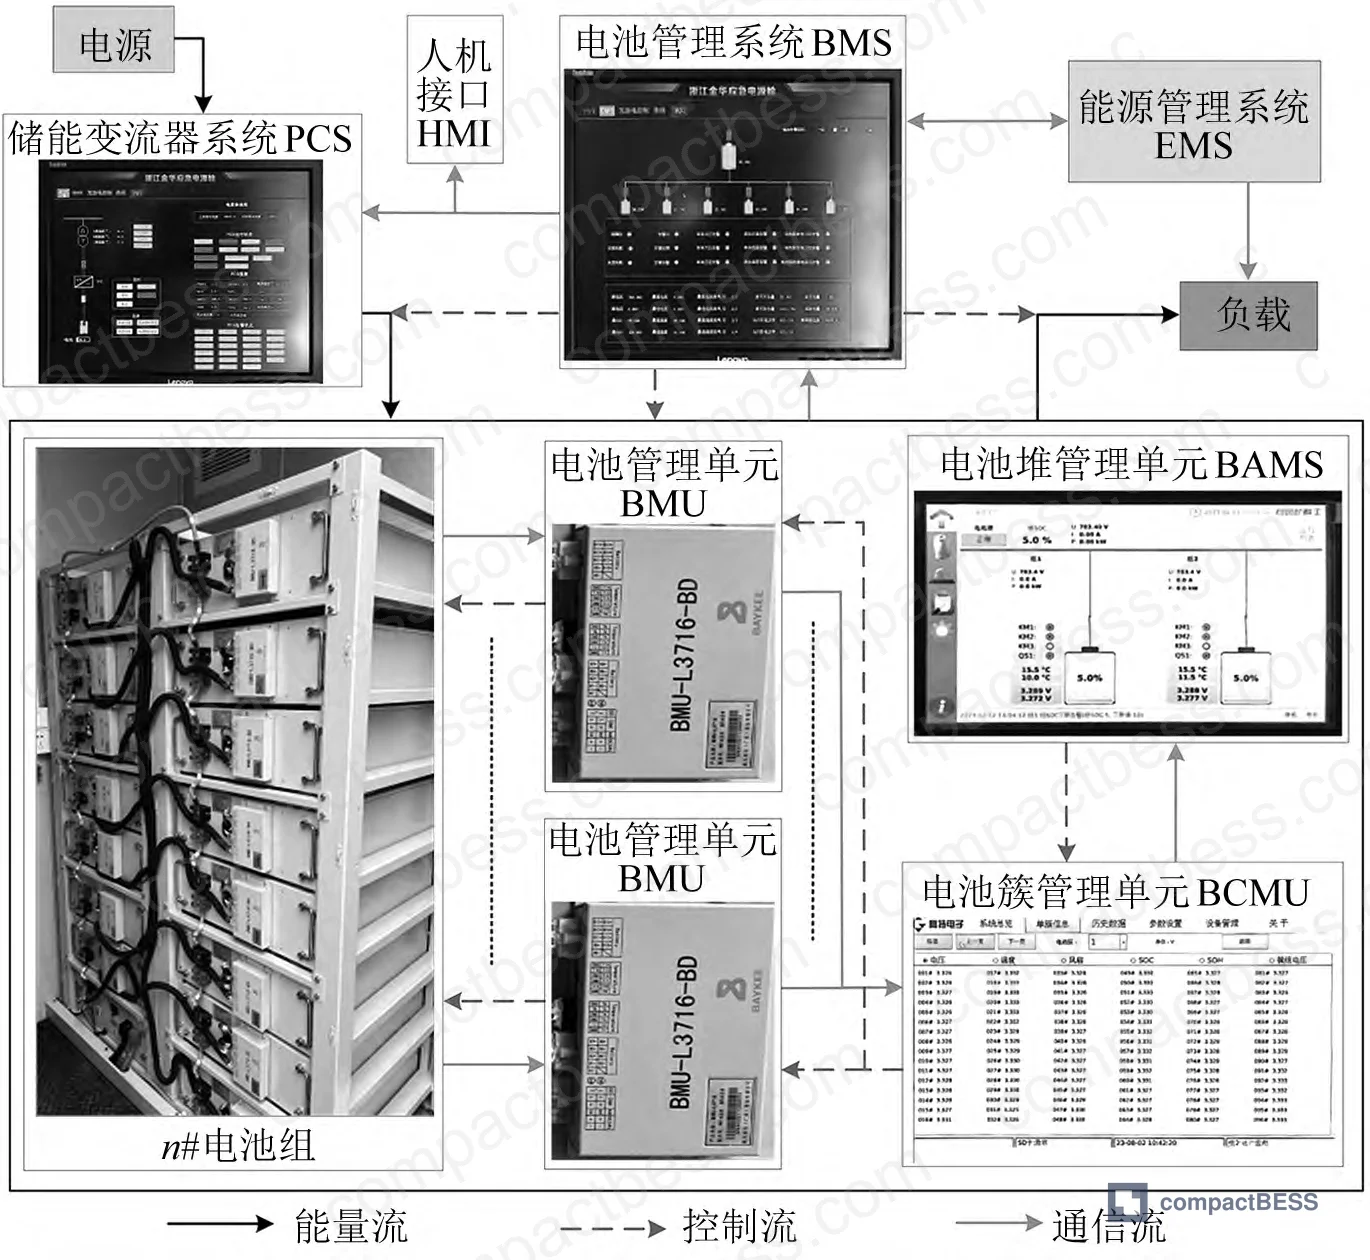
Field data from a real-world grid-connected storage station running 18 containerized storage units (each with 6 battery clusters, 15 cells per cluster, and 4 temperature sensors per cell) gives a clear picture of what happens when BMS health degrades silently. The study tracked continuous operational data over 40 days, capturing voltage, current, temperature, humidity, and acoustic noise signals. What the data revealed is that three of four representative BMS units showed measurable health deterioration — and in one case, the unit entered fault state within 12 days of initial monitoring.
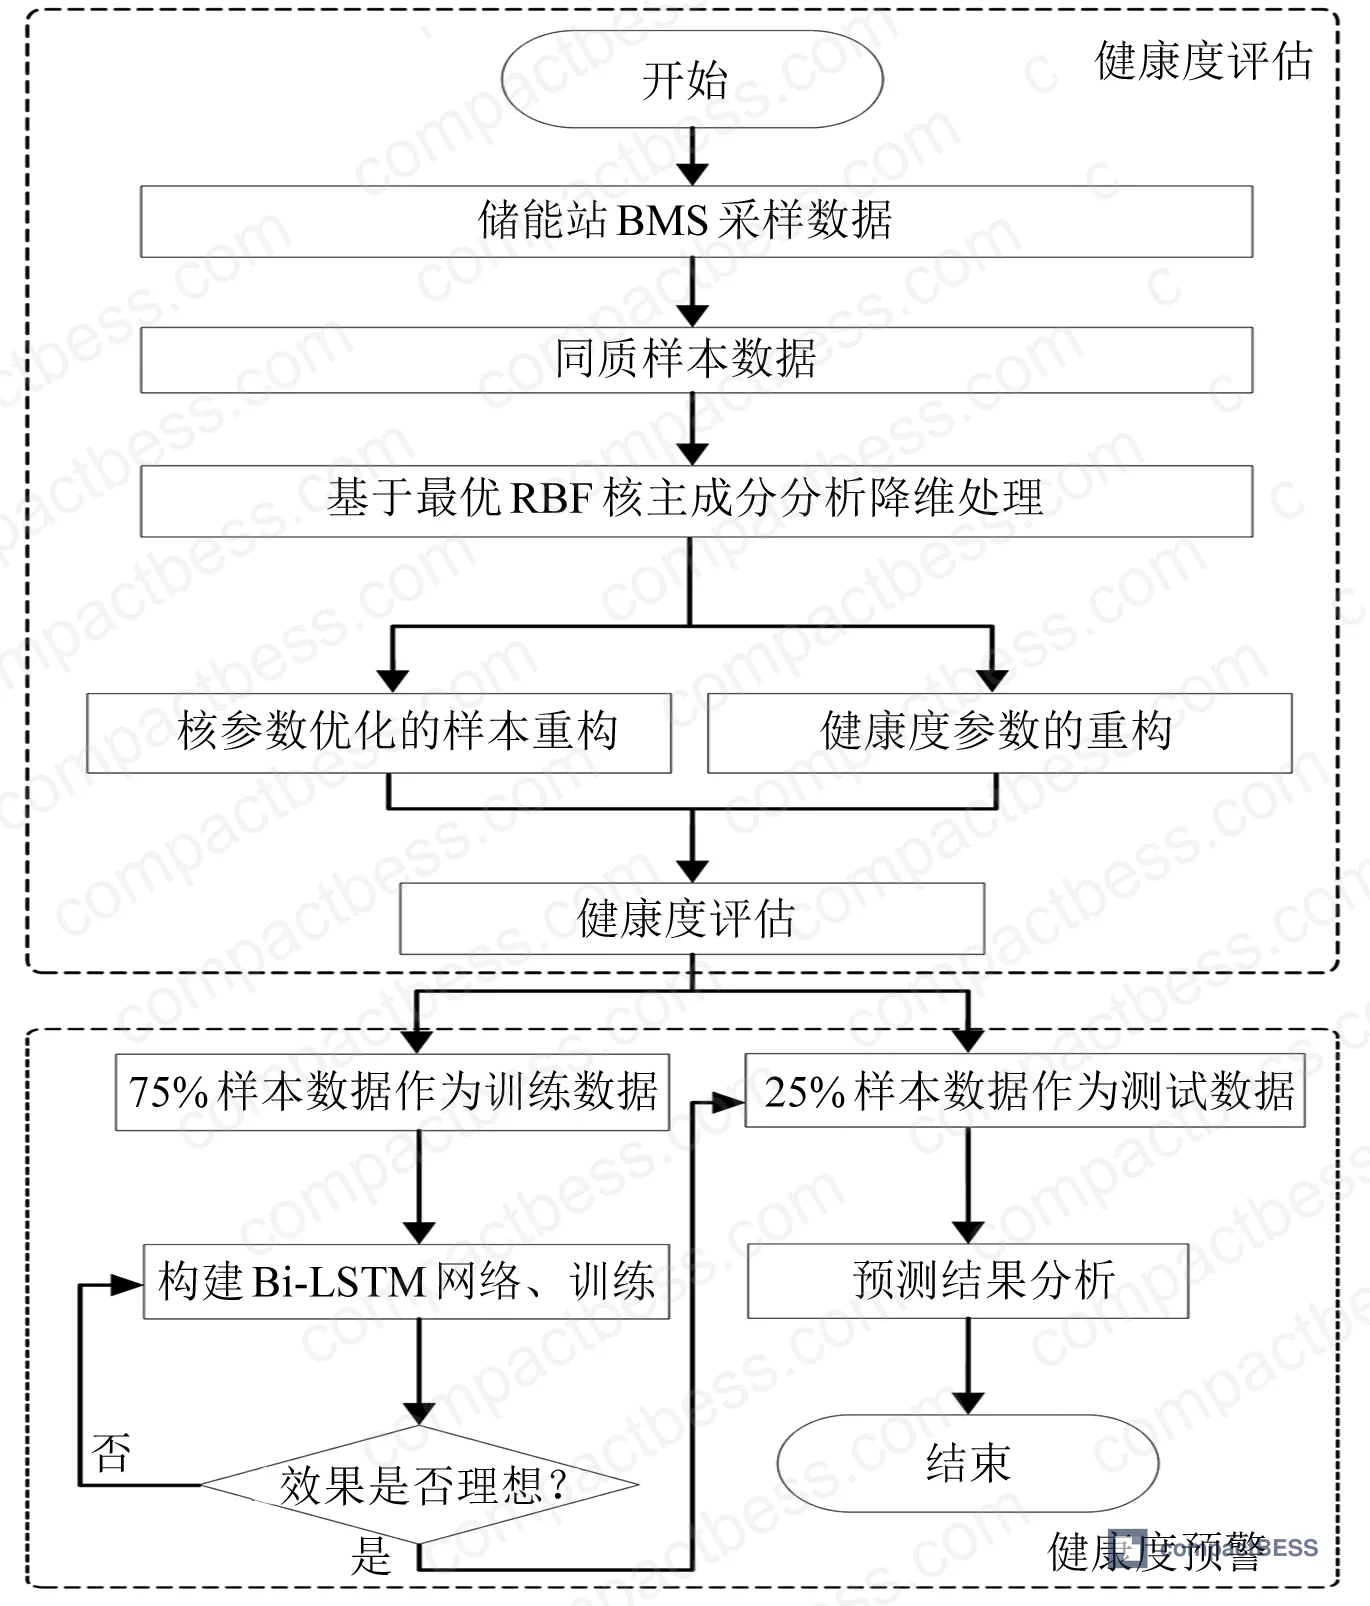
The methodology used RBF kernel principal component analysis combined with bidirectional LSTM neural networks to extract nonlinear features from high-dimensional BMS monitoring data and predict health trajectories. The cross-validation approach for optimal kernel parameter selection achieved data reliability scores (M₁) of 97.19% and continuity scores (M₂) of 97.46% — outperforming standard kernel PCA methods by 1.88 and 2.77 percentage points respectively.
This is not academic. These numbers translate directly into whether your BMS catches a failing sensor before it causes overcharge, or misses it and you’re replacing a pack six months early.
BMS Health Index Grading: What the Five-Level Framework Means for BESS Procurement #
The research defines a quantitative health index H ranging from 0 to 1, with five operational grades. This is the spec table you should be asking your BMS supplier to map their firmware against.
| Health Grade | H Value Range | Operational Status | Recommended Action |
|---|---|---|---|
| Grade 1 | 0.8 < H ≤ 1.0 | Stable operation | No intervention required |
| Grade 2 | 0.6 < H ≤ 0.8 | Minor anomaly (external environment) | Monitor, schedule preventive maintenance |
| Grade 3 | 0.4 < H ≤ 0.6 | Abnormal operation (electrical equipment fault) | Arrange inspection, halt non-critical load |
| Grade 4 | 0.2 < H ≤ 0.4 | Fault state (device body failure) | Shut down all equipment, repair/replace |
| Grade 5 | 0 < H ≤ 0.2 | Device failure | Full inspection of all equipment |
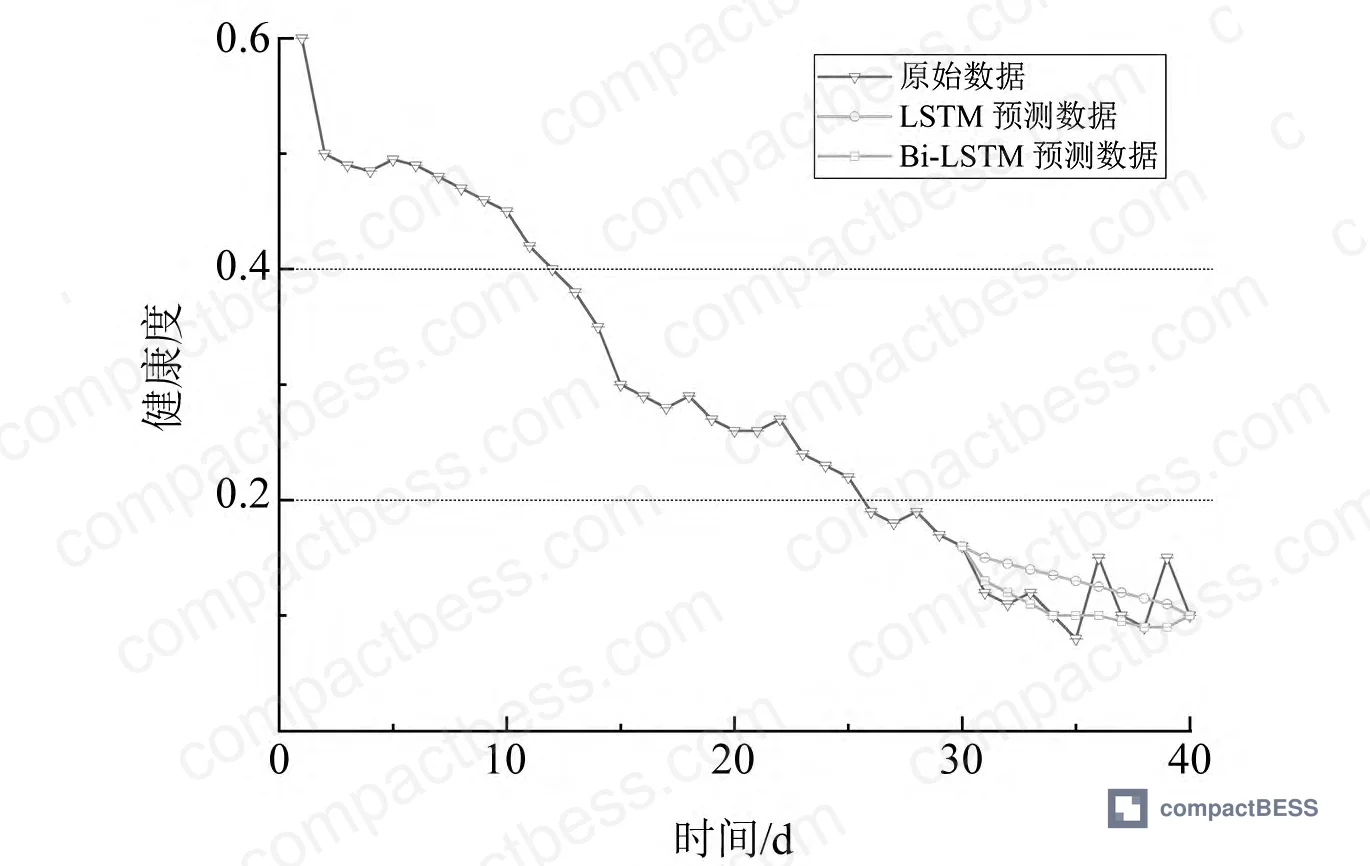
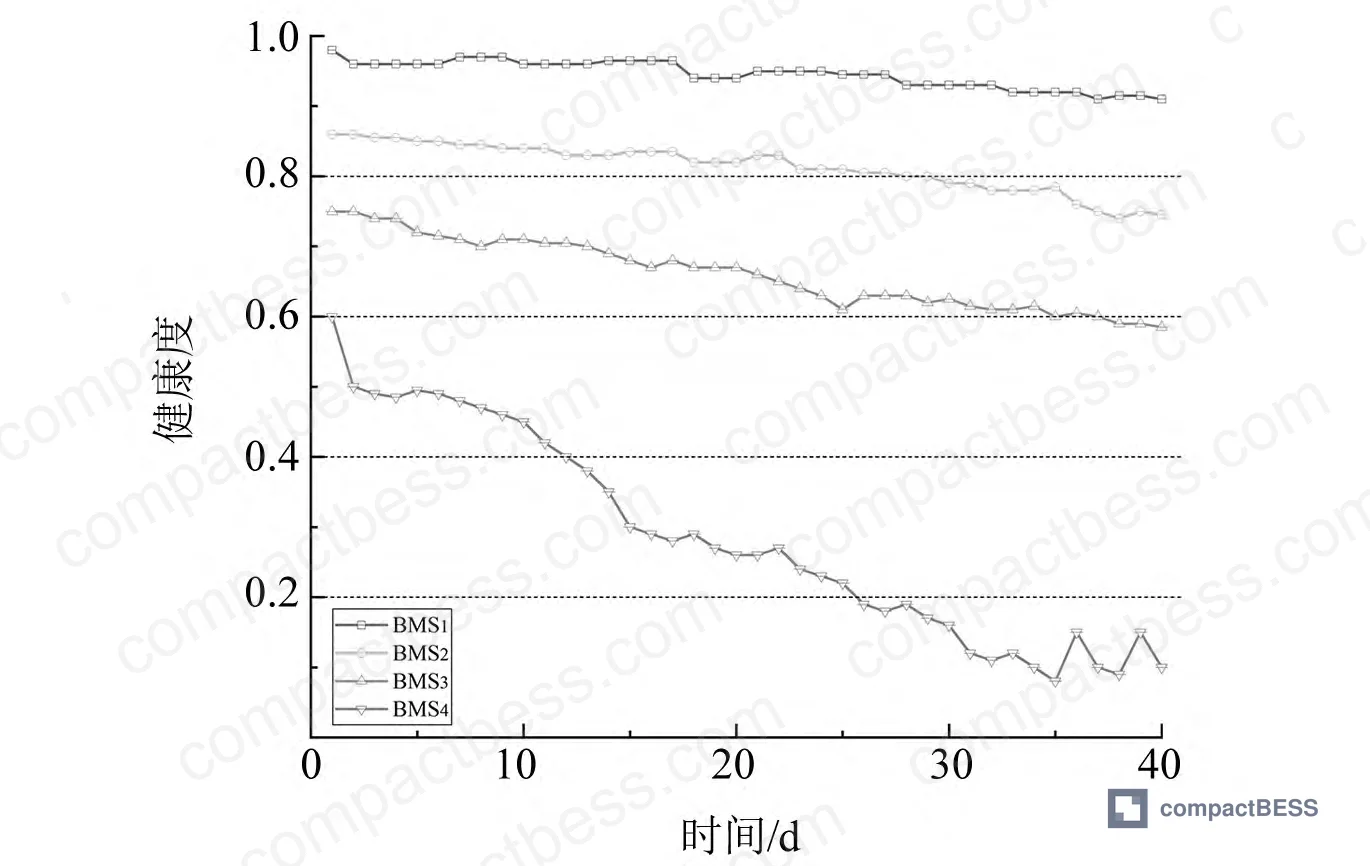
In the 40-day field trial, BMS1 held stable above H = 0.9 throughout the observation window. BMS2 crossed below H = 0.8 around day 30 — technically entering Grade 2, requiring attention but not emergency action. BMS3 dropped below H = 0.6, trending downward, indicating electrical equipment fault. BMS4 was the critical case: health index fell below 0.4 by day 12, with data showing high-amplitude oscillations consistent with device body failure.
The system that detected the physical fault — a thermal detection instrument — confirmed the anomaly on day 19 of the monitoring window. The algorithm called it first, by a full week.
Honestly, most buyers over-specify cell-level protection thresholds while ignoring whether the BMS itself has any self-diagnostic capability. A BMS that monitors the battery perfectly but cannot assess its own sensor degradation is a single point of failure at the system level.
Bi-LSTM Prediction Performance: Where Standard LSTM Falls Short in BESS Applications #
The comparison between standard LSTM and Bi-LSTM prediction models on the same 40-day dataset is worth examining in detail, because it directly informs what you should demand from a “smart BMS” supplier.
| Model | BMS Unit | RMSE (E_RMS) | Relative Error (E_R) |
|---|---|---|---|
| Standard LSTM | BMS1 | 0.0352 | 0.27 |
| Bi-LSTM | BMS1 | 0.0133 | 0.15 |
| Standard LSTM | BMS2 | 0.0376 | 0.29 |
| Bi-LSTM | BMS2 | 0.0156 | 0.17 |
| Standard LSTM | BMS3 | 0.0318 | 0.24 |
| Bi-LSTM | BMS3 | 0.0112 | 0.12 |
| Standard LSTM | BMS4 | 0.0439 | 0.31 |
| Bi-LSTM | BMS4 | 0.0248 | 0.19 |
| Average | — | 0.0371 / 0.28 | 0.0162 / 0.16 |
The Bi-LSTM model reduced average RMSE by 56.33% and average relative error by 42.86% compared to standard LSTM across all four BMS units. The training configuration used 500 iterations with a learning rate of 0.005, applied to the first 30 days of data to predict the final 10-day window.
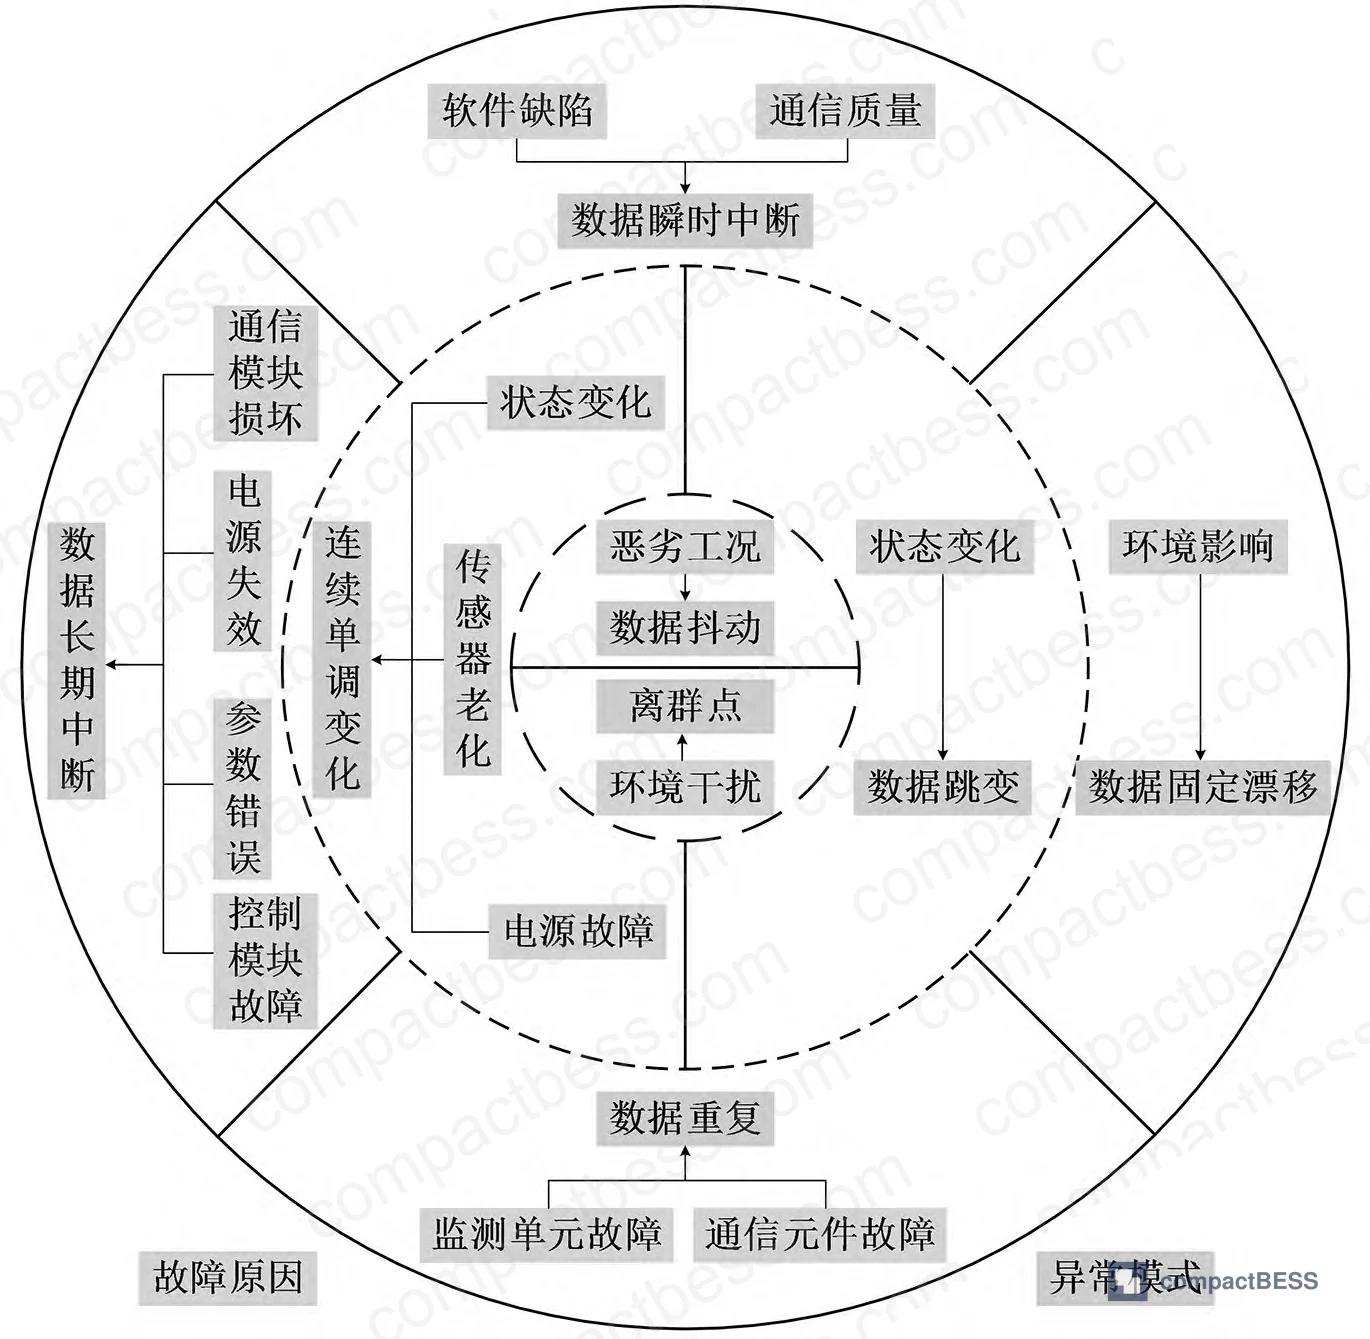
This performance gap matters at the procurement level because BESS deployments in commercial or grid applications are typically running continuous sequences — charge/discharge cycles, ambient temperature swings, load transients. Standard LSTM processes these sequences unidirectionally. Bi-LSTM captures both forward and backward temporal dependencies, which is why it tracks the degradation curve in BMS4 more accurately right when accuracy matters most — during rapid deterioration.
Most procurement teams don’t realize that the “AI-based BMS” label appearing in supplier datasheets often refers to basic single-direction LSTM or even simpler regression models. The difference in prediction error between 0.28 and 0.16 relative error is the difference between scheduling preventive maintenance correctly and missing the window entirely.
Failure Modes That BMS Self-Monitoring Must Catch #
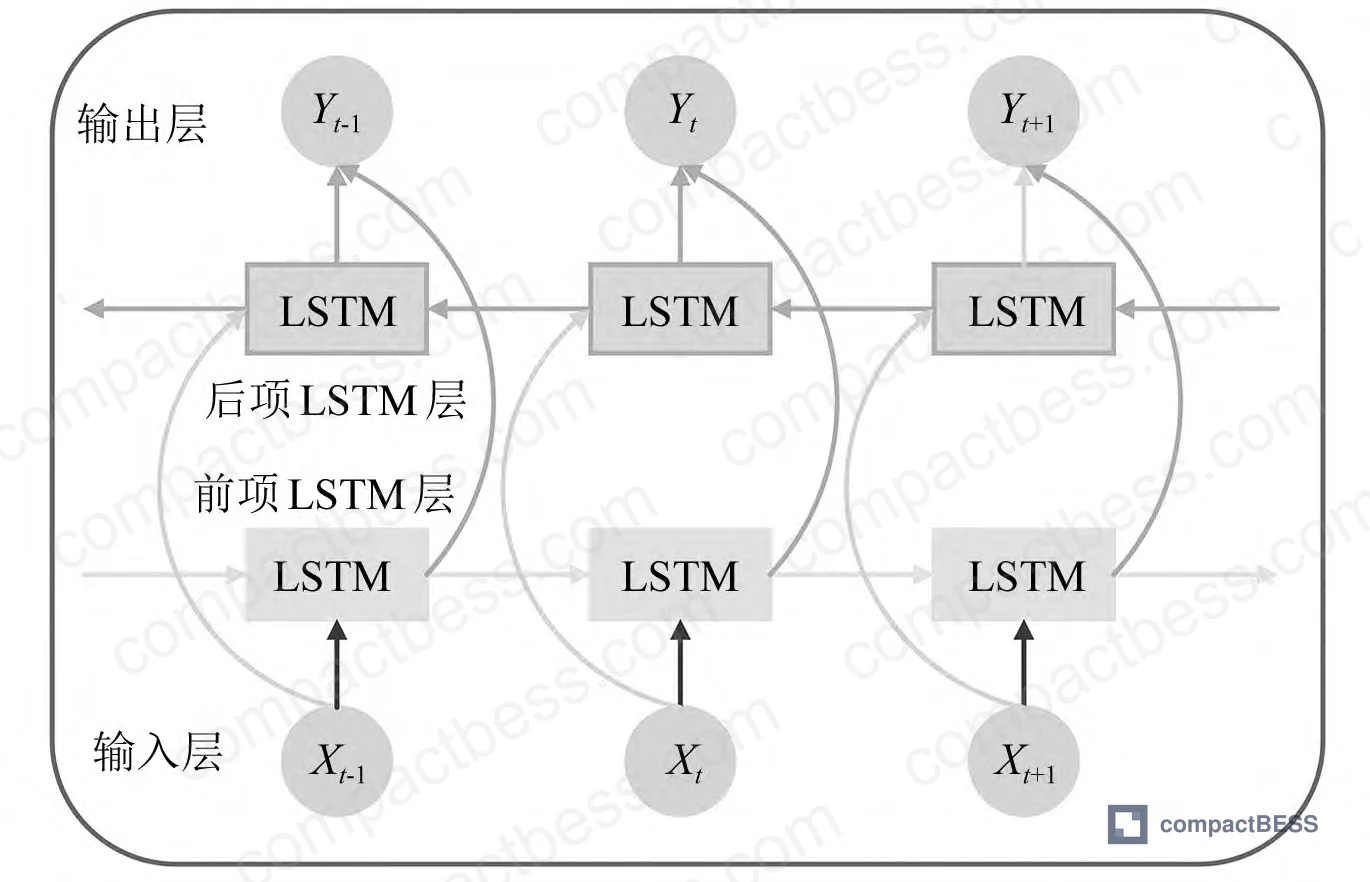
The three anomaly categories identified in the field data define what your BMS health monitoring system needs to be sensitive to. These are not hypothetical — they represent the actual failure patterns observed across the 18-unit installation.
External environment influence produces data jitter and sudden value spikes. Temperature variation is the primary driver. Importantly, the research distinguishes this from BMS self-failure: sporadic anomalies under harsh environmental conditions do not by themselves indicate reliability degradation. Only pattern-based rises or sudden directional shifts in anomaly frequency correlate with actual health decline.
Related device faults cover four distinct sub-categories:
- Communication failures causing data interruption
- Sensor anomalies causing measurement distortion
- Internal power supply aging causing sensitivity drift
- Software parameter misconfiguration causing data offset
In supplier qualification, we saw this category account for the most insidious failures. A BMS with a slowly aging internal power supply will produce plausible-looking data that drifts outside actual cell conditions — causing miscalibrated charge/discharge control, which accelerates early cell degradation through overcharge or over-discharge events.
Device state changes reflect genuine changes in the monitored physical parameters — this is the signal you want the BMS to detect accurately. The health assessment framework is designed to separate environmental noise from true equipment state changes, which is what makes the RBF kernel parameter optimization step critical. Standard kernel PCA achieved reliability scores (M₁) of 95.27% and continuity (M₂) of 95.96%, while the optimized RBF method reached 97.19% and 97.46% respectively.
Practical Guidance for Buyers #
If you are sourcing BMS modules for a BESS project — whether that’s a containerized grid storage installation, a commercial UPS system, or an industrial backup power application — health monitoring capability needs to be in your technical specification document, not just your wish list.
The minimum functional requirement should be a five-tier health grading system with quantified thresholds (H values at 0.8, 0.6, 0.4, and 0.2 decision points) and documented early-warning trigger logic. Ask specifically whether the supplier’s prediction algorithm handles nonlinear time-series data. Most do not — they use threshold alarms based on instantaneous values, which catch faults after they’re visible, not before.
At CompactBESS, we work with global OEM buyers, system integrators, and procurement engineers sourcing from verified Chinese manufacturers across the full BESS component spectrum — from BMS modules to complete containerized systems. If you’re evaluating suppliers for a BMS procurement and need to separate technically capable vendors from those reselling generic modules, our sourcing team can filter against the specific health monitoring parameters in your spec.
Require sample data from a real deployment, not a lab demo. Ask for the RMSE values from their prediction validation runs. A qualified supplier should be able to provide comparative prediction accuracy data — if they can’t, that tells you something.
Need help identifying qualified suppliers for intelligent BMS modules with health prediction capability? Talk to our sourcing team →
Supplier Qualification Questions #
- What is the health index (H value) resolution your BMS reports, and can you demonstrate the firmware’s five-tier grading output with H thresholds at 0.2, 0.4, 0.6, and 0.8 against a test dataset from an operating installation?
- What dimensionality reduction method does your BMS use to process high-dimensional monitoring data, and what are the measured reliability (M₁) and continuity (M₂) scores from your validation testing — do they meet or exceed 97% on both metrics?
- Can you provide comparative prediction accuracy data showing RMSE and relative error (E_R) values for your health prediction model, and does your model achieve a relative error below 0.20 on a 10-day forward prediction window?
- How does your BMS distinguish between external environment-induced data anomalies (temperature jitter, EMI) and genuine device health degradation — specifically, what pattern recognition logic prevents false-positive fault flags from PWM ripple or ambient temperature variation?
- What is the maximum number of monitored cell parameters per cluster, and has your BMS been validated on installations with ≥18 storage units, ≥6 clusters per unit, and ≥4 temperature sensors per cell (equivalent to the density of the field validation dataset)?
Sourcing Checklist #
- [ ] BMS firmware implements a quantified 5-tier health index (H) system with documented decision thresholds at H = 0.8, 0.6, 0.4, and 0.2
- [ ] Supplier can provide validation data showing data reliability score (M₁) ≥ 97% and continuity score (M₂) ≥ 97% from a real deployment dataset
- [ ] Health prediction algorithm achieves average RMSE ≤ 0.025 and average relative error ≤ 0.20 across monitored BMS units in supplier’s published test results
- [ ] BMS differentiates between three anomaly categories: external environment influence, related device faults (including communication failures, sensor anomalies, PSU aging, software offset), and device state changes
- [ ] Supplier can demonstrate compliance with IEC 62619 safety requirements for BMS in stationary energy storage applications
- [ ] Early-warning trigger logic is documented and validated against time-series data — not just threshold alarms based on instantaneous sensor readings
- [ ] BMS has been tested in environments with significant PWM ripple and EMI consistent with GB/T 34131 requirements for battery management systems in electrochemical energy storage stations
- [ ] Sample evaluation includes functional verification of communication fault detection, sensor anomaly detection, and PSU aging sensitivity — all three sub-categories of device fault detection identified in field validation
Key Specifications Table #
| Parameter | Recommended Value | Verification Method | ||
|---|---|---|---|---|
| Health index prediction RMSE (Bi-LSTM) | ≤ 0.025 average across monitored units | Supplier provides validation test log with 30-day training / 10-day prediction split; compare predicted vs. actual H values | ||
| Health index relative error (E_R) | ≤ 0.20 average across monitored units | Same validation log as above; calculate \ | predicted − actual\ | / actual for each time step |
| Data reliability score (M₁) after dimensionality reduction | ≥ 97.0% | Supplier runs kernel PCA dimensionality reduction on sample dataset and reports M₁ via K-neighborhood trustworthiness metric | ||
| Data continuity score (M₂) after dimensionality reduction | ≥ 97.4% | Same dimensionality reduction run; M₂ calculated via K-neighborhood continuity metric | ||
| Health index update frequency | ≤ 1 minute intervals for real-time monitoring | Review BMS firmware documentation and confirm via data log timestamp analysis on sample unit | ||
| Bi-LSTM prediction training iterations | ≥ 500 iterations at learning rate ≤ 0.01 | Request model training configuration documentation from supplier | ||
| Minimum sensor density for validation-grade health assessment | ≥ 4 temperature sensors per cell, ≥ 6 clusters per unit | Verify against BMS hardware spec sheet and installation topology diagram |
Can’t find a supplier meeting these specs? Submit your requirements and we’ll match you within 48 hours.
Frequently Asked Questions #
What is a BMS health index and how is it different from standard SoH (State of Health)?
Standard SoH measures battery cell degradation — capacity fade, internal resistance rise, cycle count. The health index (H) described here measures the BMS device itself: whether its sensors, communication links, power supply, and firmware are operating within reliable parameters. A battery pack can have good SoH while the BMS monitoring it is degrading — and that’s where silent failures happen. H = 1.0 means the BMS is in optimal condition; H below 0.4 means the BMS is in a fault state requiring shutdown and component replacement.
Why does the prediction model matter — can’t threshold alarms catch BMS failures?
Threshold alarms catch failures after they’ve already crossed a critical point. The Bi-LSTM model predicts the health trajectory based on temporal patterns, which means maintenance can be scheduled before the unit reaches the fault threshold. In the field data, BMS4 was showing a consistent downward trend in health index from day 1. A threshold alarm would have triggered somewhere around day 12 when H crossed 0.4. The prediction model identifies the trajectory early enough to act.
What causes the biggest performance difference between standard LSTM and Bi-LSTM for this application?
Bi-LSTM processes time-series data in both forward and backward directions simultaneously, which improves its ability to capture the full temporal context of a degradation event. In the comparative validation, Bi-LSTM reduced RMSE by 56.33% and relative error by 42.86% versus standard LSTM. For BESS health prediction specifically, the backward processing helps the model weight recent anomaly patterns more accurately in context.
How many sensors and data channels does a BMS need to support meaningful health assessment?
The field validation ran on a system with 18 containerized storage units, 6 clusters per unit, 15 cells per cluster, and 4 temperature sensors per cell — plus current, voltage, humidity, and acoustic noise channels per cluster. The key insight is that BMS health assessment requires monitoring the device’s own data quality (communication errors, sensor drift, supply voltage stability) in addition to cell parameters. A BMS that only logs cell data cannot assess its own health.
What standards apply to BMS health monitoring in grid-connected energy storage?
For grid-connected BESS, the primary applicable standards include IEC 62619 (safety requirements for secondary lithium cells in stationary applications), IEC 62933-5-2 (safety requirements for grid-integrated energy storage systems), and UL 9540 (energy storage systems and equipment). For Chinese domestic deployments, GB/T 34131 covers BMS requirements in electrochemical energy storage stations specifically. Health monitoring algorithm requirements are not yet fully standardized — which is why supplier validation data is the primary qualification tool right now.
For buyers evaluating BMS communication protocols and data architecture or assessing SoH and RUL prediction methods across suppliers, these technical baselines provide a starting point for writing defensible procurement specifications.
Published by compactbess.com Technical Team | Request a sourcing quote
Data source: Intelligent Health Assessment and Early Warning of Battery Management Systems in Grid-Scale Energy Storage Stations Using Optimized Kernel Principal Component Analysis and Bidirectional LSTM Networks, H. Liu et al., Journal of the Electrochemical Society, 2024


