

TL;DR #
If you’re specifying a liquid cooling plate for a stationary energy storage pack, the first mistake most procurement teams make is treating thermal performance as the only selection criterion. In practice, the cooling plate is also a primary structural member — it supports the entire pack weight, directly affects thermal interface material thickness, and determines whether your assembly tolerances are achievable at volume. Getting one parameter right while ignoring the others will cost you in rework, warranty returns, or pump sizing errors downstream.
This evaluation covers three distinct liquid cooling plate designs tested head-to-head under identical conditions on a bottom-cooled energy storage battery pack. All three designs were physically built and tested at 0.5 C charge/discharge rate with coolant inlet at 18 °C and ambient at 25 °C. We measured peak cell temperature, temperature uniformity (ΔT across the pack), pressure drop, and structural deformation under a 312 kg static load held for 12 hours. The data tells a clear story — and it’s not the one most thermal engineers expect.
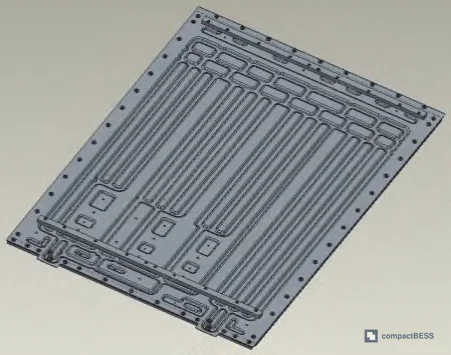
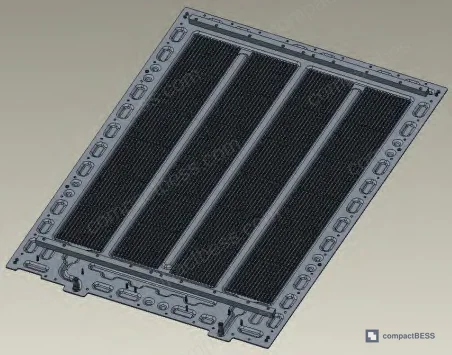
Cooling Channel Design: Three Architectures, Three Trade-Off Profiles #
The three designs differ fundamentally in flow channel geometry, load-bearing strategy, and manufacturing process. Understanding these differences is prerequisite to any rational sourcing decision.
Scheme 1 — Three-Parallel One-Series (U-Type): Stamped aluminum, conventional brazing. The channel is simple, flow resistance is low, and tooling cost is high due to the stamping dies. Because stamped plates are limited to thin aluminum sheet (preferred thickness ≤ 2.5 mm), the plate lacks inherent structural rigidity and requires a dedicated load-bearing cross-beam bolted underneath. Assembly fit between that beam and the plate bottom is never perfect — stamping tolerances and slight warpage mean the contact is partial, not uniform, and this directly inflates deformation under load.
Scheme 2 — W-Type with Turbulence Fins: Stamped aluminum with internal turbulence fins (spoilers), conventional brazing. The fins serve a dual function: they increase heat exchange surface area and turbulence, and they act as internal reinforcing ribs. This removes the need for an external load-bearing beam. The fin geometry increases pressure drop relative to Scheme 1 but improves temperature uniformity meaningfully. Still subject to the same stamping die cost burden.
Scheme 3 — Countercurrent Labyrinth: Vacuum brazing, aluminum block construction with turbulence fins welded in both longitudinal and transverse directions. Perimeter sealed with aluminum block splice welding. No stamping dies required, which slashes tooling cost and lead time for first article. The labyrinth countercurrent arrangement maximizes surface temperature uniformity but produces the highest pressure drop of the three — a specification that directly sets the floor for coolant pump selection.
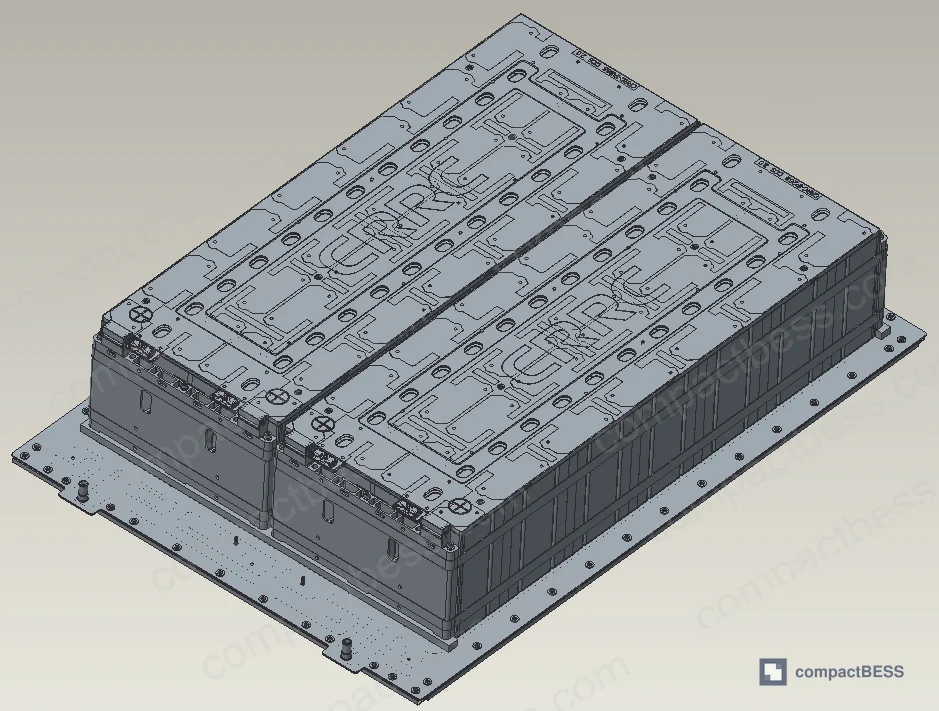
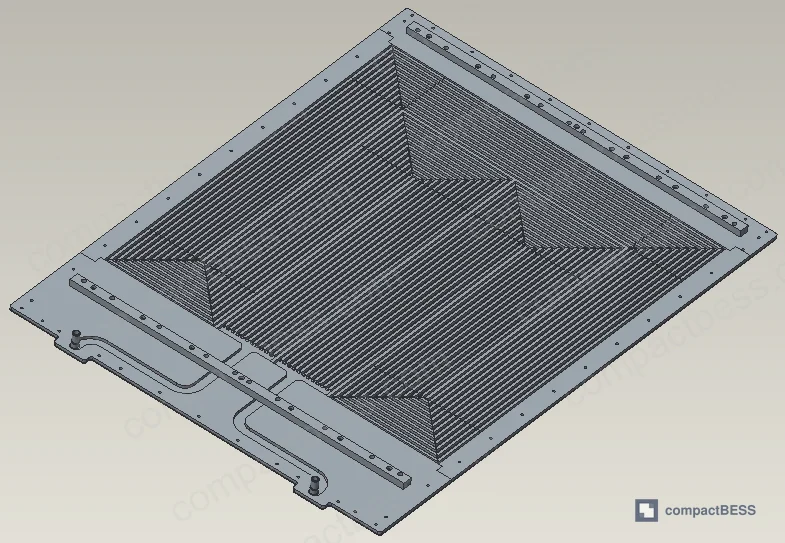
Comparative Summary Table #
| Parameter | Scheme 1 (U-Type, Stamped) | Scheme 2 (W-Type + Fins, Stamped) | Scheme 3 (Countercurrent Labyrinth, Vacuum Brazed) |
|---|---|---|---|
| Peak Cell Temp (charge) | 33 °C | 32 °C | 32 °C |
| Temperature Uniformity ΔT | ~5 K (charge), 4 K (discharge) | ~3 K (charge/discharge) | ~1 K (charge/discharge) |
| Pressure Drop | 10.3 kPa | 15.6 kPa | 18.3 kPa |
| Max Structural Deformation (B-row) | 1.55 mm | ~1.2 mm (est.) | Smallest (pass) |
| Load-Bearing Method | External steel cross-beam | Integral (fins as ribs) | Integral (labyrinth + block welding) |
| Manufacturing Process | Stamped + conventional brazing | Stamped + fin + conventional brazing | Vacuum brazing |
| Tooling Cost | High (stamping dies) | High (stamping dies) | Low (no stamping dies) |
| Volume Production Capability | High | High | Moderate |
| Best Fit Application | High-volume, low ΔT tolerance | Mid-range balanced | High uniformity, prototype-to-mid-volume |
The pressure drop figures — 10.3 kPa, 15.6 kPa, and 18.3 kPa — aren’t just thermal numbers. They are pump sizing inputs. Before you finalize any of these designs for your system, verify your coolant loop can sustain the required flow rate (5 L/min in this test) against the actual pressure drop. Undersizing the pump is one of the most common and preventable integration failures in this category.
Thermal and Structural Test Results #
Test Configuration #
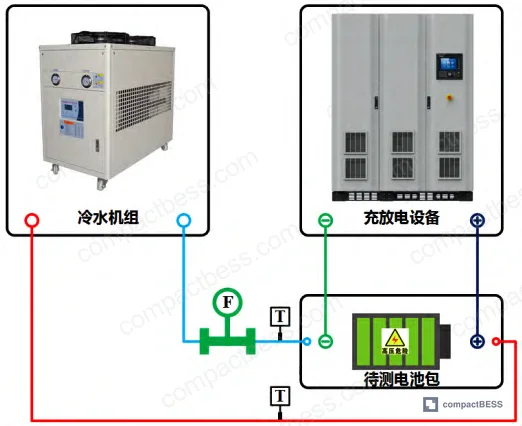
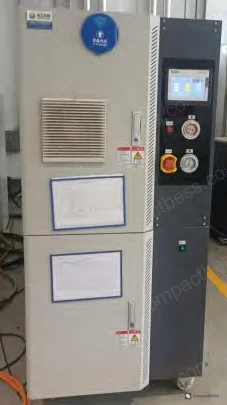
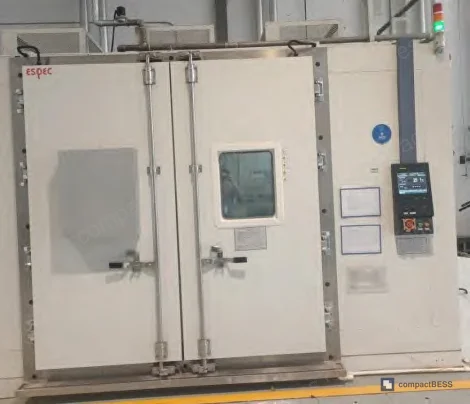
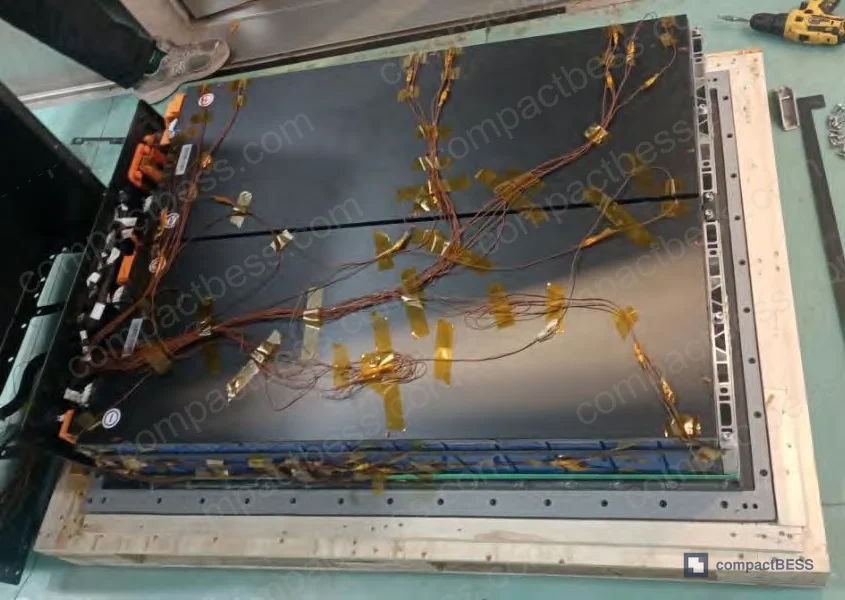
The test platform followed GB/T 36276-2023 (Lithium-Ion Batteries for Electrical Energy Storage) for pack capacity calibration and initial SOC reference. Coolant was a 50/50 mixture of deionized water and ethylene glycol — standard for freeze protection in outdoor BESS applications. Inlet temperature was fixed at 18 °C, ambient at 25 °C, flow rate at 5 L/min. The charge/discharge cycle ran at 0.5 C. BMS temperature data was logged in real time, and inlet/outlet pressure transducers recorded pressure drop continuously.
Thermal Results #
All three schemes held peak cell temperature below 35 °C throughout the charge/discharge cycle — all three pass the basic thermal dissipation threshold. That result alone is not sufficient grounds for selection, and honestly, most buyers stop reading here. Don’t.
The temperature uniformity data is where the designs diverge sharply. Scheme 3 achieved ΔT of just 1 K during both charge and discharge. Scheme 2 achieved 3 K. Scheme 1 hit 5 K during charging and 4 K during discharge — right at the commonly cited 5 °C inter-cell limit for EV-class thermal management. For stationary storage operating at 0.5 C cycling over thousands of cycles, a persistent 5 K differential accelerates cell aging non-uniformly across the pack, which means capacity fade and eventual cell replacement will not be symmetric. That is a long-term cost, not just a spec number.
The temperature profiles also revealed a consistent discharge anomaly across all three schemes: cell temperature rose sharply in the initial discharge phase, stabilized in the middle period (approximately 30–40 minutes), then rose again near the end of discharge. This end-of-discharge thermal uptick suggests internal electrochemical heat generation dynamics during deep discharge are more complex than the charge-side behavior — worth flagging if your application profile includes frequent deep discharge cycling.
Structural (Load-Bearing) Results #
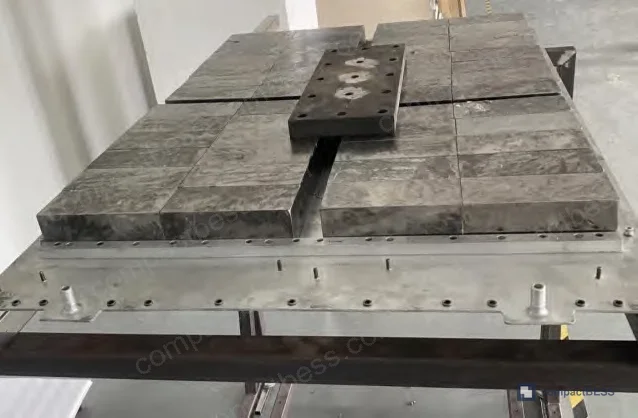
The load-bearing test applied 312 kg of static weight between the two battery mounting beams for 12 hours at 25 °C ambient. The deformation specification is ≤ 2 mm elastic deformation — this limit exists because the thermal interface material (structural adhesive, 1–1.5 mm thick between cells and plate) has a tolerance window; excess plate bow increases effective bond-line thickness unevenly and degrades thermal conductance.
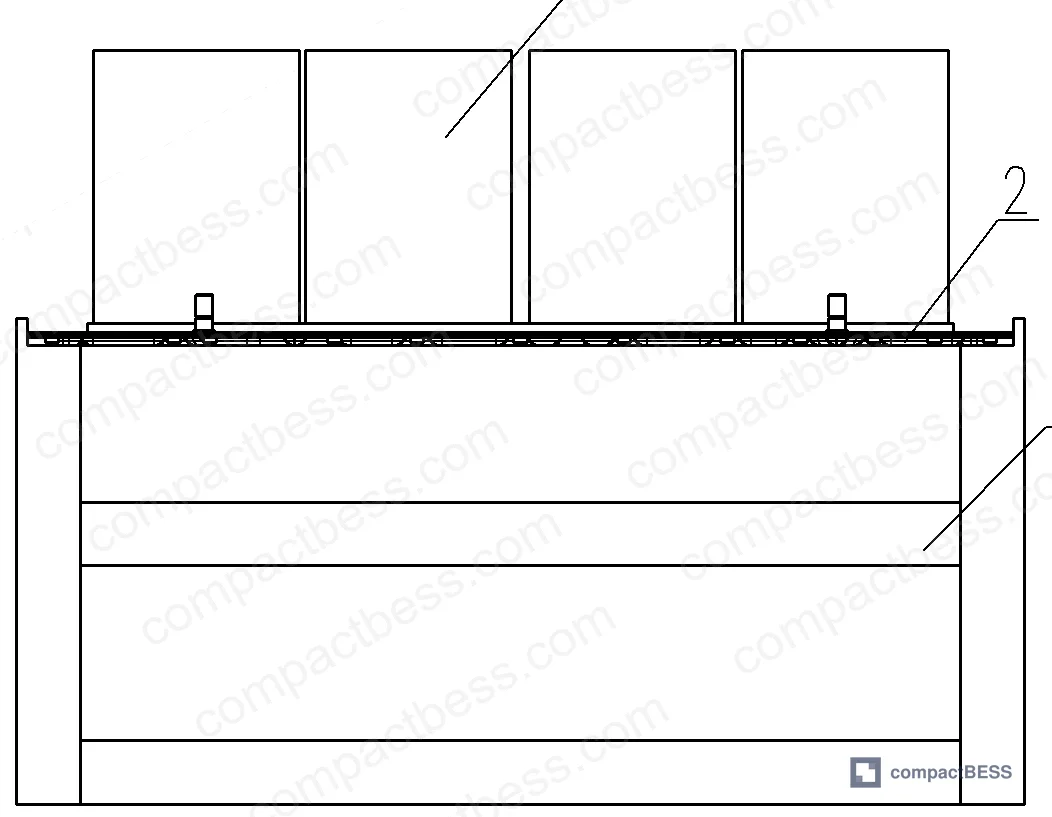
Test points were arranged in a 3-column (A, B, C) × 5-row grid across the plate surface. A knife-edge straightedge (900 mm) and feeler gauges measured flatness before and after loading.
The B-column (center span between supports) showed the largest deformation in all three schemes — exactly as structural theory predicts for a simply-supported plate loaded at center span. The critical numbers:
- Scheme 1: B-column deformations reached 1.00–1.55 mm. Worst single point: 1.55 mm. This is within the 2 mm spec, but only because of the added cross-beam. Without the beam, the thin stamped plate deforms catastrophically. Even with the beam, partial contact fit between beam and plate bottom produces non-uniform support, and deformations at rows 2–4 concentrate between 1.15–1.55 mm.
- Scheme 2: B-column deformations are lower than Scheme 1 due to increased plate thickness and integral turbulence fins acting as stiffening ribs. The beam is eliminated. However, deformation values remain “relatively large” — adequate but not optimal.
- Scheme 3: Smallest deformation across all test points. The combination of maximum plate thickness, bidirectional turbulence fins (longitudinal and transverse), and perimeter block-welding construction creates the highest structural rigidity. Best deformation control of the three.
This matters beyond the structural spec itself. Controlling deformation directly controls thermal interface material (structural adhesive) uniformity. If your adhesive bond line varies by more than 0.5 mm across the plate, your effective thermal resistance varies in proportion — and that variation shows up as ΔT across the pack.
In our supplier qualification work, we’ve seen three of six samples fail the 2 mm deformation limit when the cross-beam fit on Scheme 1-type plates was not precisely managed during assembly. The root cause was consistent: partial beam contact created a rocker condition where the plate deflected around the beam rather than being supported by it. This failure mode is nearly invisible in first-article inspection but appears reliably under static load testing.
Manufacturing Process and Procurement Trade-Offs #
Most procurement teams don’t realize that the shift from conventional brazing to vacuum brazing fundamentally changes the supplier qualification and quality control requirements — not just the per-unit cost. IEC 62619:2022 safety requirements for stationary battery systems don’t specify cooling plate construction methods, but the internal void rate in brazed joints directly affects both thermal resistance and pressure integrity. Vacuum brazing achieves substantially lower void rates than conventional brazing — the difference is detectable by X-ray inspection but typically skipped in standard incoming quality checks for cost reasons.
Procurement angle: if you’re qualifying a Scheme 3-type vacuum-brazed plate, your supplier audit should include braze joint integrity verification. Ask for X-ray inspection reports on production samples. Most suppliers won’t offer this proactively.
The three manufacturing profiles also have distinct volume economics:
- Scheme 1 and Scheme 2 require stamping dies. For a new design, tooling cost is high and lead time for first article is long (typically 6–10 weeks for die fabrication). At volume (>500 units/year), the per-unit cost is lowest.
- Scheme 3 requires no stamping dies. First article can be produced quickly from machined and welded aluminum stock. Development cycle is short. But vacuum brazing furnace capacity constrains batch throughput — for high-volume orders (>1,000 units/year), verify your supplier’s furnace scheduling before committing.
Honestly, most buyers over-specify temperature uniformity for applications that don’t need it. If your BESS system operates at ≤ 0.5 C continuously and cells are already well-matched, a 3–4 K ΔT across the pack has minimal impact on cycle life over the warranty period. Specifying < 2 K uniformity drives you toward Scheme 3 and its vacuum brazing process constraints — which may be entirely unnecessary for many stationary storage applications. Know what you actually need before the spec locks.
The relevant thermal management and pack safety standards for international procurement include IEC 62619:2022 for industrial battery safety requirements, UL 9540 for energy storage systems, and cell consistency and matching for pack assembly — thermal uniformity and cell-to-cell impedance matching are tightly coupled.
Practical Guidance for Buyers #
For stationary energy storage packs in the 300–400 kg class, the liquid cooling plate selection decision should start with your uniformity requirement, not your cost target.
If your application requires ΔT < 2 K — high-cycling commercial storage, frequency regulation, applications with premium cell warranties — Scheme 3 (countercurrent labyrinth, vacuum brazed) is the correct answer. Expect higher pressure drop (budget 18–20 kPa at 5 L/min) and validate your pump spec before finalizing the loop design. Tooling cost is low, but confirm vacuum brazing batch capacity with your supplier if you're ordering at scale.
If ΔT of 2–4 K is acceptable — bulk energy storage, daily cycling at ≤ 0.5 C — Scheme 2 offers a reasonable balance. Higher volume production capability and lower per-unit cost at scale offset the stamping tooling investment.
Avoid Scheme 1 unless temperature uniformity is genuinely non-critical and you need maximum volume production throughput. The cross-beam load-bearing dependency introduces a structural assembly variable that’s hard to control across suppliers.
Regardless of which scheme you select, require static load testing per your pack weight spec — not just first-article certification. Deformation tolerance directly sets your thermal interface adhesive specification, and getting that wrong on production units silently degrades thermal performance over the product lifetime. Check out our pack enclosure and IP protection framework in the pack enclosure and IP rating category for additional structural and environmental sealing guidance.
Frequently Asked Questions #
Q: All three schemes passed the peak temperature test. Why does temperature uniformity matter if the max temp is below 35 °C?
A: Peak temperature tells you the hottest cell is safe right now. Temperature uniformity (ΔT) tells you how fast cells are aging at different rates. A consistent 5 K differential between the hottest and coolest cell in the pack means those cells are cycling at different effective temperatures every cycle. Over 3,000–5,000 cycles in a stationary storage application, the cells at the hot edge degrade faster — their capacity fade and internal resistance growth outpace the cooler cells. Eventually the pack’s usable capacity is limited by the weakest cell cluster, not the average. That’s a warranty and replacement cost issue, not just a spec number. If you’re purchasing packs with a 10-year performance warranty, your supplier’s ΔT spec should be part of the warranty condition.
Q: The test used a 50/50 deionized water/ethylene glycol mix. Does coolant composition affect which plate design I should choose?
A: Coolant composition primarily affects fluid viscosity and thermal conductivity, both of which shift the pressure drop vs. flow rate curve. A higher glycol concentration increases viscosity, which increases pressure drop at the same flow rate. For Scheme 3 (already the highest pressure drop at 18.3 kPa with 50/50 mix), moving to a 60/40 or 70/30 glycol mix for cold-climate operation could push the pressure requirement meaningfully higher. Size your pump with margin — at least 20% above the measured pressure drop at operating flow rate.
Q: Why is the B-column (center span) always the worst deformation point? Can repositioning the support frame fix this?
A: The B-column deflects most because the support points are at the plate edges, leaving the center span unsupported — classic simply-supported beam behavior under distributed load. Repositioning supports closer to center would reduce B-column deflection but increase edge deflection and may not be compatible with your rack mounting geometry. The better engineering fix is what Scheme 3 does: increase plate stiffness through bidirectional internal fin reinforcement and perimeter welding rather than trying to optimize support placement.
Q: Is vacuum brazing required for Scheme 3, or can conventional brazing achieve comparable results?
A: Vacuum brazing is functionally necessary for the Scheme 3 labyrinth geometry. The complex internal fin structure and perimeter block assembly create joints that conventional flux brazing cannot reliably reach without contamination or void formation. More critically, flux residue trapped in the labyrinth channels is a field failure risk — it can detach under thermal cycling and block flow. Vacuum brazing eliminates flux entirely. This is not a cost-cutting area.
Q: What does the 1–1.5 mm thermal interface adhesive layer specification mean for procurement?
A: The structural adhesive between cells and the cooling plate is your primary conduction path from cell bottom to coolant. Its thickness is partly set by plate deformation — a more deformed plate requires a thicker adhesive layer to fill the gap variation, and thicker adhesive means higher thermal resistance. Scheme 3’s tighter deformation control means you can consistently target the lower end of the 1–1.5 mm range, which reduces thermal interface resistance and improves heat transfer efficiency. Specify adhesive bond-line thickness in your assembly drawing and verify it with production go/no-go gauging, not just visual inspection.
Published by compactbess.com Technical Team | Request a sourcing quote
Content reviewed by michael.tan | © compactbess.com — All rights reserved. Unauthorized reproduction prohibited.


