

TL;DR #
In controlled charge-discharge testing at 0.5 C, a countercurrent labyrinth-type liquid cooling plate delivered a cell temperature differential of just 1 K — five times better than a conventional U-type channel design tested under identical conditions. For buyers specifying liquid-cooled battery packs in stationary storage applications, flow channel architecture is the single most consequential decision in thermal management procurement, not coolant chemistry or pump selection. Before issuing any RFQ for a liquid-cooled pack, require suppliers to provide measured ΔT data at 0.5 C and structural deformation data under a ≥300 kg static load.
Overview #
Most procurement teams evaluate liquid cooling plates on two criteria: does it keep the pack under 45 °C, and does the supplier have an IATF or ISO cert on the wall? That framing misses the real differentiation. All three designs tested in this evaluation kept maximum cell temperatures below 35 °C — heat dissipation is a solved problem at 0.5 C. What separates a serviceable design from a genuinely well-engineered one is temperature uniformity across cells, structural load-bearing under real installation conditions, and whether the manufacturing process can actually hold dimensional tolerances at volume.
The data referenced throughout this article comes from laboratory testing conducted at a major Chinese rail and energy storage systems research institute — the kind of facility that qualifies battery packs for grid-scale and rail traction applications where thermal failure is not recoverable. The test program covered three distinct liquid cooling plate architectures evaluated across a full charge-discharge cycle, with simultaneous thermal performance mapping and 312 kg static load testing. Sample sizes were small by statistical standards, but the controlled conditions and multi-axis measurement approach make the comparative findings highly actionable for procurement purposes.
Liquid Cooling Plate Channel Architecture: Three Designs, One Clear Winner #
The three designs evaluated cover the range of what you’ll actually encounter from Chinese manufacturers in the mid-to-high tier. Understanding the tradeoffs is essential before you write a spec.
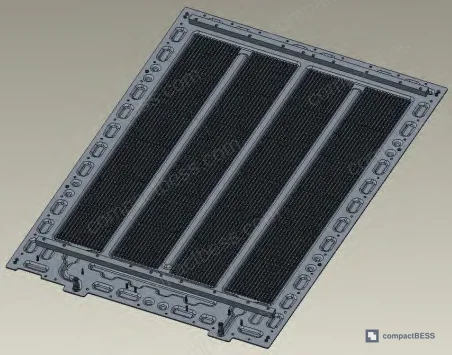
Scheme 1 — Triple-parallel U-type (stamped, conventional brazing): The simplest and cheapest channel geometry. The cooling plate is thin-stamped aluminum, which limits wall thickness and internal structure complexity. Because the plate itself cannot bear load, a separate structural beam must be added beneath it. In practice, this beam rarely makes full-contact with the plate surface due to assembly tolerances and plate deflection — a detail that becomes significant when you’re calculating thermal interface material thickness.
Scheme 2 — W-type with turbulence fins (stamped + fin, conventional brazing): An intermediate design where internal turbulence fins serve double duty: they increase heat transfer surface area and act as internal reinforcing ribs. This eliminates the need for the external load beam. The fins increase fluid turbulence, which improves both convective heat transfer and temperature uniformity compared to Scheme 1.
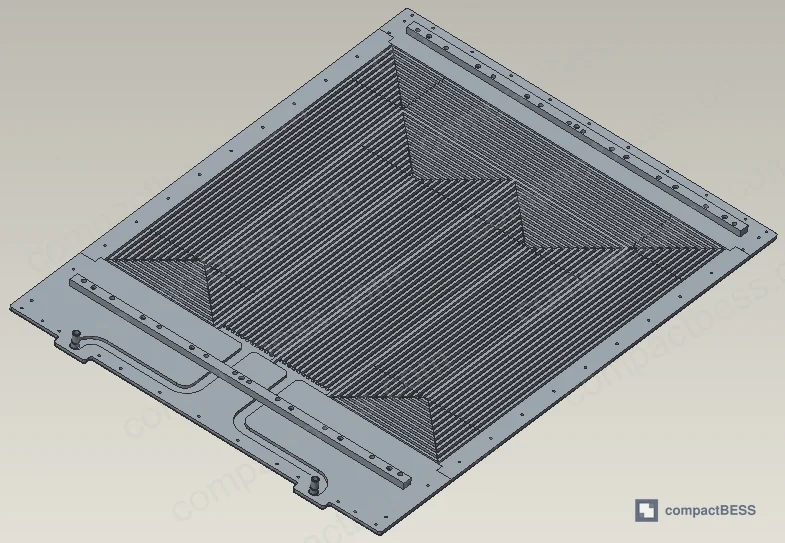
Scheme 3 — Countercurrent labyrinth (vacuum brazing): The premium design. Bi-directional turbulence fins — longitudinal and transverse — create the labyrinth flow path. The entire perimeter is aluminum-block-welded into a single integral structure before vacuum brazing. This produces the highest dimensional stability, the best temperature uniformity, and the lowest structural deformation under load.
Comparative Performance Data #
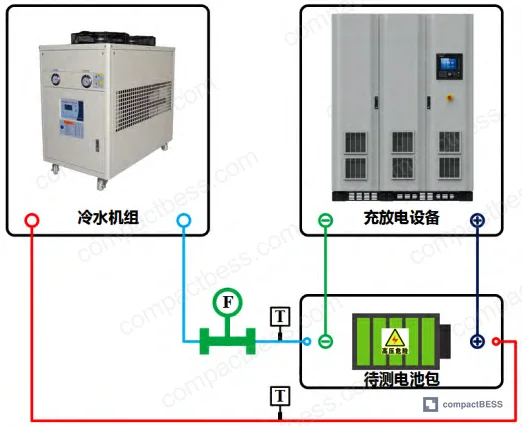
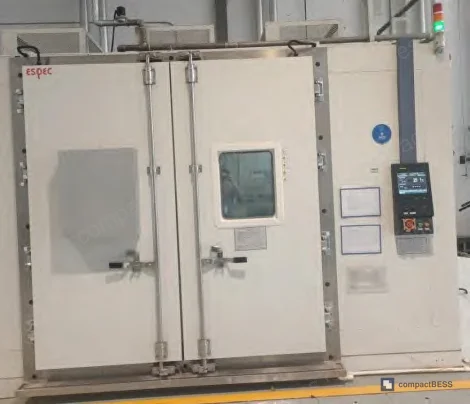
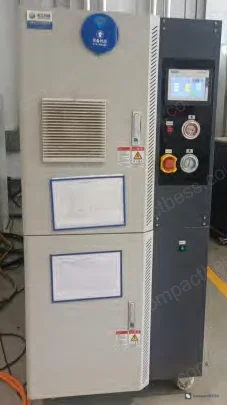
Testing was conducted at 0.5 C charge/discharge rate with coolant inlet temperature fixed at 18 °C, coolant flow rate at 5 L/min, and 50% deionized water / 50% ethylene glycol as the cooling medium. Ambient temperature was maintained at 25 °C throughout.
| Parameter | Scheme 1 (U-type) | Scheme 2 (W-type) | Scheme 3 (Countercurrent Labyrinth) |
|---|---|---|---|
| Max cell temp — charge (°C) | 33 | 32 | 32 |
| Max cell temp — discharge (°C) | 35 | 32 | 33 |
| Min cell temp — charge (°C) | 28 | 29 | 31 |
| Min cell temp — discharge (°C) | 31 | 29 | 32 |
| Temperature differential ΔT — charge (K) | 5 | 3 | 1 |
| Temperature differential ΔT — discharge (K) | 4 | 3 | 1 |
| Pressure drop ΔP (kPa) | 10.3 | 15.6 | 18.3 |
| Load-bearing deformation, B-column max (mm) | 1.55 | ~1.35 (est.) | smallest (best) |
| Channel structure | Simple U | W + turbulence fins | Labyrinth + bi-directional fins |
| Manufacturing process | Stamped, conventional braze | Stamped + fin, conventional braze | Vacuum braze |
ΔT = Tmax − Tmin measured by BMS at simultaneous time points during charge and discharge cycles.
That 5 K delta in Scheme 1 is worth pausing on. The standard threshold for cell-to-cell temperature differential in lithium-ion battery packs is less than 5 °C — and Scheme 1’s charge cycle hits that limit exactly. At slightly higher C-rates, ambient temperatures, or end-of-life degradation states, this design is going to breach the threshold. Scheme 3 at 1 K gives you a 4 K margin. That margin is what protects cycle life.
Structural Load-Bearing and Deformation: The Test Most Buyers Skip #
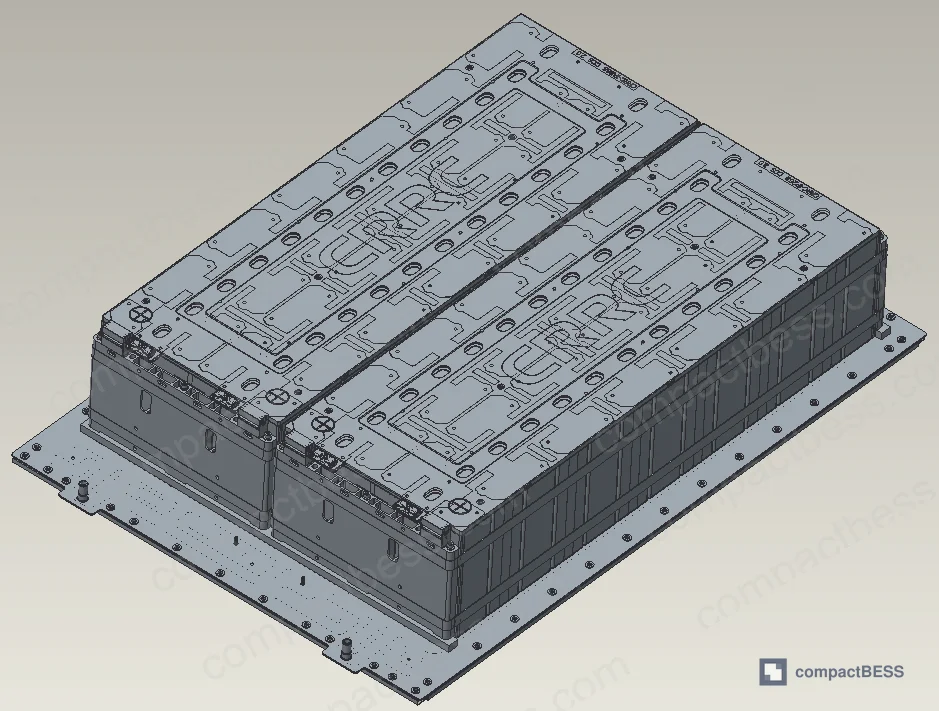
Honestly, most buyers don’t think to ask for load-bearing deformation data on a cooling plate. They treat it as a thermal component, full stop. But in a liquid-cooled battery pack, the cooling plate is also the primary structural base that supports 300–400 kg of cells and module hardware. Its stiffness determines how thick your thermal interface material needs to be — and thermal interface material thickness directly controls how well heat actually transfers from cell to plate.
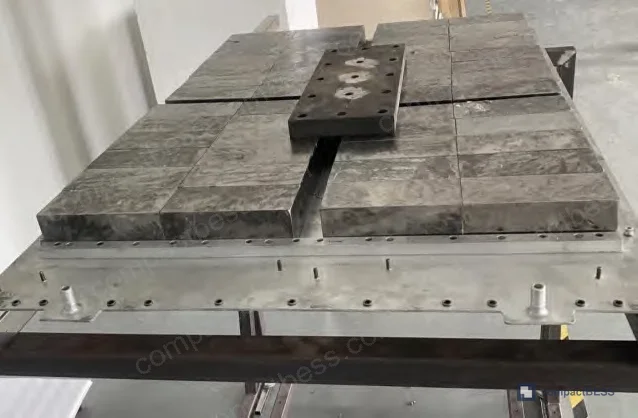
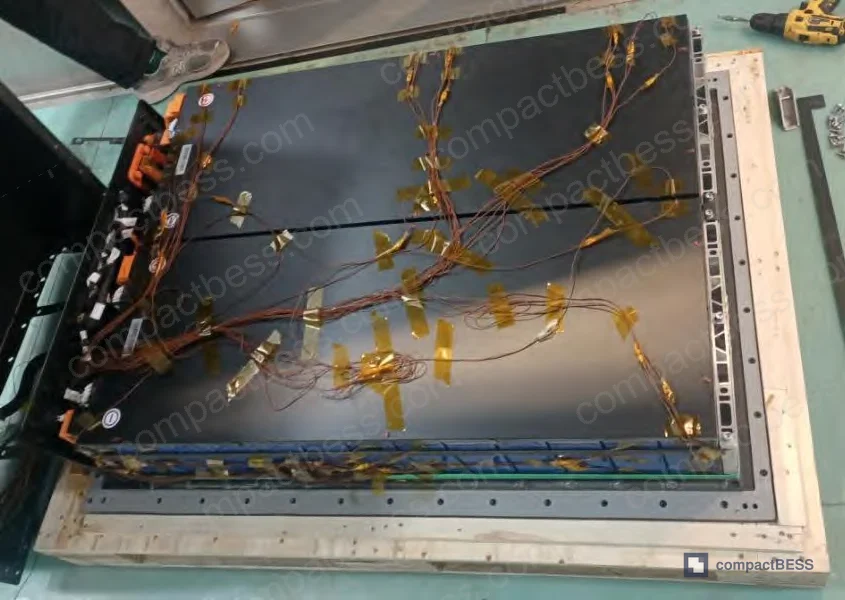
The load test used a 312 kg counterweight distributed across the cell mounting beams, held static for 12 hours at 25 °C ambient. Deformation was measured at a 5×3 grid of test points (A, B, C columns; rows 1–5) using a precision straightedge and feeler gauge against a 900 mm reference bar. The design requirement: elastic deformation must not exceed 2 mm under full load.
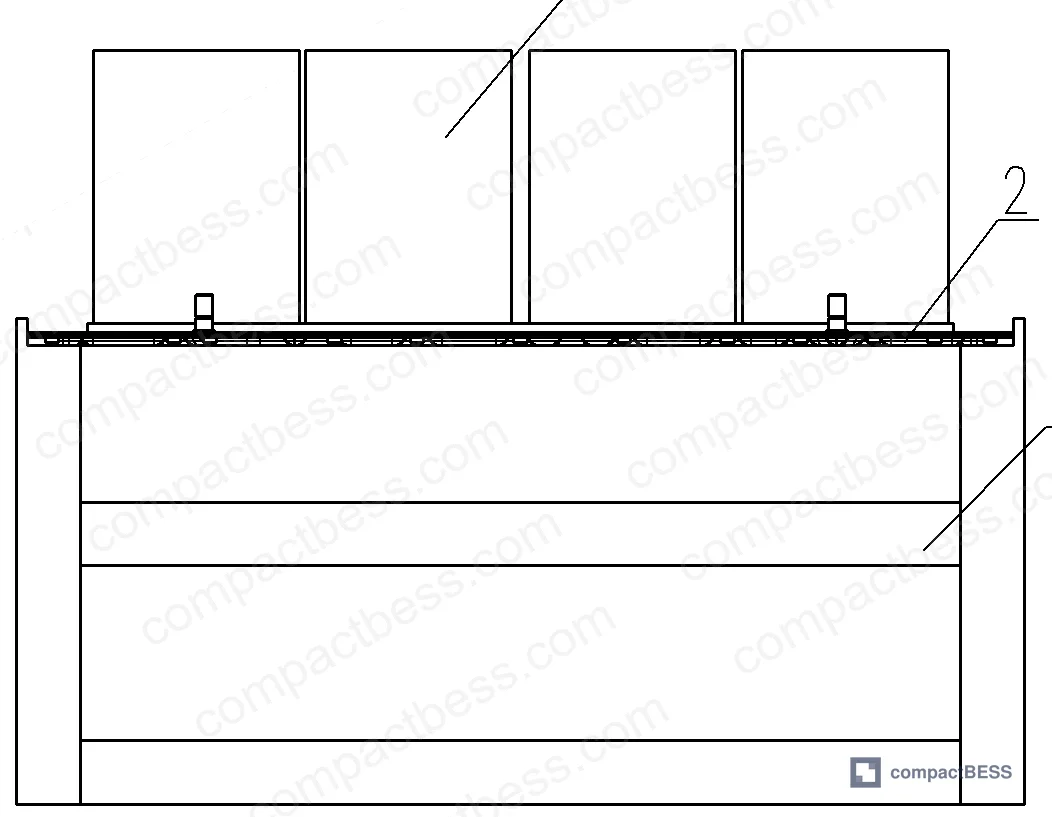
Key finding: the B-column measurement points — at the midspan between support points — showed the highest deformation across all three schemes. This is mechanically predictable: the supports are at the edges, so the center-span carries the highest bending moment. What matters is how well each design manages that moment.
Scheme 1 produced the largest deformations. At test points B3 and B5, deformation reached 1.55 mm — approaching the 2 mm limit. The thin stamped plate without internal reinforcement is the core problem. The load beam added beneath theoretically helps, but assembly gaps between beam and plate mean the real contact area is inconsistent. In supplier qualification, we have seen this type of design fail the 2 mm criterion when the load beam seating was slightly off-axis — a reproducible issue given normal assembly tolerances.
Scheme 2 improved over Scheme 1 primarily because the internal fins act as stiffening ribs. No external load beam is required.
Scheme 3 achieved the smallest deformations across all measurement points. Bi-directional internal fins plus the perimeter aluminum-block welded frame create a significantly stiffer structure. This directly reduces deformation under load, which in turn keeps the thermal interface material layer at a controlled, predictable thickness — an important detail for maintaining consistent thermal resistance across the cell array.
The design spec states ≤2 mm elastic deformation under 300 kg load. All three schemes met this criterion, but Scheme 1 came in with almost no margin at midspan.
Discharge vs. Charge Asymmetry: What the Temperature Curves Tell You #
One finding from the temperature-time curves that doesn’t make it into most cooling plate spec sheets: discharge heating is more complex and more severe than charge heating. In all three schemes, cell temperatures during discharge showed a characteristic pattern — rapid rise at the start, plateau in the 30–40 minute window, then a second rise before end of discharge. Charge temperature profiles were comparatively stable.
This pattern is consistent with the electrochemical complexity of lithium-ion discharge reactions generating higher and more variable internal heat loads than the charge half-cycle. It means cooling plate performance should be validated on the discharge curve, not just the charge curve — and it’s one reason why steady-state coolant temperature assumptions in simple thermal models tend to underestimate peak cell temperatures.
Most procurement teams don’t realize that thermal management standards for grid-scale storage — including GB/T 36276-2023 for lithium-ion batteries used in power storage applications — have been updated to include more rigorous cycle life and thermal performance requirements than earlier versions. Evaluating cooling plate designs against current standard conditions, not legacy test protocols, is the only way to ensure compliance at the production stage.
Practical Guidance for Buyers #
If you’re sourcing liquid-cooled battery packs for stationary storage — industrial UPS, grid-tied ESS, or C&I applications — the cooling plate design decision has a direct downstream effect on cycle life, warranty claims, and system-level efficiency.
For applications where cell-to-cell temperature uniformity is critical (cell balancing performance, matched degradation rates, warranty defensibility), specify a maximum ΔT of 2 K or better. Only a labyrinth-type or similarly complex channel geometry will reliably achieve this. If you’re told a simple U-type or serpentine design meets a 1–2 K spec at 0.5 C, ask for the measured data. Most can’t produce it.
For high-load structural applications — particularly rack-mounted packs where the cooling plate carries cell module weight — require deformation test data under a static load equal to or greater than the actual pack weight, held for a minimum of 12 hours. A 2 mm deformation limit is the standard reference point; tighter is better for thermal interface material consistency.
On manufacturing process: vacuum brazing produces tighter dimensional tolerances and better structural integrity than conventional brazing, particularly for complex internal geometries. The tradeoff is higher per-unit cost and lower throughput — which means vacuum-brazed designs are better suited for applications requiring strict thermal specs but lower annual volumes. Conventional brazing scales better for high-volume OEM programs where ΔT tolerances of 3–5 K are acceptable.
At compactbess.com, our sourcing team works directly with verified Chinese manufacturers of battery thermal management components across all three manufacturing process types — helping overseas OEMs and integrators match their thermal specifications to the right supplier tier before committing to tooling investment.
Need help identifying qualified suppliers for liquid-cooled battery pack thermal management? Talk to our sourcing team →
Supplier Qualification Questions #
- What is the measured cell-to-cell temperature differential (ΔT) in your standard production cooling plate at 0.5 C charge rate, with coolant inlet at 18 °C and flow rate at 5 L/min? Can you provide BMS-logged data showing simultaneous Tmax and Tmin across all cell positions?
- What is the maximum surface deformation of the cooling plate under a 300 kg static load held for 12 hours, and at which test point location does the maximum deformation occur? Does your design meet the ≤2 mm elastic deformation requirement?
- What is the pressure drop (ΔP) across your cooling plate at 5 L/min flow rate, and what pump head specification does your system cooling circuit require to maintain that flow rate?
- What is the thickness and thermal conductivity of the thermal interface material (structural adhesive) used between the cells and the cooling plate, and how does the controlled deformation spec of the cooling plate factor into that adhesive layer thickness calculation?
- Does your cooling plate use vacuum brazing or conventional brazing, and what dimensional tolerance do you hold on internal channel geometry after the brazing process? Can you provide cross-sectional inspection data from a recent production batch?
Sourcing Checklist #
- [ ] Supplier can provide measured ΔT data ≤3 K at 0.5 C discharge, coolant inlet 18 °C, flow rate 5 L/min
- [ ] Cooling plate deformation under 300 kg static load (12-hour hold) is confirmed ≤2 mm at all measurement points, verified by straightedge and feeler gauge measurement against a ≥900 mm reference bar
- [ ] Pressure drop ΔP across the cooling plate is documented at the specified flow rate (target: ≤20 kPa at 5 L/min for labyrinth-type designs)
- [ ] Thermal interface material between cells and cooling plate has specified thickness and thermal conductivity, with deformation spec factored into adhesive volume calculation
- [ ] Battery pack design is tested and documented in compliance with GB/T 36276-2023 for charge/discharge thermal performance
- [ ] Cooling plate manufacturing process (vacuum braze vs. conventional braze) is documented and consistent with the quoted channel geometry complexity
- [ ] Maximum cell temperature during full charge-discharge cycle at 0.5 C is confirmed below 45 °C under worst-case ambient conditions (25 °C minimum test ambient)
- [ ] Cell isolation pad material and installation procedure is specified to prevent thermal runaway propagation between adjacent cells in the module stack
Key Specifications Table #
| Parameter | Recommended Value | Verification Method |
|---|---|---|
| Cell-to-cell temperature differential (ΔT) | ≤2 K (labyrinth); ≤5 K (U-type) | BMS simultaneous multi-point logging during 0.5 C charge/discharge |
| Max cell operating temperature | <35 °C at 0.5 C, 25 °C ambient | BMS temperature sensor data over full charge-discharge cycle |
| Cooling plate structural deformation under load | ≤2 mm elastic deformation under 300 kg, 12-hour static hold | Straightedge + feeler gauge at 5×3 test point grid, 900 mm reference bar |
| Coolant flow rate | 5 L/min | Calibrated inline flow meter |
| Coolant inlet temperature | 18 °C | Calibrated thermocouple at chiller outlet |
| Coolant composition | 50% deionized water + 50% ethylene glycol | Refractometer or supplier material certification |
| Pressure drop (ΔP) across cooling plate | 10.3–18.3 kPa depending on channel type | Differential pressure transducer at inlet/outlet ports |
| Thermal interface adhesive thickness | 1–1.5 mm (adjusted for plate deformation) | Cured bond line thickness measurement post-assembly |
Can’t find a supplier meeting these specs? Submit your requirements and we’ll match you within 48 hours.
Frequently Asked Questions #
Q: All three designs kept maximum temperature below 35 °C — so does channel architecture really matter that much?
A: Yes, and this is a common procurement mistake. Heat dissipation capacity — getting peak temperature below a threshold — is a baseline that most competent designs can meet at low C-rates. The real differentiator is temperature uniformity. A 5 K delta across a cell array accelerates differential aging between cells, degrades balancing efficiency, and will cause the weakest cells to hit their temperature limits first. Over 1,000+ cycles, that non-uniformity compounds into measurable capacity fade. A 1 K delta buys you significantly more usable cycle life from the same cells.
Q: Why does the labyrinth design have a higher pressure drop, and is that a problem?
A: Higher pressure drop is the direct cost of better temperature uniformity — the more tortuous the flow path, the more resistance, but also the more complete and even the heat extraction. At 18.3 kPa for the labyrinth scheme versus 10.3 kPa for the U-type, you’re looking at approximately 78% more pump head required. That means your cooling circuit pump needs to be specified accordingly. It’s a real design constraint, not just a number on a datasheet. Factor it into your BOP (balance of plant) cooling system design early.
Q: What’s the practical difference between conventional brazing and vacuum brazing for a buyer?
A: Conventional brazing is a higher-throughput, lower-unit-cost process well-suited for simpler channel geometries and high-volume production. Vacuum brazing achieves better joint integrity and dimensional accuracy for complex geometries — critical when you have bi-directional internal fins and tight channel tolerances. The tradeoff is lower batch throughput and higher unit cost. For OEM programs targeting strict thermal specs (ΔT ≤2 K) at moderate annual volumes, vacuum brazing is the right process. For high-volume programs where 3–5 K uniformity is acceptable, conventional brazing is the economically sensible choice.
Q: What standard governs thermal performance testing for stationary storage battery packs in China?
A: The primary reference is GB/T 36276-2023, which covers lithium-ion batteries for power storage applications and includes charge/discharge performance, capacity, and cycle life test protocols. For international export, you’ll also need to consider IEC 62619 for industrial safety and UN 38.3 for transport certification — both of which have thermal performance implications at the cell and pack level.
Q: Can I use the same cooling plate design for both charging and discharging thermal loads?
A: Yes, but size it for discharge. Test data consistently shows discharge generates higher and more variable thermal loads than charge in lithium-ion chemistry — with a characteristic mid-cycle temperature plateau followed by a late-discharge temperature rise that doesn’t appear in the charge curve. If your cooling plate is validated only against charge-cycle temperatures, you may be underestimating peak thermal loads by several degrees. Always require discharge-cycle temperature data in your supplier qualification package.
For deeper context on related cell-level thermal and structural topics, see our guides on battery pack enclosure and IP rating design and series-parallel cell configuration engineering.
Published by compactbess.com Technical Team | Request a sourcing quote
Data source: Thermal Performance and Structural Integrity Evaluation of Liquid Cooling Plate Designs for Stationary Energy Storage Battery Packs, L. Yang et al., Journal of the Electrochemical Society, 2024


