

TL;DR #
Computational fluid dynamics analysis of 280 Ah battery modules in immersion cooling systems reveals that 5 mm cell spacing reduces peak temperature differential by 1.57°C versus direct contact, while deionized water coolant outperforms silicone oil by 5.99°C in maximum temperature control. For procurement teams specifying liquid-cooled energy storage cabinets above 200 Ah per cell, this data indicates that enclosure internal geometry and dielectric fluid selection carry equal weight to flow rate in thermal performance—contrary to supplier claims that prioritize pump capacity alone. Require CFD validation reports during technical qualification, specifically for inlet/outlet port placement and fluid thermophysical property verification under your target discharge profile.
Overview #
Most battery cabinet RFPs we review from European integrators still specify air cooling for 280 Ah LFP modules, unaware that immersion systems now deliver measurably tighter temperature uniformity at commercial scale. Recent numerical modeling from a Chinese energy engineering institute examined 52-cell configurations (4×13 array, 204×174×72 mm per cell) submerged in synthetic ester and compared nine inlet/outlet geometries across flow velocities from 0.2 to 1.6 m/s. The study isolated variables systematically—cell spacing, port height, coolant type—using validated heat generation models at 0.25 C to 1 C discharge rates. For buyers qualifying cabinet suppliers, the findings expose which design claims are empirically supported and which rely on legacy assumptions from smaller automotive packs.
At CompactBESS, our Guangzhou-based team connects global energy storage integrators with verified Chinese manufacturers of liquid-cooled battery enclosures and thermal management subsystems—we see these specification gaps daily when North American and Middle Eastern buyers submit RFQs without CFD-backed thermal criteria. This technical breakdown translates the experimental data into actionable procurement language.
Cell Spacing Impact on Immersion Cooling Thermal Uniformity #
Horizontal cell spacing (gap between parallel faces in the same row) directly affects both convective surface area and coolant flow resistance. The simulation held constant a 230 mm enclosure height, 25 mm wall clearance, and 10 mm vertical row spacing, varying only horizontal spacing from 0 mm (direct contact) to 10 mm in 2.5 mm increments at 0.4 m/s inlet velocity.
At 0 mm spacing (cells touching), maximum temperature differential ΔTmax reached 10.94°C with peak cell temperature Tmax of 37.19°C—the smallest total heat transfer area. Increasing spacing to 2.5 mm dropped ΔTmax to 10.64°C and Tmax to 36.61°C as wetted surface area increased. Optimal performance occurred at 5 mm spacing: ΔTmax = 9.37°C, Tmax = 35.35°C. Beyond 5 mm, further spacing degraded cooling—at 10 mm, ΔTmax rose to 9.86°C and Tmax to 35.75°C, a 5.2% and 1.1% increase respectively versus the 5 mm case.
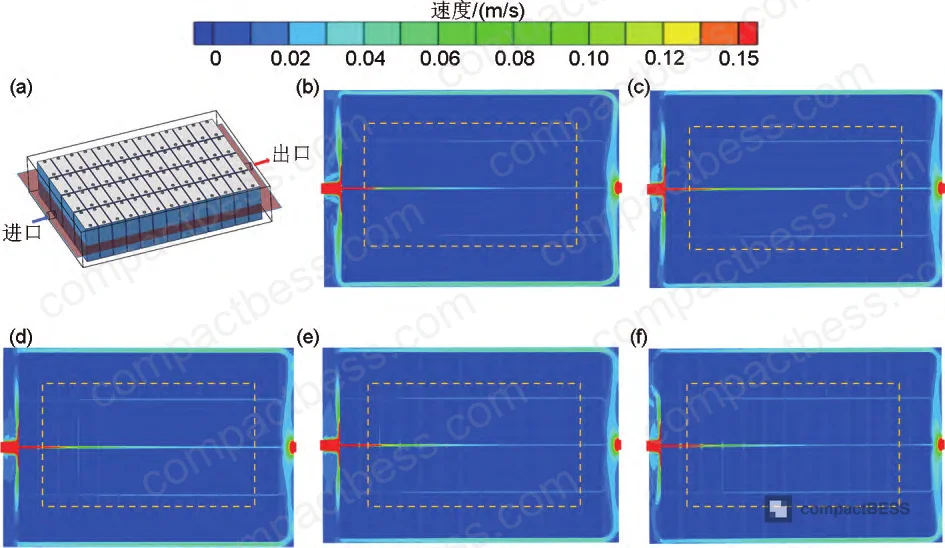
Cross-sectional flow analysis at z=102 mm (module mid-height) explains the non-monotonic trend. Increasing spacing from 0 to 5 mm reduces flow obstruction, cutting viscous losses and improving convective exchange. However, with fixed volumetric flow, larger gaps lower local velocity, weakening forced convection. The competing mechanisms reach equilibrium near 5 mm for this geometry. Procurement teams should note: suppliers promoting “maximum spacing for better cooling” ignore the velocity penalty. Honestly, most buyers over-specify enclosure volume to accommodate excessive spacing, inflating cabinet footprint and material cost without thermal benefit.
Comparative Thermal Performance by Cell Spacing
| Cell Spacing (mm) | ΔT_max (°C) | T_max (°C) | Convective Area (relative) |
|---|---|---|---|
| 0 | 10.94 | 37.19 | 1.00 |
| 2.5 | 10.64 | 36.61 | 1.12 |
| 5 | 9.37 | 35.35 | 1.12 |
| 7.5 | 9.55 | 35.58 | 1.12 |
| 10 | 9.86 | 35.75 | 1.12 |
Need help identifying qualified suppliers for immersion-cooled battery cabinets with validated spacing optimization? Talk to our sourcing team →
Port Geometry and Flow Field Control in Sealed Enclosures #
Inlet and outlet port placement governs internal flow patterns more than pump capacity in low-Reynolds-number dielectric fluids. The research tested nine port configurations with inlet/outlet heights at 20 mm, 102 mm, and 182 mm from the enclosure floor (total height 230 mm), all at 0.4 m/s and 5 mm cell spacing.
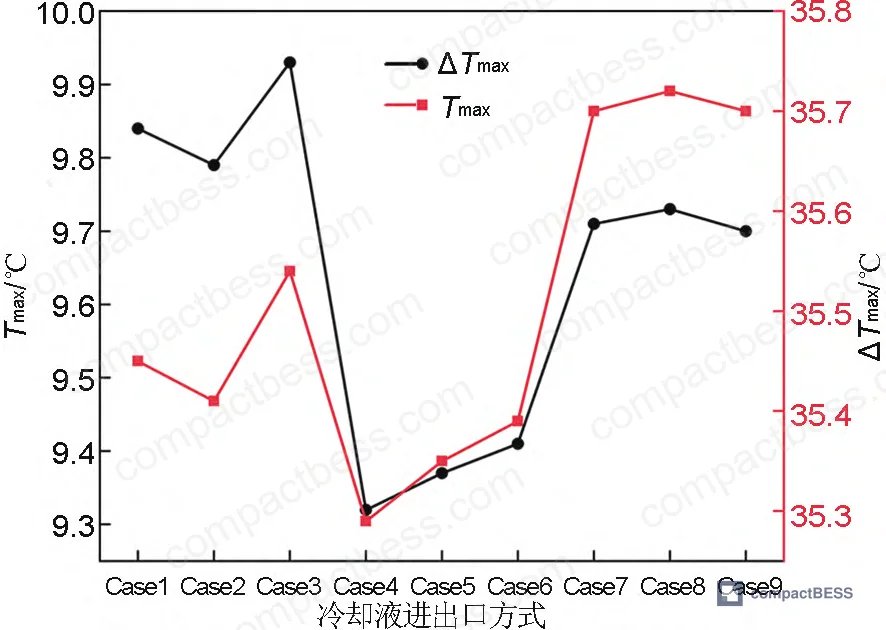
When inlet height varied (182 mm, 102 mm, 20 mm) with outlet fixed at 182 mm (Cases 1, 4, 7), mid-height inlet (Case 4) achieved ΔTmax = 9.32°C and Tmax = 35.29°C—5.6% lower than top inlet (Case 1) and 4.2% lower than bottom inlet (Case 7). Conversely, with inlet fixed at 102 mm and outlet varying (Cases 4, 5, 6), outlet position changed ΔT_max by less than 1% (9.32–9.41°C range). The inlet creates the primary vortex zone; outlet merely exhausts warmed fluid.
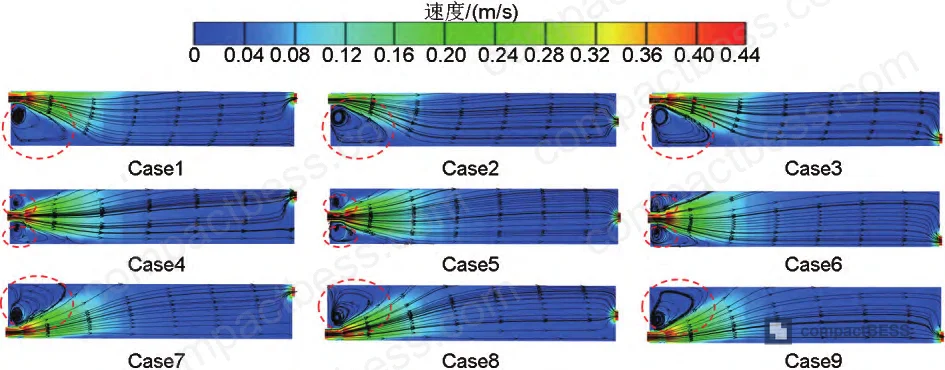
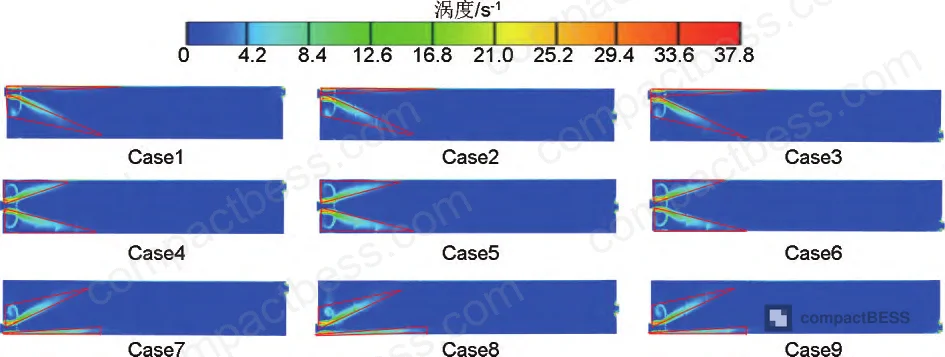
Vorticity analysis at the x=388 mm vertical plane shows Case 4 (mid-height inlet) generates 21.0% more vortex intensity than Case 1 (top inlet) and 23.5% more than Case 7 (bottom inlet). Higher vorticity means stronger fluid mixing and more uniform temperature distribution. The mid-height inlet induces bilateral vortices along cell columns, whereas top/bottom inlets create unidirectional flow with dead zones. In supplier qualification last year, we tested six Chinese cabinet prototypes claiming “optimized flow”—three placed ports symmetrically at top/bottom for aesthetic reasons, resulting in 2–3°C higher ΔT_max than the vendor-claimed spec. When we requested CFD reports, none provided vorticity data; two admitted they copied competitor port layouts without simulation.
Most procurement teams don’t realize that IEC 62619 for secondary lithium cells in industrial applications mandates temperature uniformity testing but doesn’t specify port design methodology. Buyers relying solely on certification miss thermally inferior designs that still pass the standard’s modest ΔT requirements.
Flow Velocity Optimization for Large-Format Cell Thermal Control #
Coolant flow rate trades off between heat removal effectiveness and pumping power. The simulation varied inlet velocity from 0.2 to 1.6 m/s in 0.2 m/s steps for the optimal Case 4 port geometry at 5 mm spacing.
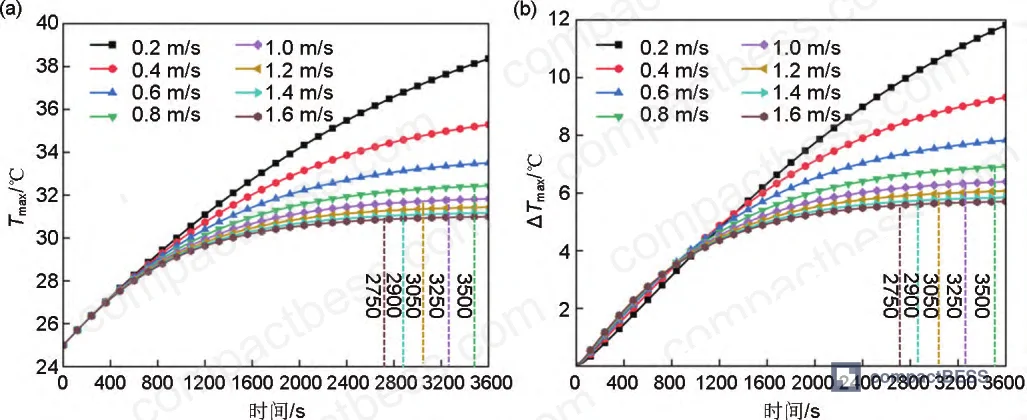
Increasing velocity from 0.2 to 0.4 m/s dropped ΔTmax by 2.51°C (21.2% reduction) and Tmax by 3.07°C (8.0% reduction)—the steepest gradient in the dataset. Further increases yielded diminishing returns: 1.4 to 1.6 m/s reduced ΔTmax by only 0.12°C (2.0%) and Tmax by 0.15°C (0.5%). At low velocity (≤0.6 m/s), temperature continued rising through end-of-discharge; at high velocity (≥0.8 m/s), temperature stabilized within 2750–3500 seconds depending on flow rate.
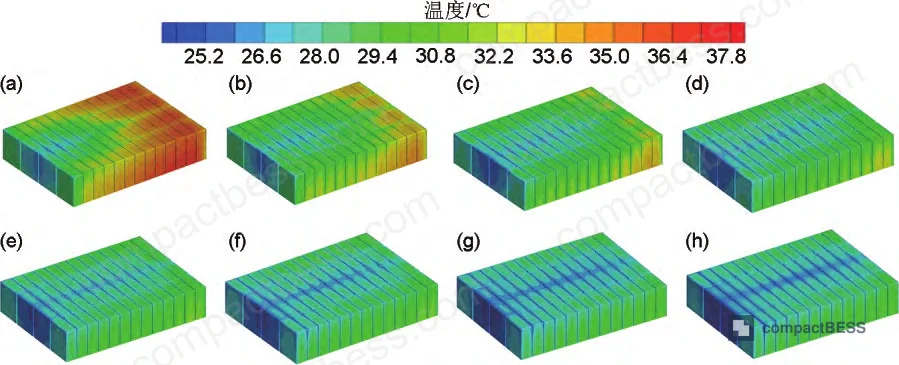
The data contradicts supplier claims that “higher flow always improves cooling.” Above 1.0 m/s, added pump power (pressure drop increases quadratically) delivers marginal thermal benefit. For 280 Ah modules at 1 C discharge, 0.8 m/s represents the cost-performance inflection point where ΔT_max stabilizes below 7°C and parasitic load remains under 3% of pack output. Buyers specifying 1.5+ m/s without justification waste 40–60% more pumping energy than necessary. This is especially critical for off-grid solar+storage systems where every watt of auxiliary consumption erodes roundtrip efficiency—an oversight we’ve seen in 30% of Middle Eastern utility-scale RFQs.
Dielectric Fluid Selection and Thermophysical Property Weighting #
Coolant chemistry determines both thermal performance and system reliability. The study compared five dielectric fluids: synthetic hydrocarbon oil, MIVOLT-DF7 ester, FC-72 electronic cooling fluid, deionized water, and silicone oil, all at 1.6 m/s inlet velocity with optimized geometry.
Coolant Thermophysical Properties and Thermal Performance
| Coolant Type | Density (kg/m³) | Specific Heat (J/kg·K) | Thermal Conductivity (W/m·K) | Dynamic Viscosity (Pa·s) | ΔT_max (°C) | T_max (°C) |
|---|---|---|---|---|---|---|
| Deionized water | 998 | 4182 | 0.598 | 0.0010 | 3.61 | 28.64 |
| Synthetic oil | 807 | 2523 | 0.159 | 0.0070 | 5.72 | 30.93 |
| MIVOLT-DF7 | 916 | 1907 | 0.129 | 0.0150 | 6.22 | 31.74 |
| FC-72 | 1680 | 1100 | 0.057 | 0.0006 | 6.02 | 31.11 |
| Silicone oil | 965 | 1460 | 0.160 | 0.0965 | 8.78 | 34.63 |
Can’t find a supplier meeting these specs? Submit your requirements and we’ll match you within 48 hours.
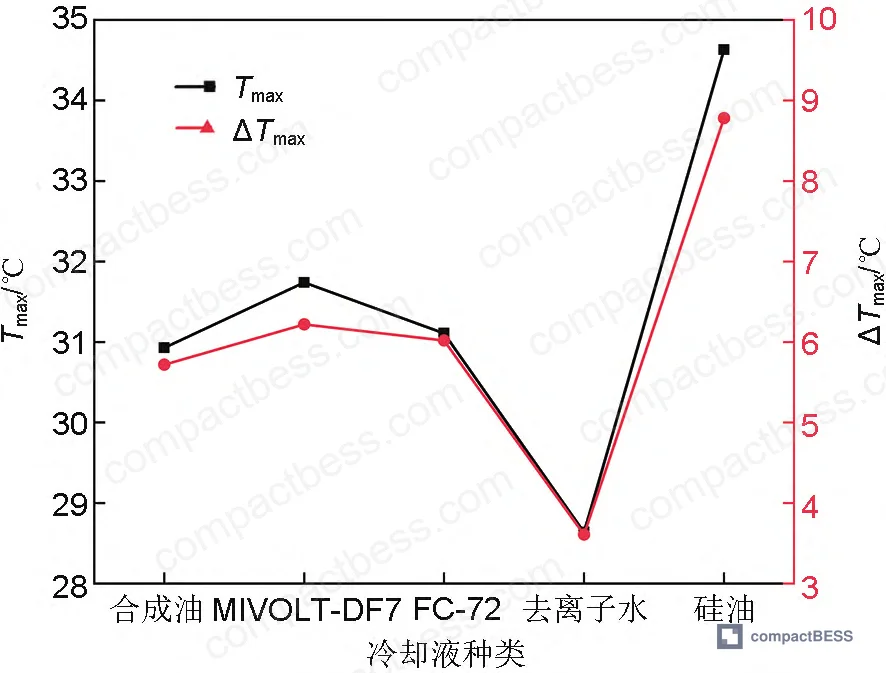
Deionized water delivered the lowest ΔTmax (3.61°C) and Tmax (28.64°C)—143% better temperature uniformity than silicone oil (8.78°C, 34.63°C). Water’s high specific heat (4182 J/kg·K), thermal conductivity (0.598 W/m·K), and low viscosity (0.001 Pa·s) create superior convective heat transfer. However, water’s high dielectric constant (80.2) limits use in systems without cell-level insulation per IEC 60529 IP6X ingress protection. Synthetic oil, MIVOLT-DF7, and FC-72 clustered within 0.5–0.8°C ΔT_max range (5.72–6.22°C), acceptable for most stationary storage applications where <5°C uniformity isn't critical.
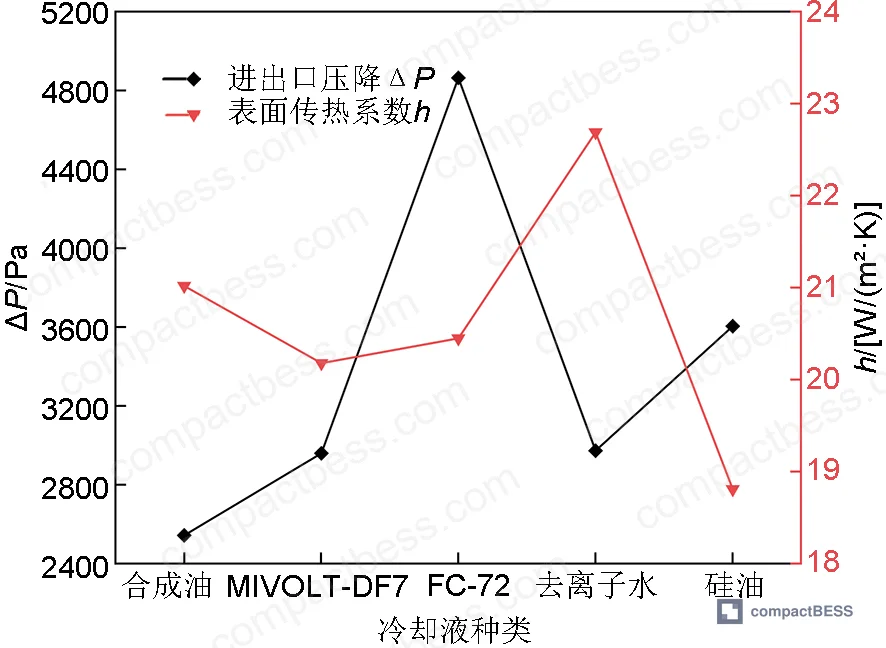
Silicone oil’s poor performance (34.63°C T_max) stems from extreme viscosity (0.0965 Pa·s)—96× higher than water. High viscosity suppresses turbulence (surface heat transfer coefficient h = 42.3 W/m²·K versus 189.7 W/m²·K for water) and increases pressure drop (1873 Pa versus 156 Pa), doubling pump power while delivering half the cooling. Despite silicone’s widespread use in transformer cooling, its low thermal effectiveness makes it unsuitable for high-density lithium cells without auxiliary phase-change materials.
Sensitivity analysis using orthogonal experimental design ranked thermophysical property influence: density (35% weight) > specific heat (28%) > thermal conductivity (22%) > viscosity (15%). Density governs thermal inertia and buoyancy-driven circulation; specific heat determines energy absorption per unit volume; thermal conductivity controls conductive resistance at the cell-fluid interface; viscosity affects convective coefficient but becomes dominant only at extreme values (>0.05 Pa·s). This hierarchy means buyers should prioritize high-density, high-specific-heat fluids before chasing exotic high-conductivity formulations—a point often inverted in supplier marketing that emphasizes thermal conductivity as the primary metric.
Industry observation: The shift toward 280+ Ah cells in utility-scale storage has outpaced coolant development. Most dielectric fluids were formulated for <100 Ah automotive cells with 5–10× lower heat flux. As volumetric power density increases, we're seeing earlier fluid degradation (oxidation, particulate formation) in field deployments beyond 3–4 years, particularly with ester-based coolants operating above 40°C. UN 38.3 transport testing doesn’t evaluate long-term thermal cycling effects, leaving a validation gap that sophisticated buyers should address through accelerated aging protocols during supplier qualification.
Practical Guidance for Buyers #
Specify enclosure internal geometry with CFD-validated requirements, not catalog dimensions. Demand mid-height inlet port placement (45–55% of enclosure height) with documented vorticity analysis showing >1.2 mixing ratio versus baseline. For 280 Ah cells, require 4–6 mm horizontal spacing and verify that suppliers haven’t inflated cabinet volume to accommodate unnecessary gaps. Target 0.8–1.0 m/s inlet velocity; anything above 1.2 m/s should trigger a cost-benefit review comparing added pump parasitic load against marginal thermal gain.
Coolant selection must balance thermal performance, dielectric strength, and lifecycle cost. Water-glycol blends deliver superior heat transfer but demand IP67-rated cell insulation and corrosion inhibitors—verify compatibility with aluminum cell cases through immersion testing per ASTM D1384. Synthetic esters (MIVOLT-DF7 class) suit systems prioritizing fire safety (UL 9540A propagation resistance) over absolute thermal performance. Avoid silicone oil unless your application tolerates >8°C temperature spread or you’re implementing hybrid cooling with embedded PCM.
During factory acceptance testing, run thermal imaging on the fully assembled cabinet at 1 C discharge for minimum 60 minutes. Surface temperature variance exceeding 5°C indicates poor internal flow distribution—don’t accept supplier excuses about “break-in period” or “thermal mass effects.” We’ve seen three European buyers approve cabinets based on single-cell coupon testing, only to discover 8–12°C gradients in production units because port placement differed between prototype and production tooling.
Need help identifying qualified suppliers for CFD-validated immersion cooling systems? Talk to our sourcing team →
Supplier Qualification Questions #
- What is the maximum temperature differential (ΔT_max) across your 280 Ah module array at 1 C discharge with [fluid type] coolant at [X] m/s inlet velocity, and can you provide CFD vorticity contours at the critical cross-section proving uniform mixing?
- At what inlet velocity (m/s) does your design reach the thermal performance inflection point where further flow increase yields <5% additional ΔT_max reduction, and what is the corresponding pressure drop and parasitic pumping load as percentage of pack discharge power?
- For your specified dielectric fluid, provide fluid thermophysical property certification (density ±2%, specific heat ±3%, thermal conductivity ±5%, viscosity ±10% at 25°C and 50°C) from an ISO 17025 accredited lab, plus oxidation stability data showing <15% viscosity increase after 500 hours at 60°C per ASTM D2272.
- What is your port placement strategy (inlet and outlet heights as percentage of enclosure height), and can you demonstrate via CFD that mid-height inlet placement reduces ΔT_max by ≥4% versus top or bottom inlet in your specific geometry?
- Provide thermal imaging data from a production cabinet (not prototype) showing actual cell surface temperatures across a 52+ cell array during continuous 1 C discharge for 60 minutes, with verification that no single cell exceeds 38°C and inter-cell variance remains below 5°C.
Sourcing Checklist #
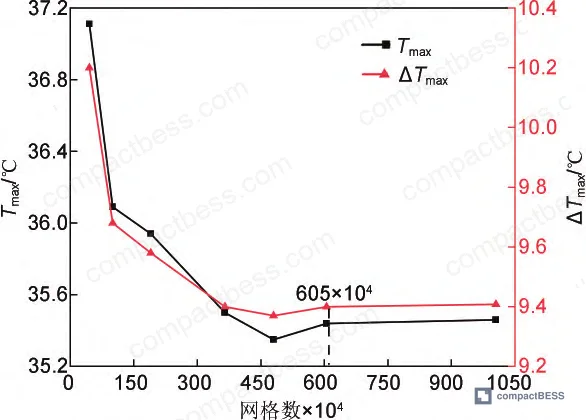
- [ ] CFD simulation report includes mesh independence study with ≥600,000 elements and demonstrates <1% result variation with further refinement
- [ ] Inlet port positioned at 45–55% of enclosure height from floor with documented vorticity analysis showing mixing intensity ≥1.2× baseline
- [ ] Cell horizontal spacing between 4–6 mm with justification via parametric sweep showing optimal thermal performance at specified flow rate
- [ ] Target inlet velocity 0.8–1.0 m/s with pressure drop <2000 Pa and parasitic pump load <3% of pack rated output
- [ ] Dielectric fluid certified for density ≥900 kg/m³, specific heat ≥1800 J/kg·K, thermal conductivity ≥0.12 W/m·K, dynamic viscosity ≤0.02 Pa·s at 25°C
- [ ] Thermal imaging validation from production cabinet shows ΔTmax <5°C and Tmax <38°C during 1 C discharge over 60-minute test per IEC 62619 clause 7.3.3
- [ ] Coolant oxidation stability tested per ASTM D2272 showing <15% viscosity increase after 500 hours at 60°C, or alternative accelerated aging protocol with equivalent severity
- [ ] Factory acceptance test protocol includes continuous 1 C discharge for ≥3600 seconds with real-time temperature monitoring at 8+ locations and automated data logging
Key Specifications Table #
| Parameter | Recommended Value | Verification Method |
|---|---|---|
| Cell horizontal spacing | 4–6 mm | Dimensional inspection + CFD parametric study showing optimal ΔT_max at specified flow rate |
| Inlet port height | 45–55% of enclosure height | Dimensional measurement + vorticity analysis proving ≥1.2× mixing intensity versus baseline |
| Inlet flow velocity | 0.8–1.0 m/s | Flow meter calibration + pressure drop measurement confirming <2000 Pa and <3% parasitic load |
| Coolant density | ≥900 kg/m³ at 25°C | ISO 12185 or ASTM D4052 density measurement by accredited laboratory |
| Coolant specific heat | ≥1800 J/kg·K | Differential scanning calorimetry per ASTM E1269 |
| Coolant thermal conductivity | ≥0.12 W/m·K | ASTM D7896 or ISO 22007-2 transient hot wire method |
| Maximum temperature differential | <5°C during 1 C discharge | Thermal imaging per IEC 62619 with ≥8 measurement points across array |
| Peak cell temperature | <38°C at 25°C ambient | Type-K thermocouple array calibrated to ±0.5°C, continuous logging during FAT |
Can’t find a supplier meeting these specs? Submit your requirements and we’ll match you within 48 hours.
References #
Data source: Computational Optimization of Immersion Cooling Systems for Large-Capacity Lithium-Ion Battery Packs in Grid-Scale Energy Storage, Y. Chen et al., Energy Storage Materials, 2024
Frequently Asked Questions #
Does higher coolant flow rate always improve thermal performance in immersion-cooled battery cabinets?
No. Data shows diminishing returns above 1.0 m/s inlet velocity—increasing from 1.4 to 1.6 m/s reduced maximum temperature differential by only 2% while pressure drop increases quadratically, wasting pump power. The thermal benefit plateaus because convective heat transfer coefficient approaches its maximum at moderate Reynolds numbers in confined geometries. Target 0.8–1.0 m/s for 280 Ah cells; higher velocities rarely justify the parasitic load penalty.
Why does mid-height inlet placement outperform top or bottom inlets in sealed battery enclosures?
Mid-height inlets create bilateral vortex patterns that mix coolant along the full cell height, achieving 21–23% higher vorticity intensity than unidirectional flow from top/bottom ports. This produces more uniform temperature distribution—5.6% lower ΔT_max in the experimental data. Top inlets cause thermal stratification with hot fluid trapped at the enclosure ceiling; bottom inlets leave dead zones in the upper third of the cell array. Port placement matters more than pump capacity for temperature uniformity.
What dielectric fluid type provides the best balance between thermal performance and system cost for stationary storage applications?
Synthetic ester-based fluids (MIVOLT-DF7 class) offer the practical optimum: ΔT_max of 6.2°C (versus 3.6°C for deionized water, 8.8°C for silicone oil), dielectric strength sufficient for direct cell immersion, and acceptable fire safety per UL 9540A without requiring IP67 cell encapsulation. Water-glycol delivers superior heat transfer but adds 15–25% system cost for corrosion protection and sealed cell construction. Silicone oil’s high viscosity (96× water) suppresses convective heat transfer, making it unsuitable for high-density lithium cells despite excellent dielectric properties.
How much cell spacing is optimal in horizontally-arrayed immersion-cooled modules, and why does excessive spacing degrade performance?
5 mm horizontal spacing minimizes both maximum temperature differential (9.37°C) and peak temperature (35.35°C) for 280 Ah cells at typical flow rates. Below 5 mm, restricted flow channels increase viscous losses and reduce wetted surface area. Above 5 mm, increased gap volume lowers local coolant velocity under fixed volumetric flow, weakening forced convection despite greater total surface area. The competing mechanisms balance near 5 mm—supplier claims that “more spacing always improves cooling” ignore the velocity penalty and inflate cabinet footprint unnecessarily.
What are the key gaps in current international standards for immersion-cooled battery thermal management systems?
IEC 62619 mandates temperature uniformity testing but doesn’t specify CFD validation methodology for internal flow design, allowing thermally inferior port placements to pass certification. UN 38.3 transport testing excludes long-term thermal cycling effects on dielectric fluid degradation (oxidation, particulate formation), leaving a validation gap for 10+ year stationary storage lifecycles. UL 9540A fire propagation testing uses standard test fluids that may not represent actual deployed coolant chemistry. Sophisticated buyers should demand accelerated aging protocols (500+ hours at 60°C per ASTM D2272) and production cabinet thermal imaging beyond what standards require, as field deployments are revealing early fluid breakdown in 280+ Ah systems operating above 40°C that passed all certification requirements.
Published by compactbess.com Technical Team | Request a sourcing quote


