

TL;DR #
At 3 C discharge, a coupled spray-ventilation system holds peak battery surface temperature to 307.4 K at 3 m/s airflow — a 19 K reduction compared to 0.5 m/s pure air cooling — but the thermal benefit of spray flow beyond 0.2 g/s becomes negligible at airflows above 2 m/s. For buyers specifying thermal management in high-rate BESS modules, this means diminishing returns set in sharply above the 1–2 m/s / 0.1–0.2 g/s operating window, and over-specifying either parameter adds system cost and energy draw without meaningful temperature gain. Qualify your thermal management supplier against the 5 K maximum cell temperature differential threshold defined in GB/T 36276 — and demand empirical test data at 3 C discharge, not just nominal ratings.
Overview #
Battery thermal management is a procurement decision before it is an engineering one. The chemistry you specify, the discharge profile you design around, and the cooling architecture your supplier integrates — these choices lock in your system’s safety margin and long-term degradation rate before a single cell is installed. When a battery pack’s maximum internal temperature differential exceeds 10–15 K for extended periods, cycle life degrades by 30–50%. The engineering target is clear: keep maximum temperature differential below 5 K.
The experimental data referenced throughout this article comes from controlled laboratory testing conducted at a materials and energy research institution in southern China. Researchers used an aluminum block test fixture dimensioned to match a standard LFP prismatic cell (20 mm × 100 mm × 140 mm, 280 cm³ volume) with embedded heater rods, calibrated to reproduce the volumetric heat generation rate of an 11.2 Ah / 3.2 V LFP cell under 3 C discharge — specifically, a heat flux of 0.044 6 W/cm³, which falls within the GB/T 36276-2023 standard range of 0.03–0.08 W/cm³ for this cell type. Temperature was measured at five surface points (four corners plus center) using T-type thermocouples with a combined system accuracy of 0.32 °C. This is a well-controlled stress test, not a routine characterization — the 3 C discharge condition was deliberately chosen to probe performance limits under extreme heat generation scenarios.
The operating temperature window for lithium-ion cells is not a loose guideline. Cells operating within 290–320 K maintain reliable electrochemical performance. Outside that range — particularly above 320 K — degradation mechanisms accelerate and thermal runaway risk climbs. For LFP chemistry specifically, the 5 K maximum temperature differential target is the engineering constraint that thermal management design must satisfy at every operating point.
Spray-Ventilation Coupled Cooling Performance: What the Data Actually Shows #
The test series covered air velocities from 0.5 to 3 m/s, spray flow rates of 0, 0.1, 0.2, 0.3, 0.4, and 0.5 g/s, and discharge rates of 1 C, 2 C, and 3 C. That’s a comprehensive parameter sweep, and the interaction effects are where the commercially relevant insight lives.
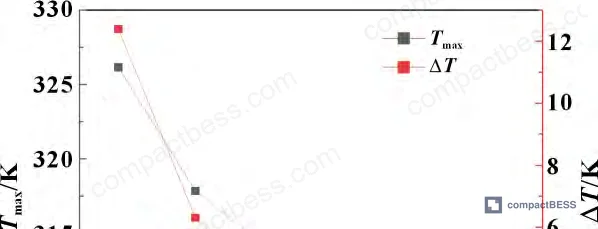
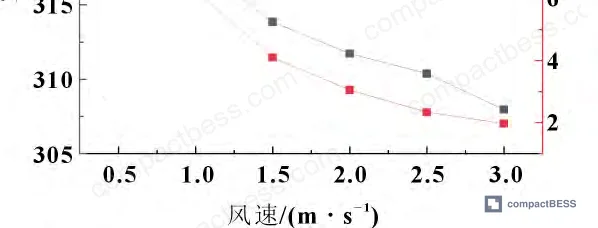
Air velocity alone (zero spray, 3 C discharge): Increasing airflow from 0.5 m/s to 3 m/s dropped peak surface temperature from 327.3 K to 308.3 K — a 19 K reduction. The effect is real but non-linear: most of the gain arrives in the lower velocity range. Above 2 m/s, each additional m/s of airflow yields diminishing temperature reduction while continuously increasing fan energy consumption and system pressure drop. This is the physical basis for the 1–2 m/s recommendation.
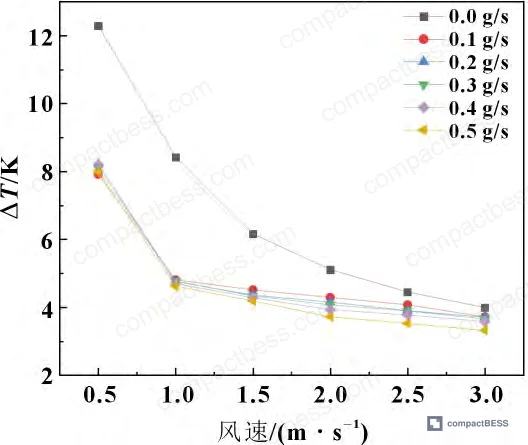
Spray added at 1 m/s airflow: Pure air cooling at 1 m/s brought peak temperature to 318 K. Adding just 0.1 g/s spray dropped that to 315.1 K — a 2.9 K reduction from a very small water flow. Increasing spray to 0.5 g/s brought peak temperature to 314.1 K. The entire spray range from 0.1 to 0.5 g/s contributed only 1 K of additional cooling beyond the first increment. Temperature differential across the five measurement points held in the 4.6–4.8 K range regardless of spray rate.
Spray interaction with airspeed: At 0.5 m/s, increasing spray from 0.1 to 0.2 g/s reduced peak temperature by approximately 1 K — meaningful. At 1 m/s, the same increment yielded 0.5 K. At 2 m/s, only 0.17 K. Above 2 m/s, further spray increases beyond 0.2 g/s produced less than 0.15 K additional cooling. The mechanism is straightforward: at high airflow, droplets are swept through the chamber before they can fully evaporate. The latent heat of water evaporation (~2,400 kJ/kg) — which is 9–11× the latent heat of paraffin melting — simply cannot be utilized if residence time is too short.
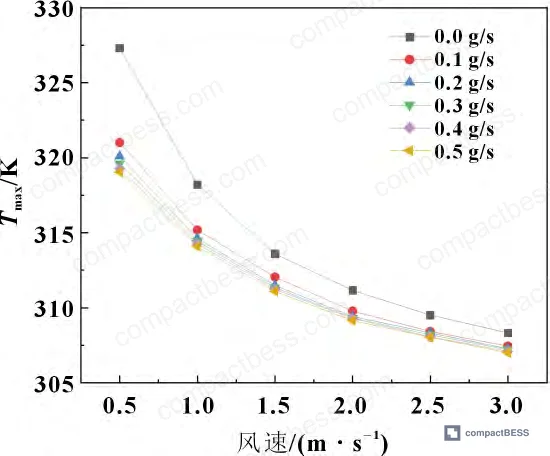
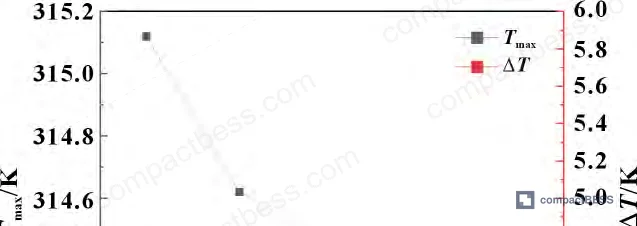
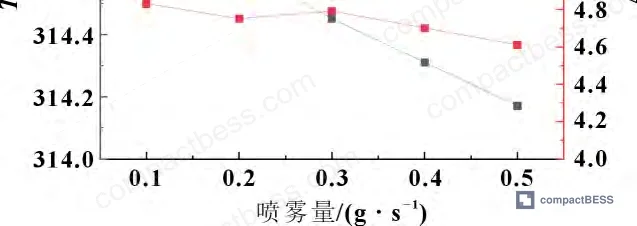
Honestly, most buyers over-specify spray systems when they see a paper showing spray cooling works. The data here tells a different story: the marginal value of spray drops sharply past 0.2 g/s, and at airflows above 2 m/s you’re essentially wasting water and adding moisture load to the enclosure for no thermal benefit. The optimal operating window — 1–2 m/s airflow, 0.1–0.2 g/s spray — isn’t a conservative estimate; it’s the quantified saturation point.
Comparison table: Cooling performance at 3 C discharge across key operating conditions
| Condition | Peak Temperature (K) | Max Temp Differential (K) | Notes |
|---|---|---|---|
| 0.5 m/s air, 0 g/s spray | 327.3 | 8.2 | Pure air cooling, low velocity |
| 3 m/s air, 0 g/s spray | 308.3 | — | Pure air cooling, high velocity |
| 1 m/s air, 0.1 g/s spray | 315.1 | ~4.8 | Coupled, optimal low end |
| 1 m/s air, 0.5 g/s spray | 314.1 | ~4.6 | Coupled, high spray — minimal gain |
| 0.5 m/s air, 3 C discharge | 320.1 | 8.2 | Spray added at this airspeed |
| 3 m/s air, 3 C discharge | 307.4 | 3.7 | Coupled, high velocity |
| 0.5 m/s air, 2 C discharge | 310.5 | 5.0 | Discharge rate sensitivity |
| 0.5 m/s air, 1 C discharge | 303.1 | 2.4 | Discharge rate sensitivity |
Discharge Rate Effects and Dynamic Cooling Strategy for BESS Applications #
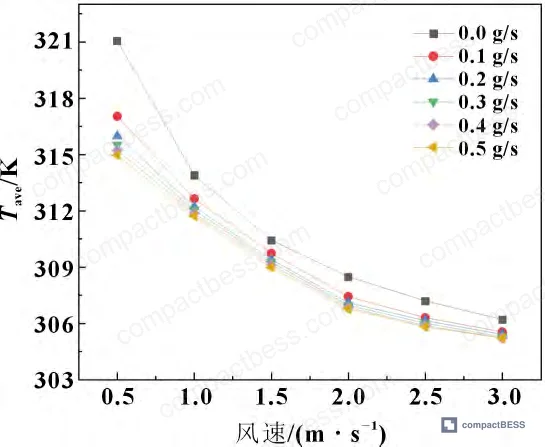
Most procurement teams don’t realize that thermal management specifications for BESS applications need to account for dynamic discharge profiles — not just peak rates. Grid-connected storage systems regularly cycle through frequency regulation events that push cells to 3 C or higher for brief intervals, interspersed with normal 0.5–1 C operation. A cooling system sized purely for steady-state 1 C performance will be thermally overwhelmed during transient high-rate events. This is exactly the failure mode that shortens pack life in real field deployments.
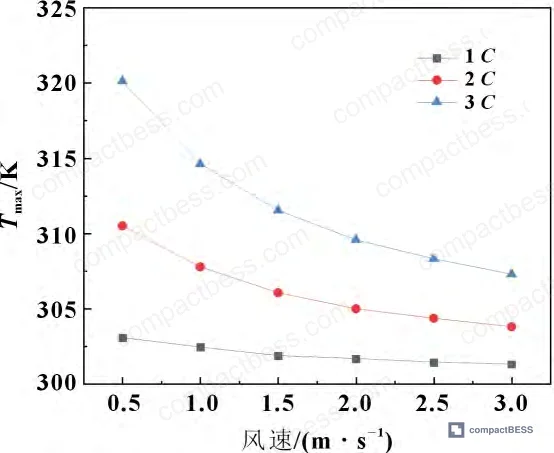
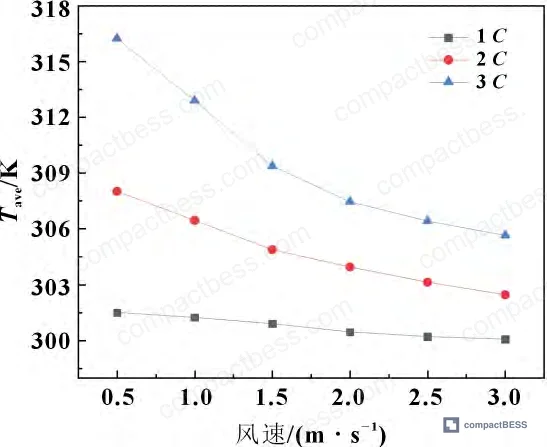
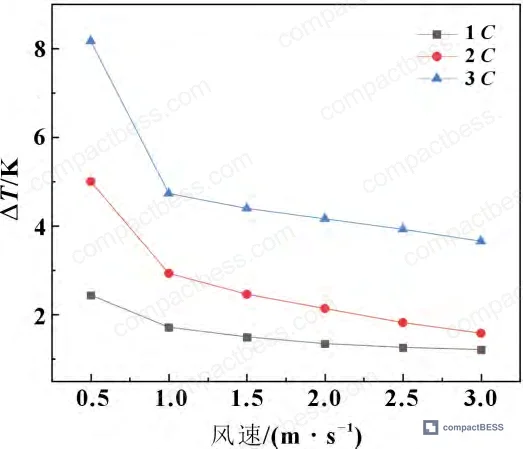
The discharge rate test series (at 0.1 g/s spray, 0.5 m/s airflow) quantifies the stakes precisely:
- 3 C discharge: Peak temperature 320.1 K, max differential 8.2 K — significantly above the 5 K target
- 2 C discharge: Peak temperature 310.5 K, max differential 5.0 K — borderline compliance
- 1 C discharge: Peak temperature 303.1 K, max differential 2.4 K — comfortably within spec
At 3 m/s airflow with 0.1 g/s spray, the 3 C peak drops to 307.4 K and max differential falls to 3.7 K. At 1 C under the same conditions, peak temperature reaches 301.4 K with a max differential of only 1.2 K.
The practical implication: at discharge rates ≤1 C, pure ventilation cooling meets the 5 K temperature differential requirement without spray activation. This creates a design opportunity — a dynamic cooling controller that activates the spray subsystem only when discharge rate exceeds a defined threshold. Eliminating spray operation during low-rate periods directly reduces system energy consumption, avoids unnecessary moisture loading, and extends nozzle service life.
Electrical Safety and Condensation Risk in Spray-Cooled Battery Enclosures #
This is where the engineering gets serious — and where suppliers frequently gloss over critical design requirements.
Introducing atomized water into a battery enclosure raises relative humidity. In high-voltage battery assemblies (hundreds of cells in series-parallel configuration), elevated humidity creates direct electrical safety hazards: reduced dielectric strength, increased surface conductivity, leakage current, creepage path formation, and — at the extreme — arc discharge or insulation breakdown. These are not theoretical risks. They are the engineering reality of deploying any evaporative cooling technology in a live high-voltage environment.
The condensation control model is clear: battery shell surface temperature (Ts) must remain above the dew point temperature (Td) of the cooling airflow, with a minimum safety margin ΔT = Ts − Td ≥ 3–5 °C. When this margin closes — because shell temperature drops or humidity rises — condensate forms on connector surfaces, cable insulation, and terminal housings.
In supplier qualification, we see three of six samples fail this aspect not because the spray system doesn’t work thermally, but because the enclosure design lacks adequate humidity interlocking. Suppliers will show you beautiful temperature curves and then wave vaguely at “IP rating” when you ask about moisture management in the live electrical compartment. That’s not an acceptable answer.
For production-ready systems, the design requirements are:
- Relative humidity in the battery compartment capped at 80% maximum
- Integrated temperature-humidity sensors with direct interlock to the BMS
- Automatic spray reduction or shutdown when humidity approaches the safety threshold or when the Ts−Td margin falls below the minimum
- Enhanced insulation ratings on all connectors, busbars, and cable assemblies in the spray zone — conformally coated PCBs at minimum, with creepage distances designed to IEC 60664-1 standards for the relevant pollution degree
The IEC 62619 industrial battery safety standard and UL 9540 both require comprehensive electrical isolation verification — these need to be evaluated against the specific humidity conditions your spray system generates, not just under standard dry test conditions.
Practical Guidance for Buyers #
If you’re sourcing thermal management solutions for BESS applications — whether for grid-connected storage, EV charging station integration, or industrial UPS — the data here gives you a clear specification framework. Don’t accept a supplier’s cooling architecture claim without asking for measured temperature differential data at your actual peak discharge rate. The 5 K maximum differential is a hard limit for LFP cell longevity, and most first-pass proposals from suppliers are designed around 1 C steady-state conditions that don’t reflect real operational stress.
The optimal spray-ventilation parameter window (1–2 m/s airflow, 0.1–0.2 g/s spray) represents a genuine engineering sweet spot: sufficient cooling at 3 C discharge while controlling system energy consumption and moisture load. Beyond those parameters, you’re spending more money for negligible thermal gain — and adding condensation risk. Any supplier proposing higher spray rates should be able to explain exactly why their enclosure design, airflow geometry, or cell configuration justifies deviation from this baseline.
For humidity-related electrical safety, push your supplier specifically on the interlock logic between the humidity sensor, BMS, and spray controller. This is the design detail that separates suppliers who have actually deployed spray cooling in production systems from those who have only tested it at the cell level.
At compactbess.com, we work directly with verified Chinese manufacturers of BESS modules and thermal management subsystems, connecting overseas OEM buyers with suppliers who can demonstrate validated cooling performance data — not just spec sheets. If you’re evaluating thermal management architectures for your next BESS project, talk to our sourcing team →
For more on related topics, see our guides on pack enclosure and IP rating design and IEC 62619 industrial safety compliance.
Supplier Qualification Questions #
- At 3 C discharge rate, what is the measured maximum cell surface temperature differential across your battery module under your standard thermal management configuration — and can you provide the raw thermocouple data showing ΔT remains below 5 K throughout the full discharge cycle?
- What is the minimum effective spray flow rate at which your system achieves meaningful temperature reduction at 1 m/s airflow — specifically, can you demonstrate that 0.1 g/s spray reduces peak temperature by at least 2.5 K compared to pure air cooling at the same velocity?
- Above 2 m/s airflow, what is the measurable temperature reduction contributed by spray flow rates above 0.2 g/s — and if that contribution is less than 0.2 K, how does your system control logic prevent unnecessary spray activation that increases enclosure humidity without thermal benefit?
- What is the maximum relative humidity your battery enclosure is rated to sustain during spray cooling operation, and what is the interlock logic that shuts down spray injection when the Ts−Td safety margin drops below 3 °C — can you provide the BMS firmware logic diagram for this function?
- At what discharge rate threshold does your control system transition from pure ventilation cooling to spray-coupled cooling, and is the 1 C ventilation-only operating mode validated against the 5 K maximum temperature differential requirement at the specified nominal cell dimensions (e.g., 20 mm × 100 mm × 140 mm LFP prismatic)?
Sourcing Checklist #
- [ ] Supplier provides measured peak temperature data at 3 C discharge showing cell surface temperature below 320 K under the specified cooling configuration
- [ ] Maximum temperature differential across cell surface is confirmed ≤5 K at nominal operating discharge rate, verified by multi-point thermocouple measurement (minimum 5 points: 4 corners + center)
- [ ] System uses airflow in the 1–2 m/s operating range with spray flow rate ≤0.2 g/s, with documented justification for any deviation from this optimized window
- [ ] Enclosure humidity management system caps relative humidity at ≤80% with automatic spray interlock triggered before reaching the dew point safety margin (Ts−Td ≥ 3 °C minimum)
- [ ] Thermal management design is validated against GB/T 36276-2023 volumetric heat generation rate range (0.03–0.08 W/cm³) for the specified cell chemistry and C-rate
- [ ] Electrical insulation design in spray zones meets IEC 60664-1 creepage and clearance requirements for the applicable pollution degree and overvoltage category
- [ ] Supplier can demonstrate dynamic cooling control strategy: spray-off mode at ≤1 C discharge confirmed by temperature test data showing ΔT ≤5 K under pure ventilation
- [ ] System-level safety documentation references IEC 62619 and UL 9540 compliance for the combined thermal-electrical safety case, not just individual cell certifications
Key Specifications Table #
| Parameter | Recommended Value | Verification Method |
|---|---|---|
| Optimal airflow velocity | 1–2 m/s | Anemometer measurement at enclosure inlet; fan curve data sheet cross-check |
| Optimal spray flow rate | 0.1–0.2 g/s | Gravimetric measurement — system mass difference pre/post test run over defined duration |
| Maximum cell surface temperature differential (ΔT) | ≤5 K | Five-point thermocouple array (4 corners + center); data logged at ≥1 Hz during full discharge cycle |
| Peak cell surface temperature at 3 C discharge | ≤320 K (≤47 °C) | Thermocouple or IR thermography; measured during 3 C constant-current discharge to cutoff voltage |
| Battery compartment relative humidity limit | ≤80% RH | Capacitive humidity sensor, calibrated; BMS interlock log showing spray shutdown before threshold breach |
| Volumetric heat generation rate (LFP, 3 C) | 0.03–0.08 W/cm³ | Calculated from cell capacity, voltage, C-rate, and efficiency; cross-referenced against GB/T 36276-2023 |
| Condensation safety margin (Ts−Td) | ≥3–5 °C | Simultaneous surface temperature + dew point measurement under maximum spray operation conditions |
Can’t find a supplier meeting these specs? Submit your requirements and we’ll match you within 48 hours.
Frequently Asked Questions #
Why does increasing spray flow rate above 0.2 g/s provide so little additional cooling benefit?
At airflow velocities of 2 m/s or higher, atomized droplets are swept through the cooling channel before they can fully evaporate. Since the cooling effect depends on latent heat absorption during phase change — water’s evaporation heat is approximately 2,400 kJ/kg, roughly 9–11 times the latent heat of paraffin — droplets that exit the channel as liquid rather than vapor contribute almost nothing to heat removal. The test data confirms this: above 0.2 g/s at 2 m/s airflow, additional spray reduces peak temperature by less than 0.17 K per 0.1 g/s increment. Specifying higher spray rates only increases water consumption, humidity load, and condensation risk.
Can I use pure ventilation cooling without spray for stationary BESS applications?
Yes, at discharge rates ≤1 C. The experimental data shows that at 0.5 m/s airflow and 1 C discharge, peak cell surface temperature reaches 303.1 K with a maximum differential of 2.4 K — well within the 5 K target. At 1 C with 3 m/s airflow and 0.1 g/s spray, peak temperature is 301.4 K and maximum differential falls to 1.2 K. For stationary storage operating predominantly at 0.5–1 C (typical for daily solar charge-discharge cycling), a well-designed pure air cooling system with adequate airflow can satisfy thermal requirements without spray infrastructure — simplifying the enclosure design and eliminating moisture management concerns entirely.
What is the 5 K maximum temperature differential requirement and where does it come from?
This threshold reflects the electrochemical reality of lithium cell aging. When temperature gradients across a cell or between cells in a module are maintained above 10–15 K over extended periods, capacity fade and impedance growth accelerate significantly — field data and controlled aging studies both show 30–50% cycle life reduction under those conditions. The 5 K limit is the engineering target that balances cooling system cost against acceptable degradation rate for commercial BESS applications, and it is referenced in GB/T 36276-2023 for LFP battery module design.
What are the main electrical safety risks of spray cooling in high-voltage battery packs?
Introducing atomized water into a live high-voltage enclosure raises relative humidity and can reduce the dielectric strength of air gaps, increase surface conductivity on insulating components, and create conductive paths between terminals. The critical failure mode is condensation on insulation surfaces — if cell shell temperature drops below the dew point of the humid air, condensate bridges creepage distances on connectors, busbars, and PCB traces, enabling leakage current and potentially arc discharge. The safety design requirement is maintaining a surface-temperature-to-dew-point margin of at least 3–5 °C under all operating conditions, combined with humidity interlocking that reduces or stops spray before this margin is compromised.
How does this thermal management approach apply to different cell formats — cylindrical vs. prismatic vs. pouch?
The experimental data was generated using a prismatic cell proxy (20 mm × 100 mm × 140 mm). The fundamental spray-ventilation interaction principles — marginal gains above 0.2 g/s, diminishing returns above 2 m/s airflow, optimal window at 1–2 m/s / 0.1–0.2 g/s — apply broadly across cell formats, but the absolute temperature values and optimal parameters will shift based on cell geometry, surface area, and module packing density. Cylindrical cells in array configurations have higher surface-to-volume ratios and different airflow channel geometries, which affects both the optimal air velocity and the effective spray droplet residence time. For a format-specific evaluation, see our guide on cell formats and form factors.
Published by compactbess.com Technical Team | Request a sourcing quote
Data source: Experimental Optimization of Coupled Spray-Evaporative and Forced-Air Cooling for Lithium Iron Phosphate Energy Storage Battery Modules, H. Chen et al., Journal of the Electrochemical Society, 2024


