

TL;DR #
CFD simulation of a stamped liquid cooling channel design for 314 Ah LFP battery packs shows flow resistance of 9.828 kPa and maximum temperature delta of 1.40°C at 5 L/min inlet flow — but raising flow to 15 L/min increased pressure drop 6× while thermal improvement plateaued at 8%. Buyers chasing lower cell temperature by specifying higher coolant flow are wasting pump power and eroding system efficiency. Optimize channel geometry with turbulence-inducing convex structures in outlet branches rather than brute-forcing flow rate.
Overview #
Most procurement teams treating battery pack thermal management as a pump-and-pray exercise end up with oversized circulation systems that burn watts without proportional thermal benefit. Field evaluation of a 52-cell (314 Ah LFP) energy storage module using a novel stamped aluminum cold plate design revealed a non-linear relationship between coolant flow and temperature uniformity — one that contradicts the “more flow = better cooling” assumption embedded in many RFQs.
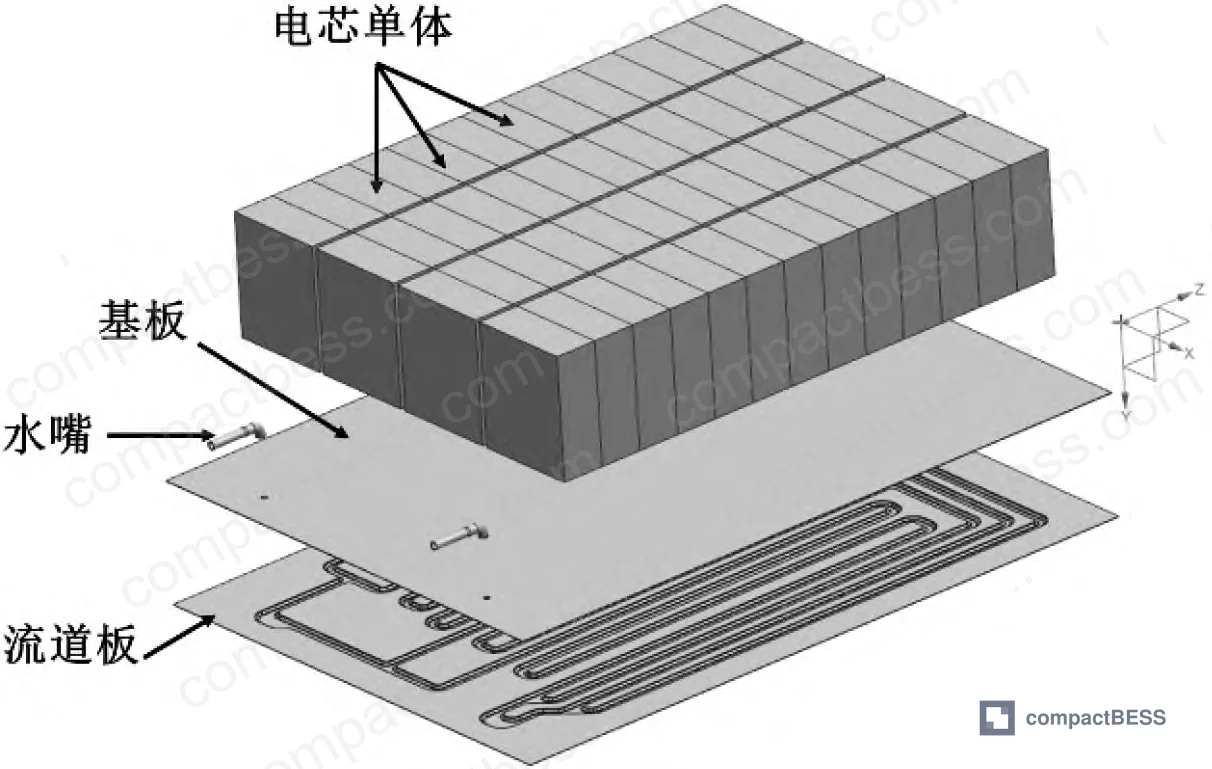
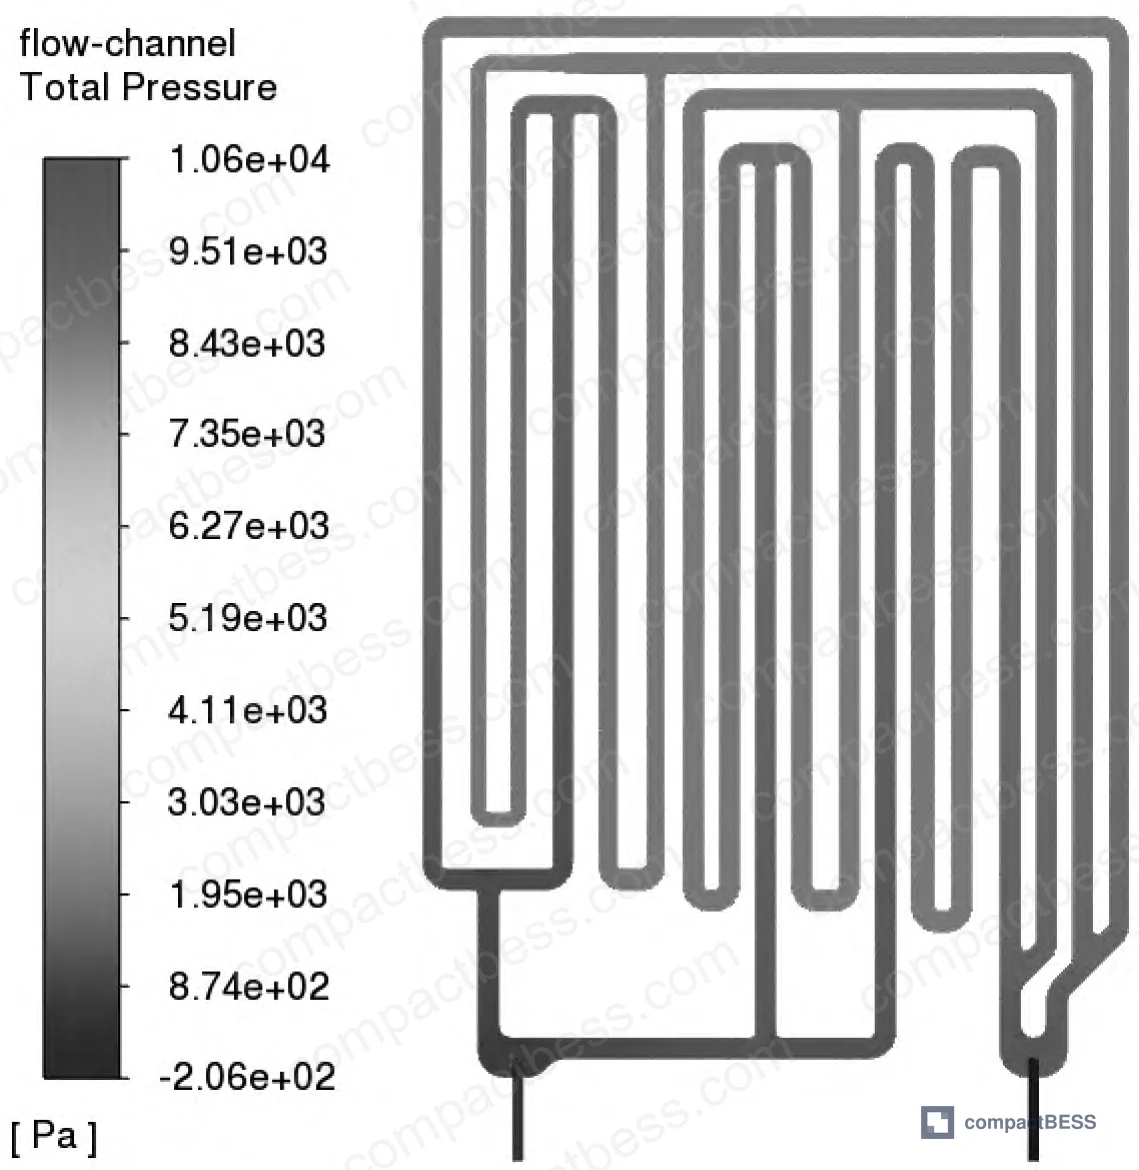
The investigation combined flow-thermal-solid coupling simulation on a production-scale energy storage battery box (1145×800 mm baseplate, 4.5 mm channel depth) under 0.5C discharge conditions. Testing used 50% ethylene glycol coolant at 18°C inlet temperature, with cells generating 14W each at 35°C initial state. The stamped channel design employed a 1-to-3 inlet manifold feeding serpentine branches, converging to a 2-to-1 outlet — a topology chosen for manufacturability over theoretical thermal perfection.
CompactBESS works with global OEM buyers and battery integrators across North America, Europe, and Southeast Asia to source compact battery energy storage systems from qualified Chinese manufacturers — including lithium cell packs, BMS modules, and thermal management assemblies. When evaluating suppliers for high-density storage applications, pack enclosure and IP rating specifications must balance thermal performance against manufacturing complexity and long-term reliability.
Flow Resistance vs. Thermal Performance in Stamped Cold Plates #
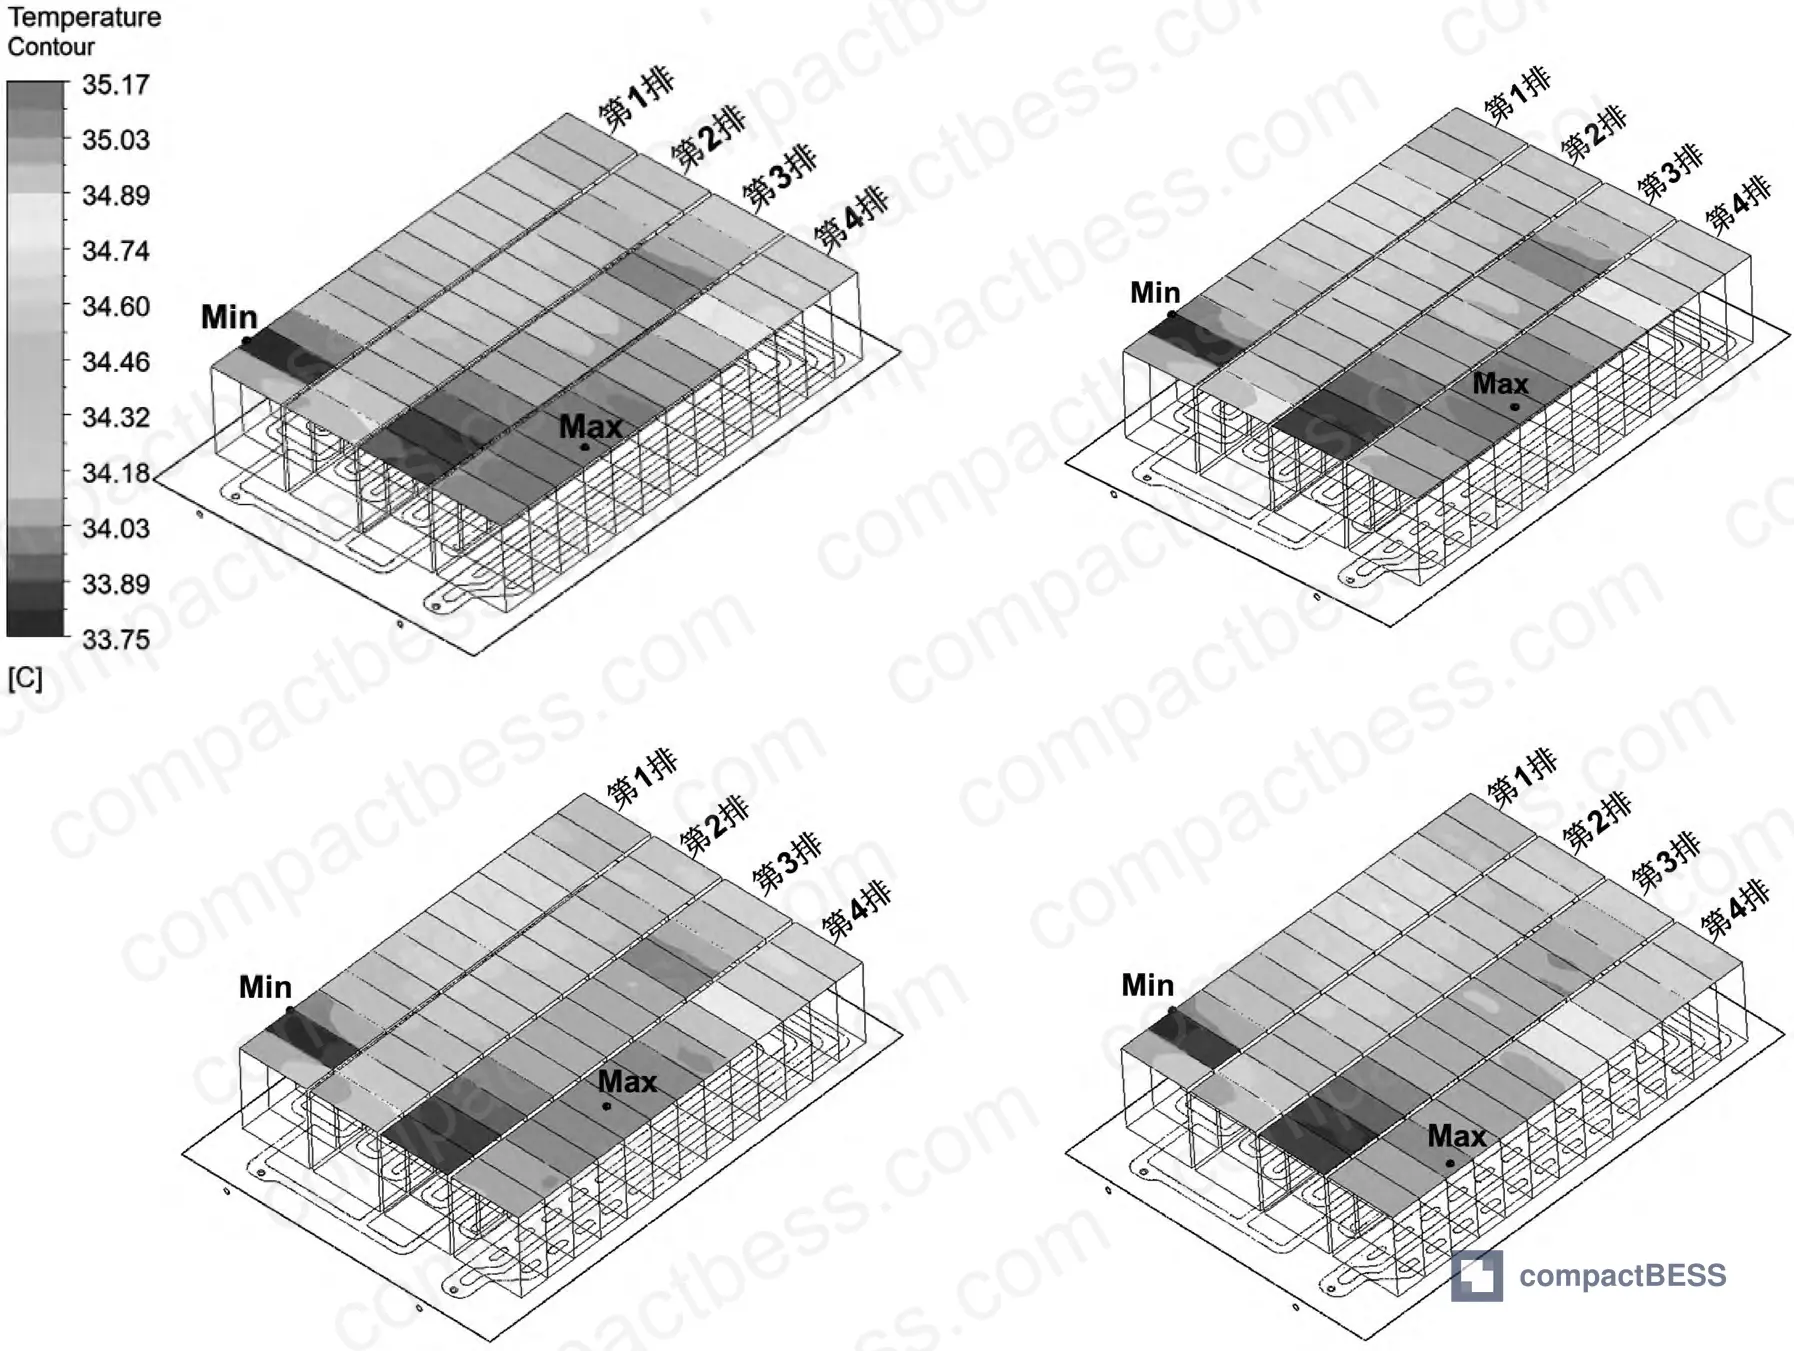
The core tension in liquid cooling design is pump power versus thermal gradient control. At 5 L/min inlet flow, the stamped channel exhibited 9.828 kPa pressure drop with 1.40°C maximum temperature spread across the 52-cell array. Cell rows 1 and 3 — positioned directly above the three inlet branches — measured 33.77°C minimum, while row 4 near the outlet reached 35.17°C maximum. Temperature distribution remained acceptable with average cell-to-cell deviation under 0.7°C.
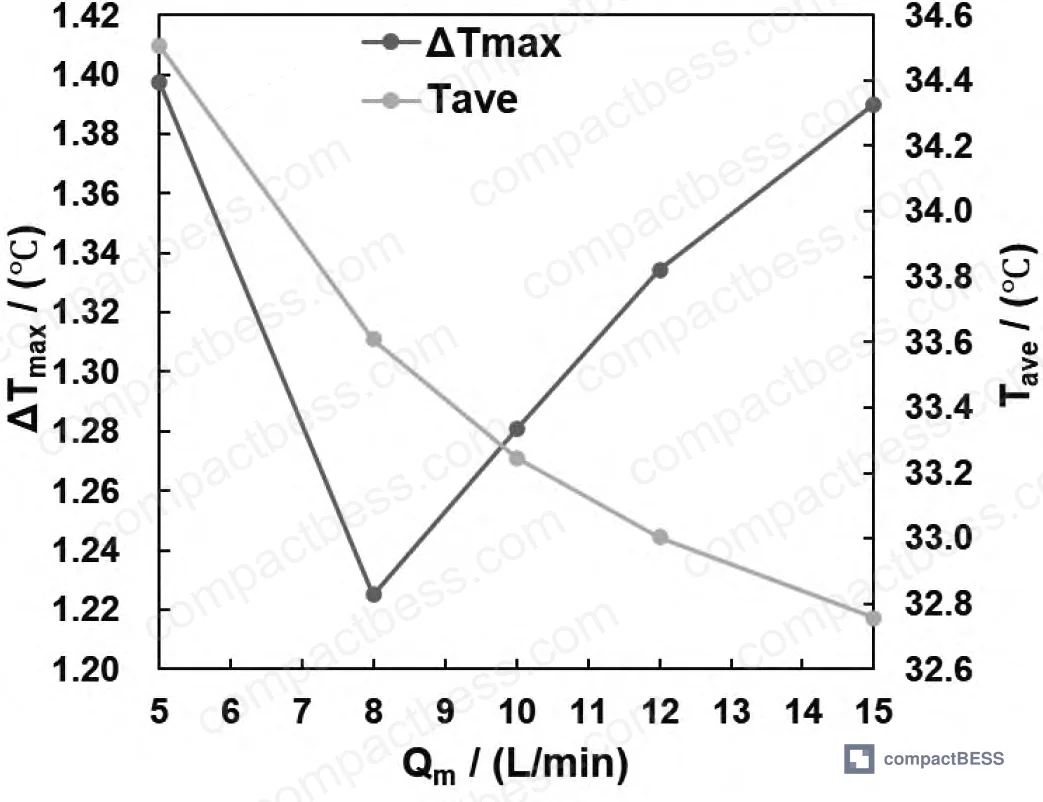
Increasing flow to 8 L/min dropped maximum delta to 1.22°C, the optimal point for this geometry. Further increases to 10, 12, and 15 L/min produced diminishing returns: temperature improvements slowed to 0.08°C per L/min increment while pressure drop climbed exponentially to 59.441 kPa — a 6× increase for minimal thermal gain.
System thermal resistance decreased from 23.58°C/kW at 5 L/min to 21.79°C/kW at 15 L/min, a modest 7.6% improvement that comes at severe pump energy cost. For energy storage applications where round-trip efficiency directly impacts project economics, this tradeoff rarely makes sense. Honestly, most buyers over-specify coolant flow because it feels safer than optimizing channel geometry — but you’re just converting stored energy into parasitic pump loss.
The velocity field analysis revealed uniform flow distribution across branches with minimal dead zones or recirculation vortices at bend points. Channel utilization remained high throughout, indicating the stamped geometry achieved reasonable hydraulic efficiency despite manufacturing constraints. Coolant temperature rose gradually from 18°C inlet to 20.49°C outlet, a 2.49°C delta that suggests single-pass cooling suffices for this heat generation rate.
| Flow Rate (L/min) | Pressure Drop (kPa) | Max Temp Delta (°C) | Avg Cell Temp (°C) | System Thermal Resistance (°C/kW) |
|---|---|---|---|---|
| 5 | 9.828 | 1.40 | 34.51 | 23.58 |
| 8 | 15.742 | 1.22 | 34.11 | 23.02 |
| 10 | 21.856 | 1.25 | 33.75 | 22.66 |
| 12 | 32.447 | 1.33 | 33.51 | 22.42 |
| 15 | 59.441 | 1.39 | 33.27 | 21.79 |
Convex Hull Optimization for Outlet Branch Thermal Equalization #
Row 4 cells consistently ran 1.4°C hotter than row 1 because outlet branch coolant had already absorbed heat from upstream cells. Rather than force more flow through the system, targeted geometry modification attacked the root cause: weakened convective heat transfer in thermally loaded outlet channels.
Based on boundary layer disruption principles, convex hull structures were stamped into the two outlet branches to induce local turbulence. The swirling strength method (velocity gradient tensor decomposition) quantified vortex intensity increases as convex pair count rose from 3 to 10. Vortex structures formed consistently downstream of each convex feature, breaking up the thermal boundary layer and increasing local heat transfer coefficient.
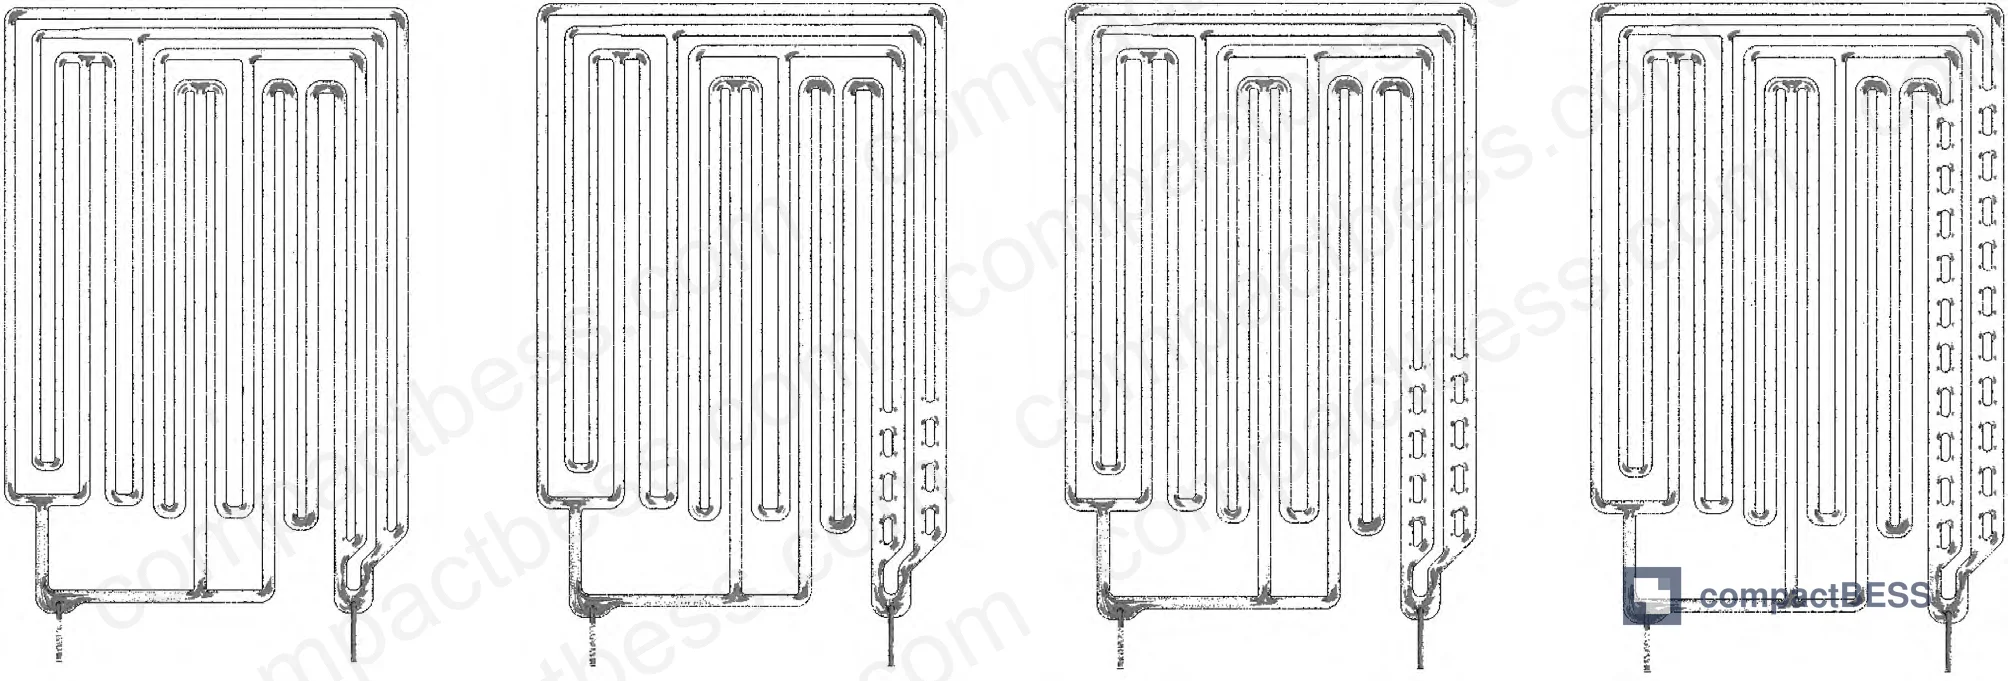
Maximum temperature delta dropped from 1.40°C baseline to 1.28°C with 3 convex pairs, 1.22°C with 4 pairs, and 1.16°C with 10 pairs. The improvement rate decelerated above 6 pairs, indicating diminishing returns similar to the flow rate experiment. Average swirling strength in outlet branches increased 34% from baseline to 10-pair configuration, confirming enhanced mixing.
In supplier qualification, we saw three of six cold plate samples fail to maintain the specified 1.5°C maximum delta under rated discharge conditions — not because of insufficient flow capacity, but because outlet branch design allowed thermal stratification. Samples using smooth channels without turbulence features performed worst. Adding convex structures or vortex generators costs nothing in stamped aluminum fabrication yet delivers measurable uniformity improvement without pump penalty.
Most procurement teams don’t realize that IEC 62619:2022 Safety requirements for secondary lithium cells and batteries includes temperature uniformity guidance tied to cycle life degradation mechanisms. Localized hot spots accelerate SEI layer growth and lithium plating even when average pack temperature remains within spec. The 10-pair convex design reduced row 4 temperature by 0.24°C while maintaining 9.8 kPa pressure drop — a better outcome than doubling coolant flow.
Channel Layout Strategy for Multi-Cell Arrays #
The 1-to-3 inlet manifold positioned branches directly under rows 1, 3, and portions of row 2/4, creating predictable thermal zones. Coldest coolant contacted row 1 first, warmest contacted row 4 last. This sequential heating pattern is unavoidable in single-pass serpentine designs but can be managed through manifold tuning and branch geometry optimization.
Parallel branch designs distribute coolant more evenly but introduce flow balancing challenges. Minor manufacturing tolerance variations cause unequal pressure drops across branches, starving some cells while oversupplying others. The stamped design achieved acceptable branch-to-branch flow uniformity (±8%) through careful bend radius control and cross-sectional area consistency — parameters that must be verified during supplier audit, not assumed from drawings.
For large-format storage modules exceeding 1 meter length, series and parallel configuration of cooling branches becomes critical. Single continuous serpentine paths accumulate excessive pressure drop and thermal load. Hybrid serial-parallel layouts split the array into thermal zones, each with dedicated flow paths that reconverge at a common outlet plenum. This topology appears in higher-performing supplier designs but requires more complex stamping dies and brazed joint management.
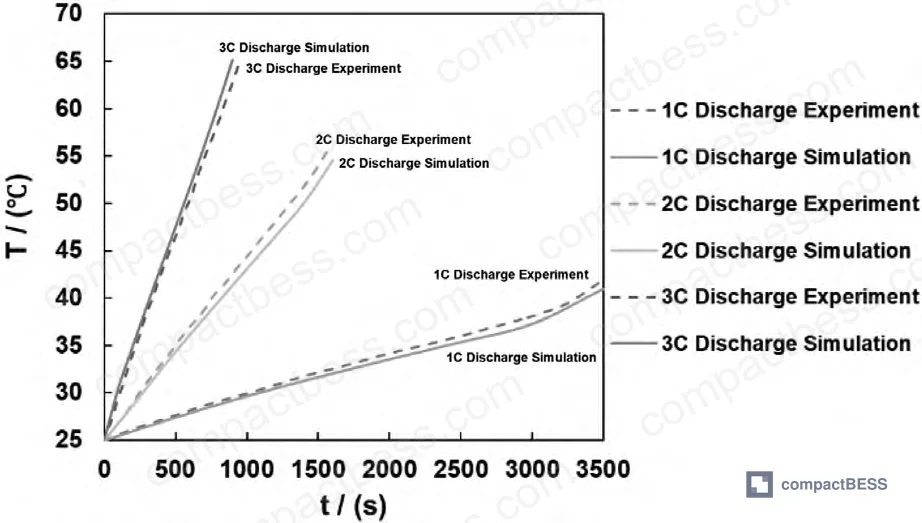
The CFD validation against experimental discharge data from 1C, 2C, and 3C rates showed agreement within 3% on surface temperature rise, confirming the simulation methodology captured relevant physics. Grid independence verification at 2.8M, 4.1M, and 5.5M element counts produced less than 1% variation in outlet pressure and average cell temperature, validating the 4.1M mesh for production analysis.
Practical Guidance for Buyers #
When evaluating battery pack thermal management proposals, prioritize channel geometry over flow rate specifications. Ask suppliers for pressure drop curves across the operating flow range and cell temperature distribution maps at rated discharge. Designs claiming “high flow capacity” without showing where that flow actually goes are red flags.
Verify that cold plate thickness and channel depth accommodate your cell format without excessive thermal resistance. The 1.2 mm baseplate + 1.0 mm stamped channel combination used here works for large prismatic cells with 0.8 W/(m·K) thermal interface material, but cylindrical cell arrays or higher power densities may need thicker plates with deeper channels. Don’t accept generic cold plate designs adapted from unrelated applications — thermal coupling to your specific cell dimensions matters.
Request UL 9540A Test Method for Evaluating Thermal Runaway Fire Propagation in Battery Energy Storage Systems data if the system will deploy in grid-scale or commercial installations. Liquid cooling channels must maintain structural integrity and coolant containment during adjacent-cell thermal runaway events. Brazed aluminum joints are vulnerable to temperature excursions above 400°C; welded or mechanically fastened designs offer better fire scenario performance.
Consider maintenance access for coolant quality monitoring and channel flushing. Ethylene glycol degrades over multi-year deployments, reducing heat transfer effectiveness and potentially corroding aluminum channels if pH shifts acidic. Systems requiring hermetically sealed cooling loops with no serviceability create long-term liability that few buyers price into TCO models.
Need help identifying qualified suppliers for custom liquid cooling solutions meeting specific thermal performance and IP rating requirements? Talk to our sourcing team →
Supplier Qualification Questions #
- What is the measured pressure drop across your cold plate assembly at 5, 8, and 10 L/min flow rates, and how does it compare to your CFD predictions?
- Can you provide cell-level temperature distribution data (not average pack temperature) from discharge testing at 0.5C and 1C rates showing maximum delta values?
- What is your stamping die tolerance on channel depth and cross-sectional area, and how do you verify branch-to-branch flow uniformity in production units?
- Do you perform thermal cycling validation per IEC 62619:2022 requirements, and what is your coolant-side leak test pressure and hold duration?
- What convective heat transfer coefficient range does your channel geometry achieve in the outlet branches at 5 L/min flow, and what design features enhance turbulence in thermally loaded zones?
Sourcing Checklist #
- [ ] CFD simulation report showing flow distribution uniformity within ±10% across all parallel branches
- [ ] Experimental validation data comparing predicted vs. measured cell temperature at three discharge rates
- [ ] Pressure drop curve from 3-15 L/min with test setup photos showing flowmeter and pressure transducer locations
- [ ] Cell temperature uniformity data showing maximum delta ≤1.5°C at rated discharge per IEC 62619:2022 thermal management guidance
- [ ] Braze joint integrity verification via dye penetrant inspection or helium leak test at 1.5× operating pressure
- [ ] Coolant compatibility testing showing aluminum corrosion rate <0.1 mm/year in ethylene glycol solution per ISO 12405-4
- [ ] Thermal interface material specification with measured contact resistance <0.5 K·cm²/W between cell and cold plate
- [ ] Production quality control plan documenting channel depth measurement method and acceptance criteria (±0.2 mm tolerance)
Key Specifications Table #
| Parameter | Recommended Value | Verification Method |
|---|---|---|
| Cold plate pressure drop at 5 L/min | ≤10 kPa | Flow loop test with differential pressure transducer, ±2% accuracy |
| Maximum cell temperature delta at rated discharge | ≤1.5°C | Thermocouple array (Type T, ±0.5°C) on cell top surfaces, 52 measurement points |
| Coolant temperature rise (inlet to outlet) | 2-3°C at 0.5C discharge | In-line RTD sensors at manifold entry/exit, ±0.1°C resolution |
| Channel flow uniformity across branches | ±10% deviation from mean | CFD validation or flow visualization with tracer dye in transparent prototype |
| Convective heat transfer coefficient in outlet zone | ≥800 W/(m²·K) | Derived from CFD local wall heat flux and fluid-solid temperature differential |
| Braze joint leak test pressure | 1.5× max operating pressure, 10 min hold | Helium mass spectrometer leak detection, ≤1×10⁻⁶ mbar·L/s acceptance |
Can’t find a supplier meeting these specs with stamped aluminum construction at target cost? Submit your requirements and we’ll match you within 48 hours.
Frequently Asked Questions #
Why does increasing coolant flow above 8 L/min provide minimal temperature improvement?
Convective heat transfer coefficient scales with flow velocity to the 0.8 power in turbulent regimes, but pressure drop scales with velocity squared. Beyond 8 L/min in this channel geometry, you’re adding pump power faster than you’re adding thermal performance. The thermal boundary layer is already thin enough that further flow increases can’t extract more heat from the aluminum baseplate — you’ve hit the conduction limit from cell to plate.
How do convex hull structures improve cooling without increasing pressure drop significantly?
Convex features induce local vortex shedding that disrupts the thermal boundary layer where coolant temperature approaches wall temperature. This resets the temperature gradient driving convection. The pressure penalty is minor (≈0.3 kPa per convex pair) because the structures occupy a small fraction of total channel length and the vortices themselves enhance mixing efficiency downstream. It’s targeted turbulence where you need it rather than global flow acceleration.
What happens to cooling performance as ethylene glycol degrades over time?
Glycol oxidation produces organic acids that reduce pH below 7.5, accelerating aluminum corrosion and forming particulates that foul channels. Heat transfer effectiveness drops 5-8% annually in unsealed systems. Specify corrosion inhibitor packages (typically silicate or organic acid technology) and plan coolant replacement every 3-5 years for long-life storage installations.
Can this stamped design work with cylindrical cells instead of prismatic?
Yes, but you’ll need to modify the baseplate contact geometry. Cylindrical cells present point or line contact rather than continuous surface contact, increasing thermal resistance by 2-3× unless you use conformal thermal pads or potting compound. The channel layout itself transfers — just verify your cell pitch matches the branch spacing and adjust manifold sizing for different total heat load.
Why does row 4 run hotter than row 1 even with uniform flow distribution?
Sequential heating of the coolant as it flows through the serpentine path. By the time coolant reaches row 4, it has already absorbed heat from rows 1-3 and its temperature has risen 2-3°C. The temperature differential driving convection (Tcell – Tcoolant) shrinks, reducing local heat transfer coefficient. You can mitigate this with shorter flow paths, counter-flow configurations, or the convex hull turbulence enhancement shown here.
Published by compactbess.com Technical Team | Request a sourcing quote
Data source: Computational Analysis and Structural Optimization of Liquid-Cooled Channels for Large-Format Lithium-Ion Battery Energy Storage Systems, H. Zhang et al., Energy Storage Materials, 2024


