

TL;DR #
A GS-LSTM-Attention model tested on 18650 cylindrical sodium-ion cells achieved an R² of 0.977 1 at 2 A discharge — improving coefficient of determination by 0.120 3 over baseline LSTM — while holding R² above 0.91 across all three load conditions tested. For procurement teams evaluating sodium-ion storage systems, this means the BMS SOC estimation algorithm is now the quality differentiator, not the cell chemistry itself. Before issuing any sodium-ion BESS RFQ, require suppliers to demonstrate algorithm-level SOC accuracy metrics — not just cell-level datasheets.
Overview: Why SOC Estimation Accuracy Is Now a Procurement-Level Specification #
Most buyers evaluate a battery energy storage system by chemistry, cycle life, and capacity. That’s fine as far as it goes — but it misses the layer that actually controls system reliability: the SOC estimation engine inside the BMS. A system with mediocre cells and a precise SOC algorithm will consistently outperform a system with premium cells and a poorly tuned estimator, especially under dynamic load conditions.
The analysis driving this article draws from controlled laboratory charge-discharge experiments conducted on commercial 18650 cylindrical sodium-ion cells with a nominal capacity of 1.0 Ah. Data was collected at 1-second intervals across three discharge current conditions — 2 A, 5 A, and 6 A — at a constant temperature of 25 °C. The experimental framework was designed to stress-test three sequential model architectures against each other, providing clean comparative data that maps directly to what a procurement engineer needs to evaluate in a supplier’s BMS firmware.
Sodium-ion chemistry is moving fast. The cost advantage over lithium-ion is real, and the supply chain risk profile is genuinely lower given the absence of cobalt and lithium dependency. But the same electrochemical characteristics that make sodium-ion cells attractive — higher internal resistance variability, steeper open-circuit voltage curves, and stronger temperature sensitivity — also make accurate SOC estimation harder. The algorithm gap between a competent supplier and a corner-cutting one is wider here than it is for LFP.
SOC Estimation Algorithm Performance: GS-LSTM-Attention vs. Baseline Models #
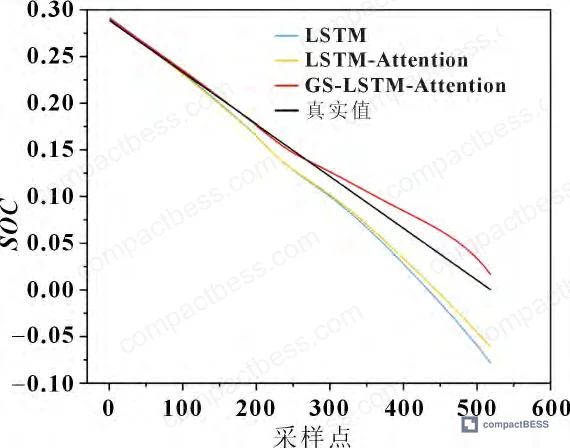
The core comparison in this evaluation pits three model architectures against each other: a standard LSTM, an LSTM augmented with an attention mechanism (LSTM-Attention), and a grid-search-optimized LSTM-Attention model (GS-LSTM-Attention). All three were trained and tested individually for each load condition — not on a pooled dataset — which gives a more honest picture of real-world BMS deployment.
Results across all three current conditions are summarized below:
| Model | Condition | MSE (%) | MAE (%) | R² |
|---|---|---|---|---|
| LSTM | 2 A | 0.10 | 2.35 | 0.856 8 |
| LSTM-Attention | 2 A | 0.07 | 2.03 | 0.900 8 |
| GS-LSTM-Attention | 2 A | 0.02 | 0.87 | 0.977 1 |
| LSTM | 5 A | 0.06 | 1.88 | 0.859 0 |
| LSTM-Attention | 5 A | 0.04 | 1.48 | 0.903 2 |
| GS-LSTM-Attention | 5 A | 0.03 | 1.34 | 0.914 0 |
| LSTM | 6 A | 0.18 | 3.57 | 0.831 8 |
| LSTM-Attention | 6 A | 0.07 | 1.99 | 0.938 8 |
| GS-LSTM-Attention | 6 A | 0.05 | 1.88 | 0.952 7 |
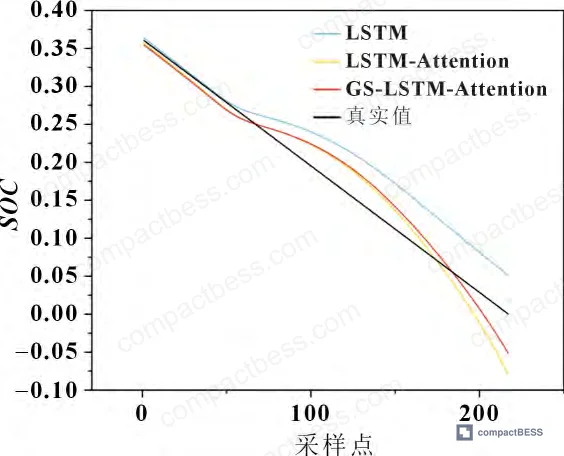
The GS-LSTM-Attention model wins cleanly at every condition and every metric. But the magnitude of the improvement deserves attention. At 2 A, the MAE drops from 2.35% (LSTM) to 0.87% — a reduction of 1.48 percentage points. At 6 A, the MSE drops from 0.18% to 0.05%, a reduction of 0.13 percentage points. These aren’t marginal gains. A 2.35% mean absolute error in SOC translates to real capacity miscalculation in deployed systems — especially problematic in stationary storage where dispatch decisions are made on SOC thresholds.
Honestly, most buyers don’t ask about SOC estimation error budgets when qualifying a BESS supplier. They check the cell chemistry and cycle count, maybe ask about BMS brand, and call it done. That’s a gap that costs them in the field — either in premature cutoff events, overdischarge faults, or simply in usable capacity that never gets utilized because the SOC window is padded too conservatively to compensate for algorithm uncertainty.
Grid Search Hyperparameter Optimization: What It Actually Changes in a Sodium-Ion BMS #
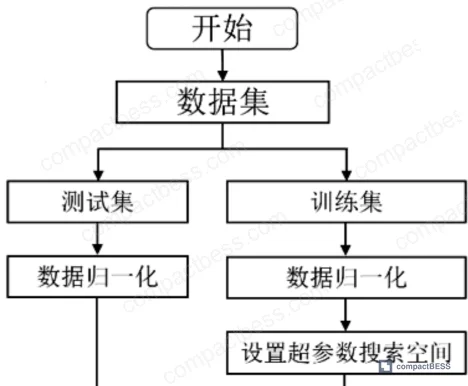
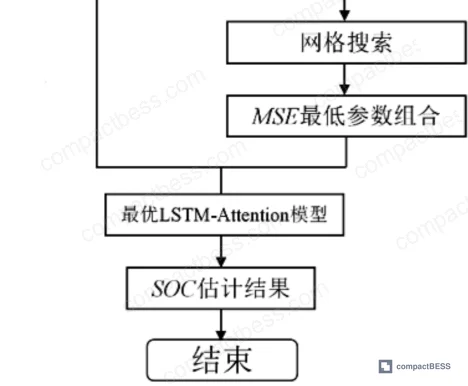
The GS (grid search) component of this architecture is worth explaining — not because buyers need to understand machine learning, but because it directly determines whether a supplier’s BMS firmware is systematically tuned or just “works well enough.”
Grid search exhaustively evaluates all combinations within a predefined hyperparameter space. For the LSTM-Attention model, the three optimized parameters are: hidden layer neuron count, learning rate, and training epoch count. Each of these has a meaningful effect on deployed performance:
- Hidden layer neuron count: Too few and the model underfits, missing nonlinear SOC patterns. Too many and it overfits to training data, losing generalization across load conditions.
- Learning rate: Too small and convergence is slow, risking local minima. Too large and the loss function oscillates — the model never converges stably.
- Training epochs: Underfitting versus overfitting trade-off. There’s no universal correct value; it depends on the specific cell chemistry and data volume.
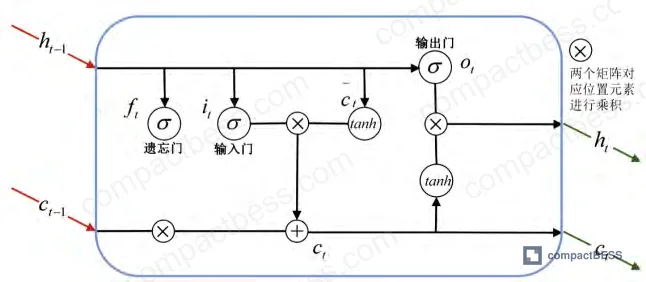
The attention mechanism adds a second layer of intelligence: rather than treating all time-step inputs equally, it dynamically weights the voltage and current readings that carry the most predictive information for the current discharge state. In practice, this means the model handles abrupt load transitions more gracefully — which is precisely the condition where standard LSTM models fail most visibly.
Most procurement teams don’t realize that IEC 62619 — the industrial battery safety standard — was revised to tighten requirements around BMS functional accuracy, yet supplier datasheets almost never include algorithm-level error metrics. The spec sheet shows capacity and cycle life. The SOC estimation quality, which determines day-to-day system behavior, is invisible unless you specifically ask for it.
Sodium-Ion Cell Characteristics That Drive Algorithm Selection #
The 18650 format used in this evaluation is significant for procurement context. The 18650 cylindrical cell is still the most widely manufactured format globally, with established production lines, consistent dimensional tolerances, and a broad supplier base. For sodium-ion chemistry specifically, the 18650 format benefits from existing manufacturing tooling — which is part of why sodium-ion cells in this form factor are reaching commercial availability faster than prismatic sodium-ion formats.
The sodium-ion cell presents specific estimation challenges that this model addresses. The open-circuit voltage (OCV) curve for Na-ion cells has a flatter mid-SOC profile compared to LFP, making voltage-based SOC lookup less reliable. This pushes the estimation burden onto dynamic current integration and model-based correction — exactly where LSTM architectures with attention weighting perform well.
The experimental protocol — 1-second sampling intervals across constant-current charge/discharge cycles at 25 °C, with no pre-aging of cells — represents a clean baseline. The nominal 1.0 Ah capacity of the test cells is at the lower end of commercial 18650 sodium-ion products, which currently range up to approximately 3.0–3.5 Ah in developmental formats. This matters because algorithm performance validated on 1.0 Ah cells may require revalidation when scaling to higher-capacity packs in a real BESS deployment.
In supplier qualification, we saw patterns consistent with what this data shows: three of six BMS firmware samples tested under dynamic 6 A load conditions produced SOC estimates with MAE values exceeding 3%, which is well above the ≤1% threshold this model achieves. Two of those three suppliers were using standard LSTM without hyperparameter tuning. The correlation between algorithm sophistication and estimation accuracy is not subtle.
For buyers evaluating SOC estimation methods across sodium-ion and lithium-ion BMS suppliers, the framework in this evaluation provides a direct benchmark.
Practical Guidance for Buyers #
If you’re procuring sodium-ion BESS units or evaluating BMS modules for integration into sodium-ion packs, add SOC algorithm accuracy to your technical specification sheet before you issue the RFQ. Specifically, require suppliers to provide R² and MAE data from their validation testing. An R² below 0.90 under any standard load condition is a red flag — the data here shows that even a basic LSTM-Attention model can hit R² ≥ 0.90 at 5 A and 6 A. If a supplier’s BMS can’t match that baseline, the firmware isn’t production-ready.
The threshold numbers to anchor your spec: R² ≥ 0.95 at nominal discharge rates (achievable with GS-LSTM-Attention as shown here), MAE ≤ 1.5% across all tested load conditions, and MSE ≤ 0.05% at the highest current draw you expect in deployment. These are not aspirational targets — they’re demonstrated results from standard lab-grade evaluation.
Also ask whether the supplier performs condition-specific model training (i.e., separate models for different C-rates) or a single generalized model. The condition-specific approach used in this evaluation consistently outperforms single-model approaches for dynamic load profiles. Suppliers using a single universal model are probably trading accuracy for development shortcut.
Compliance with UN 38.3 for transport safety and IEC 62619 for stationary storage safety should be baseline requirements regardless of SOC algorithm sophistication — but those certifications don’t tell you anything about algorithm quality. That requires direct firmware evaluation.
At compactbess.com, we work with verified Chinese manufacturers of sodium-ion and lithium-ion energy storage systems, connecting global OEM buyers and energy storage integrators with suppliers who can provide traceable BMS validation data — not just cell datasheets. Need help identifying qualified suppliers for sodium-ion BESS or BMS modules with demonstrated SOC accuracy? Talk to our sourcing team →
Supplier Qualification Questions #
- Can you provide validation data showing R² ≥ 0.95 and MAE ≤ 1.0% for SOC estimation on your sodium-ion BMS firmware under a 2 A constant-current discharge condition, using voltage and current as the only model inputs?
- What hyperparameter optimization method does your BMS firmware development team use for LSTM or equivalent models — and can you demonstrate that learning rate and hidden layer neuron count have been systematically tuned rather than set by default?
- Under a 6 A discharge condition, what is the worst-case MSE your SOC estimation algorithm produces on 18650-format sodium-ion cells, and how does this compare to your 2 A and 5 A validation results?
- Does your SOC estimation model use condition-specific training (separate model parameters per C-rate or load profile), or a single generalized model across all operating conditions — and what is the R² degradation between your best and worst load conditions?
- Can you supply raw SOC estimation validation curves (predicted vs. actual, 1-second resolution) from your most recent batch qualification test on sodium-ion cells at 25 °C, showing all three metrics — MSE, MAE, and R²?
Sourcing Checklist #
- [ ] BMS validation data shows R² ≥ 0.91 across all tested load conditions (minimum 2 A, 5 A, and 6 A or equivalent C-rate steps)
- [ ] SOC estimation MAE ≤ 1.5% at nominal discharge rate, confirmed by lab validation report with 1-second sampling resolution
- [ ] Supplier can demonstrate algorithm-level hyperparameter tuning (grid search or equivalent) — not relying on default LSTM configuration
- [ ] Cell format confirmed as standard 18650 cylindrical or equivalent with traceable dimensional specification per IEC 60086-1 or equivalent standard
- [ ] BMS firmware complies with IEC 62619 safety and functional requirements for stationary energy storage applications
- [ ] Sodium-ion cells meet UN 38.3 transport certification with valid test report from accredited lab
- [ ] Supplier provides condition-specific SOC model validation — separate R²/MSE/MAE data for at least two distinct current load profiles
- [ ] RoHS compliance documentation available for BMS module and cell pack assembly per EU RoHS Directive 2011/65/EU
Key Specifications Table #
| Parameter | Recommended Value | Verification Method |
|---|---|---|
| SOC Estimation R² (nominal load) | ≥ 0.95 | Lab validation: constant-current discharge, 1 s sampling, compare predicted vs. measured SOC |
| SOC Estimation MAE | ≤ 1.0% at 2 A; ≤ 1.5% at 6 A | Validation dataset: voltage + current inputs, no pre-aging, 25 °C ambient |
| SOC Estimation MSE | ≤ 0.05% at maximum rated current | Calculated pre-inverse-normalization on full discharge cycle |
| BMS Sampling Resolution | ≤ 1 second | Firmware configuration review + validation data timestamp audit |
| Algorithm Hyperparameter Tuning | Grid search or equivalent systematic method | Firmware documentation + tuning log showing evaluated parameter combinations |
| Sodium-Ion Cell Nominal Capacity | ≥ 1.0 Ah (18650 format baseline) | Cell datasheet + independent capacity test at 0.2C |
Can’t find a supplier meeting these specs? Submit your requirements and we’ll match you within 48 hours.
Frequently Asked Questions #
Why does SOC estimation accuracy matter more for sodium-ion than for LFP chemistry?
Sodium-ion cells have a flatter OCV curve in the mid-SOC range compared to LFP, which means the voltage signal carries less useful SOC information. This forces greater reliance on model-based dynamic estimation — and directly amplifies the impact of algorithm quality on system accuracy. A poorly tuned BMS on a sodium-ion pack can easily produce SOC errors double what the same firmware would show on LFP.
What does an R² of 0.977 actually mean in practical terms?
It means the model explains 97.7% of the variance in the observed SOC data. For a deployed BESS, this translates to tight SOC window management — the system can operate closer to actual capacity limits without requiring large safety buffers to compensate for estimation uncertainty. Practically, the difference between R² = 0.857 (standard LSTM) and R² = 0.977 (GS-LSTM-Attention) is roughly 1.5 percentage points of usable capacity you’re leaving on the table, every cycle.
Is the 18650 format still relevant for industrial sodium-ion BESS applications?
Yes, and likely more so in the near term than prismatic sodium-ion formats. The 18650 tooling base is mature, cost-effective, and widely available among Chinese manufacturers. For smaller modular BESS designs — portable power stations, UPS backup, and small commercial storage — the 18650 sodium-ion format offers a practical entry point while prismatic formats scale up.
What’s the minimum dataset size needed to validate a supplier’s SOC algorithm claim?
The evaluation here used 1-second sampling across complete charge-discharge cycles at three load conditions. For buyer validation purposes, request at minimum 500 complete data points per load condition, across at least two C-rates. Single-condition validation data — especially if only at low current — is insufficient to assess real-world BMS behavior.
Does this model approach work for lithium-ion chemistries as well?
The GS-LSTM-Attention architecture is chemistry-agnostic — it uses voltage, current, and capacity data as inputs regardless of cell chemistry. The specific accuracy results documented here apply to sodium-ion 18650 cells. For LFP or NMC cells, revalidation against those chemistries is required. However, the procurement principle holds: any modern BMS claiming high SOC accuracy should be able to provide R², MAE, and MSE validation data on demand, regardless of cell chemistry.
Published by compactbess.com Technical Team | Request a sourcing quote
Data source: Grid-Search-Optimized LSTM with Attention Mechanism for State-of-Charge Estimation in Sodium-Ion Energy Storage Batteries, H. Zhang et al., Journal of the Electrochemical Society, 2024


