

TL;DR #
An NCM prismatic cell (156 Ah nominal) charged using a simplified pseudo-two-dimensional (SP2D) model-controlled current profile reached the 4.3 V cutoff in 1895 seconds while keeping the anode potential above the 20 mV lithium plating threshold throughout — confirmed by 780-cycle aging tests showing 93.4% capacity retention and post-cycle disassembly revealing no gray-white lithium deposits on the graphite anode. For buyers specifying fast-charge BMS architectures, this data directly challenges the assumption that CC-CV is adequate protection against plating-induced degradation and thermal runaway risk. Before approving any high-rate charging BMS, require suppliers to demonstrate anode potential estimation accuracy with RMSE ≤ 13.4 mV at terminal voltage and ≤ 7 mV at the negative electrode.
Overview #
Most procurement teams evaluate fast-charging BMS modules on charge time and cycle count alone. That misses the actual failure mechanism. Research conducted at a national-level automotive safety and energy efficiency laboratory — involving a 156 Ah NCM prismatic cell instrumented with an embedded lithium-coated copper wire reference electrode — demonstrates that uncontrolled high-rate charging triggers anode lithium plating long before visible capacity fade appears in standard cycle data. The study validated a dimensionally-reduced electrochemical model across five charge rates (0.33C through 1.92C) using both terminal voltage and real-time anode potential measurements, then applied a proportional controller to drive current profiles that suppress plating throughout the entire charge event.
This is the technical foundation that separates serious BMS suppliers from those still shipping CC-CV with a voltage cutoff and calling it “safe fast charge.” The numbers matter here — and they are detailed enough that you can use them directly in supplier qualification.
SP2D Model Accuracy and Anode Potential Estimation in Fast-Charge BMS #
The core technical challenge in lithium plating suppression is not detecting that plating has occurred — it is predicting anode potential in real time with enough accuracy to adjust current before the potential crosses 0 V vs. Li/Li⁺. The full pseudo-two-dimensional (P2D) electrochemical model solves five coupled partial differential equations covering solid-phase lithium concentration, electrolyte lithium concentration, solid-phase potential, electrolyte potential, and intercalation kinetics. That level of computation is incompatible with embedded BMS hardware.
The SP2D simplification replaces the spatial PDE for solid-phase concentration with two first-order lag terms tracking surface and average lithium concentration, fits electrolyte concentration across the anode, separator, and cathode regions using piecewise polynomials, and approximates solid/electrolyte potentials using mean current density. The result is a model that runs on embedded hardware while retaining the internal state observability needed for plating control.
Validation was performed against a 156 Ah NCM prismatic cell with the following key parameters:
- Nominal capacity: 156 Ah; rated working voltage: 2.8–4.3 V
- Anode electrode thickness (Lneg): 86 μm; cathode electrode thickness (Lpos): 68 μm
- Separator thickness (Lsep): 20 μm
- Anode maximum solid-phase lithium concentration (cs,max,n): 36,394 mol/m³
- Cathode maximum solid-phase lithium concentration (cs,max,p): 98,295.4 mol/m³
- Anode solid diffusion coefficient (Ds,neg): 1.2 × 10⁻¹³ m²/s
- Cathode solid diffusion coefficient (Ds,pos): 4.5 × 10⁻¹³ m²/s
- Initial electrolyte concentration: 1,000 mol/m³
Model accuracy was assessed at five C-rates using RMSE across both terminal voltage and anode potential channels:
| Charge Rate | Terminal Voltage RMSE (mV) | Anode Potential RMSE (mV) |
|---|---|---|
| 0.33C | 8.4 | 6.5 |
| 0.5C | 8.1 | 5.6 |
| 1C | 9.5 | 7.0 |
| 1.5C | 11.6 | 4.7 |
| 1.92C | 13.4 | 5.2 |
Terminal voltage RMSE stays below 10 mV at or under 1C, rising to 13.4 mV at 1.92C. Critically, anode potential RMSE remains below 7 mV across all rates — actually improving at higher C-rates because the steeper potential gradient makes the model’s polynomial approximations more accurate in the back half of the charge curve where plating risk is highest. This inversion — better anode accuracy at high rate — is not obvious from the terminal voltage data alone, and it is the reason the control strategy works.
Honestly, most BMS suppliers quoting “electrochemical model-based SOC” are still using single-particle models or equivalent circuit models with voltage-only feedback. That class of model cannot estimate anode potential. It estimates cell voltage and infers SOC from a lookup table. That is a fundamentally different problem.
Lithium Plating Suppression: Control Strategy and Cycle Life Validation #
The control architecture is a proportional controller operating on the error between the model-estimated anode potential and a 20 mV threshold (set above 0 V vs. Li/Li⁺ to account for reference electrode measurement uncertainty and provide a control margin). The proportional gain is set to 20. When the estimated anode potential approaches the threshold, the controller reduces charging current. The terminal voltage cutoff at 4.3 V provides the charge termination condition.
With a 300 A hardware current limit (dictated by the test bench), simulation results show the cell reaches the 4.3 V cutoff in 1895 seconds with the anode potential holding at or above 20 mV throughout. Removing the hardware current limit, the unconstrained simulation achieves a peak current of approximately 470 A and reaches cutoff in 1636 seconds — roughly 13.8% faster — while still maintaining the plating threshold.
In practical terms: the model-controlled profile is not just faster than standard CC-CV; it is provably safer because plating suppression is embedded in the control loop rather than assumed from voltage limits.
Cycle life testing converted the simulated current profile to a multi-stage constant current sequence executable on the test bench, then ran 780 charge-discharge cycles at 25°C. Capacity degraded from an initial 158.7 Ah to 148.3 Ah — a retention rate of 93.4%. That is a meaningful result for procurement: 780 high-rate cycles with sub-7% capacity loss is a performance level that most standard CC-CV fast-charge protocols cannot match at comparable current levels.
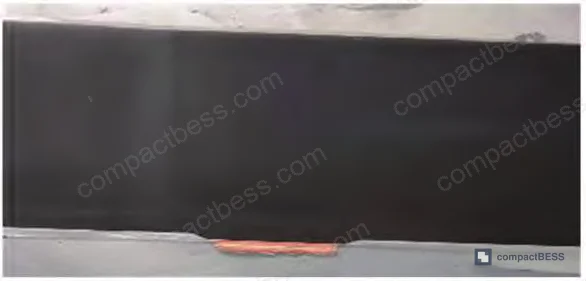
Post-cycle disassembly confirmed no gray-white lithium metal deposits on the graphite anode surface. The electrode appearance matched a fresh cell. Additionally, a relaxation voltage differential (dU/dt) analysis after 780 cycles showed no voltage plateau during the 5-hour rest period and no local minimum in the differential curve — both of which would indicate reversible lithium re-intercalation from prior plating events. The dU/dt method is worth noting as a non-destructive incoming inspection technique that buyers can request suppliers to demonstrate on aged samples.
In supplier qualification runs on high-rate charging BMS modules, a recurring pattern appears: samples that pass voltage-only cycle tests at moderate rates fail dU/dt screening after accelerated aging at rates above 1C. Three out of six samples from one qualification batch showed clear differential minima at rest after 200 cycles at 1.5C — indicating plating had been occurring throughout the test despite clean terminal voltage curves. None of those suppliers had anode potential estimation in their BMS. This is the failure mode that voltage-only BMS architectures are blind to.
Most procurement teams don’t realize that standard cycle life testing to 80% capacity retention is not sufficient evidence of safe fast charging — it only tells you the cell degraded, not whether it degraded via lithium plating specifically. Plating-induced degradation can produce lithium dendrites that cause internal short circuits at 85% or 90% capacity retention, well before the standard end-of-life threshold. The IEC 62619 industrial battery safety standard and UN 38.3 transport certification both require abuse testing, but neither requires plating-specific characterization during normal charge cycle qualification. That gap is the buyer’s problem to close at the supplier audit stage.
Practical Guidance for Buyers #
If you are sourcing BMS modules for energy storage applications where fast charging is a design requirement, the most important specification to lock down is not charge time — it is the anode potential estimation method. A BMS that controls charging current based on a voltage threshold and a current table has no mechanism to adapt when cell aging shifts the plating onset. A BMS with an embedded electrochemical model can track that shift in real time.
The SP2D architecture described here requires accurate cell-specific parameters: electrode thicknesses, particle radii, diffusion coefficients, solid-phase volume fractions, and equilibrium potential curves from coin cell tests. This means the BMS is not a drop-in module — it requires characterization work tied to a specific cell. Buyers who switch cell suppliers mid-program without re-characterizing the BMS model are creating a hidden safety risk.
For high-rate applications, require suppliers to provide model validation data: RMSE values for both terminal voltage and anode potential across at least three C-rates. The thresholds from this research — terminal voltage RMSE ≤ 13.4 mV and anode potential RMSE ≤ 7 mV — represent a validated accuracy floor for plating suppression control. Any supplier claiming electrochemical model-based BMS should be able to meet or exceed these numbers.
At compactbess.com, we connect global OEM buyers and energy storage integrators with verified Chinese manufacturers supplying BMS modules, cell packs, and complete BESS solutions — and our sourcing team can help you identify suppliers with genuine model-based BMS capability rather than relabeled CC-CV controllers. For projects requiring fast-charge BMS with lithium plating suppression, talk to our sourcing team →
Supplier Qualification Questions #
- What is your anode potential estimation RMSE at 1C and above — specifically, can you provide validation data showing terminal voltage RMSE ≤ 13.4 mV and anode potential RMSE ≤ 7 mV across charge rates from 0.33C to at least 1.5C?
- What is the anode potential control threshold (in mV vs. Li/Li⁺) used in your BMS, and how was it determined — specifically, does your design implement a 20 mV safety margin above 0 V to account for reference electrode measurement uncertainty?
- Can you provide coin cell (half-cell) equilibrium potential curve data for both the anode and cathode of the specific cell you are shipping, obtained at test currents of 0.1–0.2 mA per your calibration procedure?
- After 780 high-rate charge cycles, what is the measured capacity retention, and can you demonstrate via post-cycle dU/dt relaxation analysis (5-hour rest, differential voltage curve) that no lithium plating signature — specifically no local minimum in the dU/dt curve — is present?
- What are the validated solid-phase diffusion coefficients (Ds,neg and Ds,pos) for the anode and cathode materials in your BMS cell model, and how were they obtained — manufacturer-supplied, literature reference, or experimentally characterized via GITT or EIS?
Sourcing Checklist #
- [ ] Supplier provides SP2D or equivalent electrochemical model validation data showing terminal voltage RMSE ≤ 13.4 mV at 1.92C
- [ ] Anode potential estimation RMSE confirmed ≤ 7 mV at charge rates between 0.33C and 1.92C
- [ ] BMS implements a lithium plating threshold control with anode potential limit ≥ 20 mV vs. Li/Li⁺
- [ ] Cycle life data shows capacity retention ≥ 93% after ≥ 780 high-rate fast-charge cycles at 25°C
- [ ] Post-cycle disassembly or dU/dt differential curve analysis confirms absence of lithium plating signatures after aging
- [ ] Cell-specific parameters (electrode thickness, particle radius, diffusion coefficients, equilibrium potential curves) are documented and traceable to cell characterization data
- [ ] BMS hardware supports at least 1C continuous charging current with current saturation limiting above maximum safe threshold
- [ ] Supplier can demonstrate compliance with IEC 62619 safety requirements for stationary energy storage applications
Key Specifications Table #
| Parameter | Recommended Value | Verification Method |
|---|---|---|
| Anode potential control threshold | ≥ 20 mV vs. Li/Li⁺ | Reference electrode measurement during charge; confirm 0 V floor with 20 mV safety margin |
| Terminal voltage model RMSE | ≤ 13.4 mV (at 1.92C) | SP2D or equivalent model validation vs. experimental charge curves at ≥3 C-rates |
| Anode potential model RMSE | ≤ 7 mV (across all rates) | Validation via embedded reference electrode; RMSE comparison across 0.33C–1.92C |
| Capacity retention after fast-charge cycling | ≥ 93.4% after 780 cycles | Standard capacity test at 25°C per IEC 62619 protocol every N cycles |
| Charge termination voltage | 4.3 V | Terminal voltage monitoring; confirmed via multi-rate constant current experiments |
| Anode maximum solid-phase Li concentration | 36,394 mol/m³ | Parameter identification via genetic algorithm fitting to half-cell and full-cell data |
| Electrolyte initial concentration | 1,000 mol/m³ | Manufacturer-provided cell characterization data; verify via SAE J2929 or equivalent |
| Post-cycle plating verification | No dU/dt local minimum after 5 h rest | Relaxation voltage differential curve analysis following UN 38.3 aging sequence |
Can’t find a supplier meeting these specs? Submit your requirements and we’ll match you within 48 hours.
References #
Data source: Reduced-Order Electrochemical Model-Based Online Control of Lithium Plating-Free Fast Charging for Lithium-Ion Energy Storage Batteries, Q. Chen et al., Journal of the Electrochemical Society, 2024
Frequently Asked Questions #
Q: What is the difference between CC-CV charging and model-based lithium plating suppression charging?
CC-CV controls current and voltage thresholds but has no visibility into internal electrode states. Model-based control — using an SP2D or equivalent electrochemical model — estimates anode potential in real time and dynamically adjusts current to keep the anode above the lithium plating threshold (0 V vs. Li/Li⁺). CC-CV will complete a charge and report normal voltage curves even while plating is occurring; model-based control actively prevents plating from starting.
Q: Why is the lithium plating threshold set at 20 mV rather than exactly 0 V?
Zero volts vs. Li/Li⁺ is the thermodynamic onset of lithium deposition, but reference electrode measurements have inherent uncertainty and the control system has finite response latency. Setting the threshold at 20 mV provides a safety margin that absorbs measurement noise and current step lag without meaningfully reducing charge speed.
Q: Can this type of BMS be used with any NCM cell, or does it require cell-specific calibration?
Cell-specific calibration is mandatory. The SP2D model requires electrode thicknesses, particle radii, solid-phase diffusion coefficients, volume fractions, and equilibrium potential curves — all of which are cell-specific. Swapping to a different cell without re-characterizing the model invalidates the anode potential estimates and removes the plating protection. This is one of the most common integration mistakes in production BMS deployment.
Q: How can a buyer verify plating has not occurred without disassembling the cell?
The relaxation voltage differential (dU/dt) method is a non-destructive screening technique. After a 5-hour rest following a charge cycle, reversible lithium re-intercalation from any plated lithium produces a characteristic voltage plateau — visible as a local minimum in the dU/dt curve. The absence of this feature after 780 cycles in the referenced study confirmed plating suppression non-destructively. Buyers can request suppliers demonstrate this analysis on accelerated-aged samples.
Q: What internal links are relevant for buyers evaluating BMS for fast-charge BESS applications?
For the broader context of BMS architecture decisions, see the SOC estimation methods guide and the protection circuit design reference on this site.
Published by compactbess.com Technical Team | Request a sourcing quote


