

TL;DR #
AC impedance-based SOH detection using a BP neural network achieves an average error of just 0.4% across four batteries spanning 69.85%–100% health states, compared to 1.8% average error for traditional capacity determination — a 1.4 percentage point accuracy advantage that compounds significantly over fleet-scale deployments. For buyers specifying BMS diagnostics or incoming inspection protocols, this gap means the difference between catching a degraded cell before it enters a pack and shipping a latent failure to your customer. Require suppliers to demonstrate impedance-based state detection with documented average detection time ≤2 minutes and SOH error ≤0.5% per cell before approving any BMS diagnostic module.
Overview #
Before committing to a BMS platform or specifying incoming cell inspection tooling, the first question worth asking is: how fast and how accurately can the system characterize battery state — and does that accuracy hold as cells age? That question frames everything in this evaluation.
The data discussed here comes from laboratory testing conducted at a power engineering research facility operating grid-scale energy storage systems. Researchers built an impedance parameter identification model using an equivalent circuit approach, then validated it against four 18650 lithium-ion cells with deliberately different health states: 100%, 93.54%, 82.31%, and 69.85% SOH. The test platform used an Agilent 6614C constant-current/constant-voltage power supply, a BK Precision 8500 electronic load for simulating variable load conditions, and a BioLogic VMP3 AC impedance analyzer — instruments that any serious cell testing lab will recognize. All algorithms (mathematical analysis, Levenberg-Marquardt optimization, BP neural network, bisection method) were implemented in Python on a connected host controller.
The outcome is a detection framework that simultaneously estimates SOH (State of Health) and SOP (State of Power) from impedance spectra alone, without requiring full charge/discharge cycling. The performance numbers are significant enough that procurement teams specifying BMS diagnostics or cell qualification workflows should pay close attention.
AC Impedance-Based SOH Detection: Method, Model, and Accuracy Results #
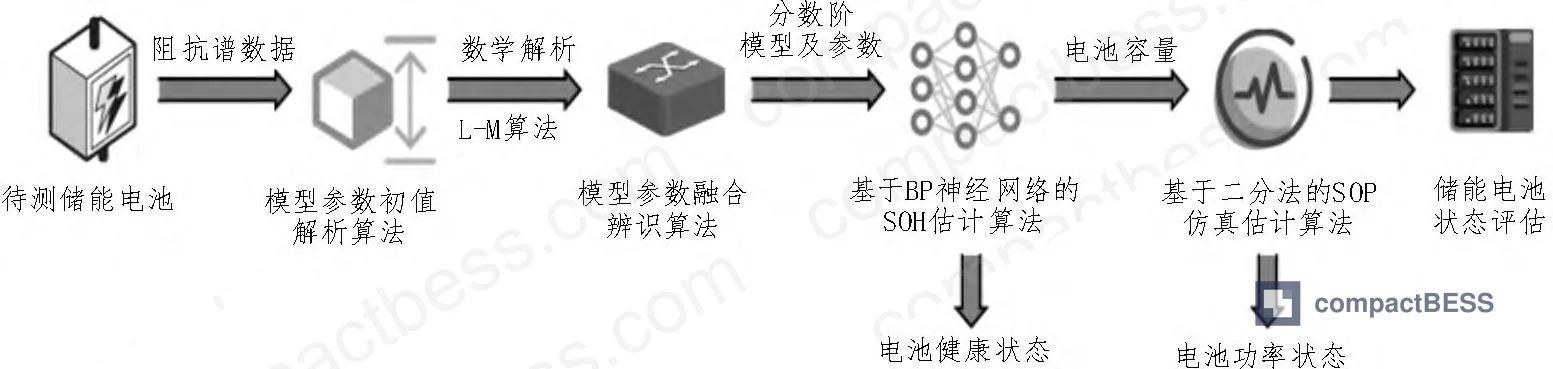
The core of the detection method is an impedance parameter identification model that extracts electrochemical information from the cell’s response to a small-amplitude AC perturbation across a range of frequencies. Unlike DC methods, this approach captures the cell’s internal electrochemical characteristics — double-layer capacitance, charge transfer resistance, diffusion behavior — without forcing it through a full cycle.
The model construction follows a two-stage process. First, a mathematical analysis step fits the impedance spectrum data to an equivalent circuit model, using second- and third-order fractional impedance models with inductive elements added to improve high-frequency behavior. The initial parameter values from this step are close to true values but carry limited precision because the frequency points in a real impedance spectrum aren’t uniformly distributed. Second, a Levenberg-Marquardt (L-M) optimization algorithm refines those initial values by solving the resulting nonlinear least-squares problem iteratively, converging on parameter vectors that minimize the residual between measured and modeled spectra.
The identified impedance parameters feed into a BP neural network trained on cells at different aging stages. Nine impedance parameters showed nonlinear relationships with SOH — which is precisely why a neural network approach is more appropriate than a simple regression here. The network takes measurable cell parameters (voltage, internal resistance, temperature, and the identified impedance values) as inputs and outputs an SOH estimate.
For SOP estimation, the method adds a bisection algorithm that iterates between minimum current (Imin = 0) and maximum safe current (Imax = Isafe), converging on the target current that maximizes power output within safe operating limits. At each iteration, output power is computed as P = V × Itarget, and iteration ends when Pcurrent approaches the target power.
The SOH accuracy results across the four test batteries are shown in the comparison below:
| Battery | True SOH (%) | AC Impedance Predicted SOH (%) | AC Impedance Error (%) | Capacity Method SOH (%) | Capacity Method Error (%) |
|---|---|---|---|---|---|
| A | 100.00 | 99.80 | 0.20 | 98.5 | 1.50 |
| B | 93.54 | 93.10 | 0.44 | 92.0 | 1.54 |
| C | 82.31 | 81.90 | 0.41 | 80.0 | 2.31 |
| D | 69.85 | 69.30 | 0.55 | 68.0 | 1.85 |
| Average | — | — | 0.40 | — | 1.80 |
The pattern is consistent: AC impedance errors stay below 0.6% even at low SOH, while the traditional capacity method degrades noticeably at mid-range health (Cell C shows 2.31% error). That Cell C result is where the traditional method falls furthest behind — and mid-range degradation is exactly the operating zone where most grid storage operators are making dispatch and replacement decisions.
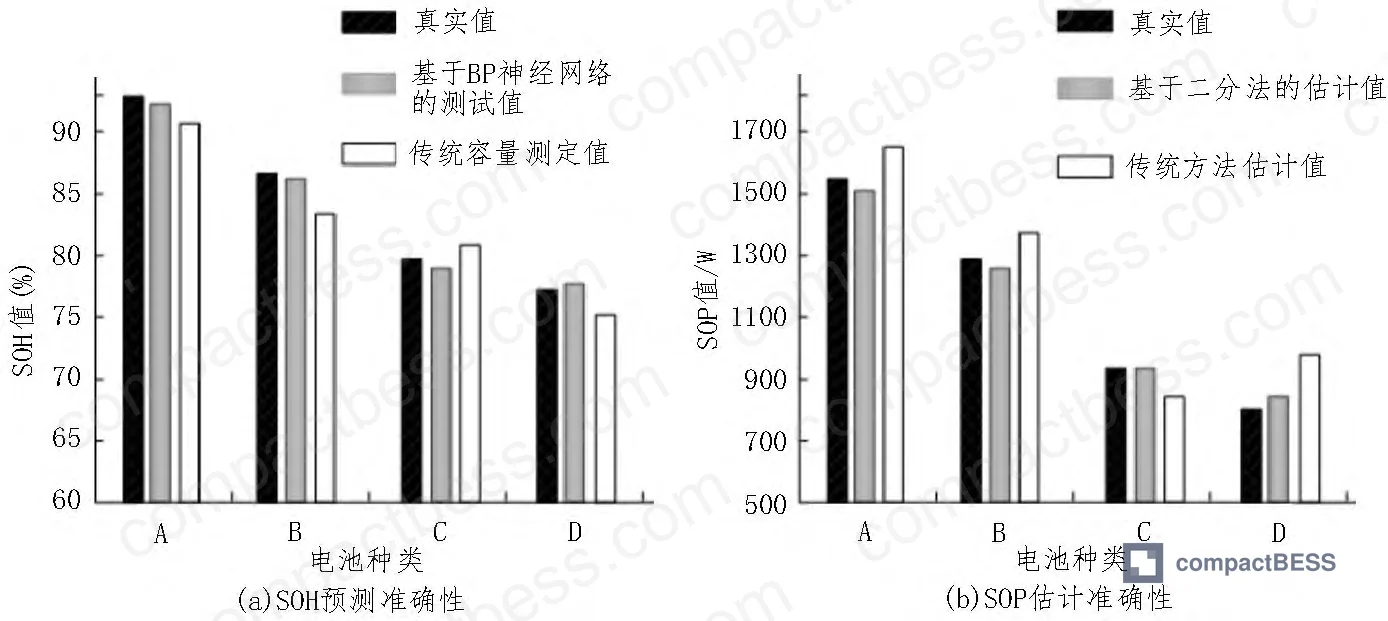
For SOP accuracy, the bisection method produced an absolute error of 15.38 against true values, compared to 38.75 for the traditional estimation method — a roughly 2.5× improvement. That matters for any application where power-available calculations feed into dispatch logic or load-shedding decisions.
Detection Speed and Method Comparison for Battery State Monitoring #
Speed is where the AC impedance method’s advantage over traditional approaches becomes commercially relevant, especially for incoming inspection workflows or field diagnostics at scale.
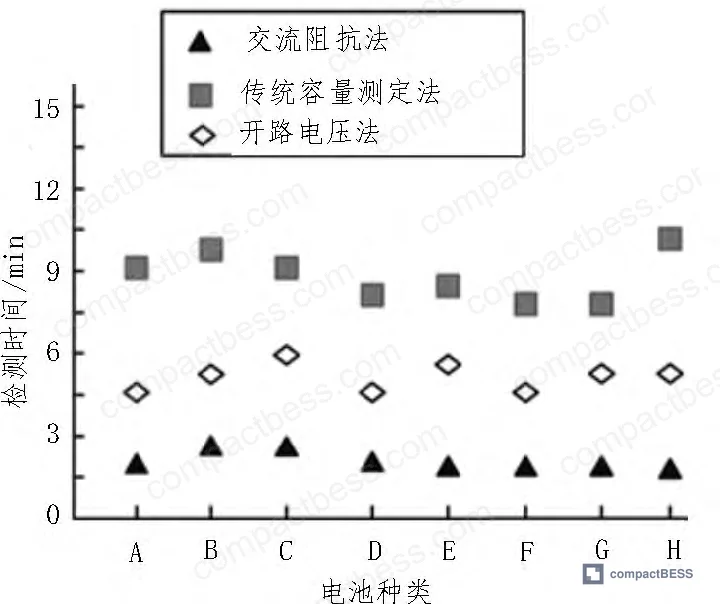
Testing across 8 different battery state conditions produced the following average detection times:
| Detection Method | Average Detection Time (min) | Time Reduction vs. AC Impedance |
|---|---|---|
| AC Impedance (proposed) | 1.68 | — |
| Traditional Capacity Determination | 5.58 | −69% faster with AC impedance |
| Open-Circuit Voltage (OCV) | 9.12 | −81.5% faster with AC impedance |
The OCV method’s 9.12-minute average isn’t surprising — OCV requires the cell to reach electrochemical equilibrium after load removal, and in practice that wait is even longer for cells that have been under sustained discharge. The capacity method’s 5.58-minute average reflects the irreducible time required to run even a partial charge/discharge cycle at elevated C-rates.
The AC impedance method’s 1.68-minute average is achievable because the impedance measurement itself is non-destructive and non-intrusive — a small AC perturbation, spectrum acquisition, then model fitting. No waiting for equilibrium, no cycling.
Most procurement teams don’t realize that OCV-based SOC estimation accuracy degrades substantially for LFP chemistry due to the flat discharge plateau — which means any BMS relying on OCV in an LFP system is working with fundamentally compromised input data. AC impedance doesn’t have this chemistry-specific blind spot, which is one reason the method is attracting serious attention from grid storage operators.
Honestly, most buyers over-specify the BMS communication protocol and under-specify the state estimation accuracy. A system that can communicate SOH via CAN-bus every 100ms is worthless if the underlying SOH figure carries 2% error — that’s the difference between a cell at 80% health and one at 78%, which in a 100kWh system translates to a 2kWh miscalculation in usable energy. Require accuracy specifications tied to test methods, not just protocol compliance.
Practical Guidance for Buyers #
If you’re sourcing BMS modules for energy storage applications — whether grid-scale ESS, commercial UPS, or industrial battery packs — the state estimation methodology embedded in the BMS firmware matters as much as the hardware spec sheet. A BMS that quotes ±2% SOH accuracy using traditional capacity determination is not equivalent to one quoting ±0.5% via AC impedance, even if both pass the same certification tests.
When evaluating suppliers, ask specifically which detection method underpins their SOH and SOP estimates, what test conditions those accuracy claims were validated under, and whether they can provide batch test reports showing per-cell error distributions — not just average figures. Average error of 0.4% looks excellent until you discover the worst-case outlier was 1.8% and was excluded from the reported dataset.
In our qualification work with Chinese manufacturers supplying grid and industrial storage systems, we’ve seen suppliers quote impressive accuracy figures that were measured only at 100% SOH — the easiest state to estimate accurately. Push for validation data across the full SOH range, particularly in the 70%–85% zone where degradation decisions are made.
At CompactBESS, we work directly with verified manufacturers of BMS modules, cell packs, and complete energy storage systems in Guangzhou and across South China, connecting overseas OEMs and system integrators with technically vetted production partners. If you’re specifying SOH estimation accuracy requirements for an RFQ, our sourcing team can help you identify suppliers who can demonstrate the test data.
Need help identifying qualified suppliers for AC impedance BMS modules or energy storage battery packs? Talk to our sourcing team →
Supplier Qualification Questions #
- What is your BMS’s average SOH estimation error across the full SOH range (100% down to 70%), and can you provide per-cell test data showing individual errors for each battery tested — not just the fleet average of ≤0.4%?
- Which state estimation method does your BMS firmware use — AC impedance spectroscopy, capacity determination, or OCV — and can you demonstrate that the average detection time is ≤2 minutes under standard load conditions?
- For SOP estimation specifically, what is your bisection-method or equivalent algorithm’s absolute error against true power values, and can you show test data demonstrating it achieves below 20 absolute error units versus the traditional method’s 38.75?
- What equivalent circuit model do you use for impedance fitting — does it include fractional-order elements and inductive terms for high-frequency behavior, or is it a simplified RC model — and how does model choice affect accuracy at low SOH (≤70%)?
- Under what temperature conditions were your SOH accuracy claims validated, and do you have test data showing performance outside constant-temperature lab conditions, given that temperature variation is a known gap in impedance-based detection that affects real-world deployment?
Sourcing Checklist #
- [ ] Supplier can provide SOH test data for cells at four or more distinct health states spanning 70%–100%, with per-cell errors documented individually (not just fleet average)
- [ ] BMS SOH estimation error is ≤0.5% average, validated using AC impedance or equivalent electrochemical method per IEC 62619 safety and performance standard compliance
- [ ] Average battery state detection time is ≤2 minutes per cell, verified against the supplier’s stated method (AC impedance target: 1.68 min; capacity method benchmark: 5.58 min)
- [ ] SOP estimation absolute error is documented and ≤20 units, with test methodology specified (bisection or equivalent iterative algorithm)
- [ ] Impedance measurement equipment or embedded circuitry is identified by model/specification, not just described generically — analogous to BioLogic VMP3 class instruments for validation testing
- [ ] BP neural network or equivalent ML model training data covers multiple aging stages, not just fresh cells, ensuring SOH estimation accuracy holds at mid-life degradation (82%–93% SOH range)
- [ ] Supplier’s BMS module is compatible with UN 38.3 transport certification requirements and meets IEC 62133 cell-level safety requirements
- [ ] Supplier has documented test protocols for incoming cell inspection that include state estimation accuracy verification — not just visual or dimensional checks
Key Specifications Table #
| Parameter | Recommended Value | Verification Method |
|---|---|---|
| SOH estimation average error | ≤0.4% (AC impedance method) | BP neural network with L-M optimized impedance model; validate against known SOH reference cells at 4+ health states |
| Average battery state detection time | ≤1.68 min per cell | Timed test across ≥8 battery state conditions; compare against capacity method (benchmark: 5.58 min) and OCV method (benchmark: 9.12 min) |
| SOP estimation absolute error | ≤15.38 (bisection method) | Bisection algorithm iterating between Imin = 0 and Imax = Isafe; compare output power P = V × Itarget against true power values |
| SOH error at low-health cells (≤70% SOH) | ≤0.55% | Test against reference cell with confirmed SOH of ~69.85%; AC impedance prediction should land within 0.55% of true value |
| Traditional capacity method SOH error (benchmark to beat) | >1.8% average | Use as negative benchmark; any supplier claiming capacity-method accuracy ≤1.8% warrants additional scrutiny |
| Impedance model order | Second- or third-order fractional with inductive elements | Review equivalent circuit model documentation; confirm high-frequency inductive behavior is captured |
Can’t find a supplier meeting these specs? Submit your requirements and we’ll match you within 48 hours.
Frequently Asked Questions #
Q1: Why does AC impedance detection outperform the open-circuit voltage (OCV) method so significantly in speed?
OCV requires the cell to reach electrochemical equilibrium after any load event before a valid measurement can be taken — in practice, this waiting period drives the 9.12-minute average detection time. AC impedance applies a small-amplitude perturbation and reads the frequency-domain response directly, capturing electrochemical state information without requiring equilibrium. The result is an 81.5% reduction in detection time.
Q2: Is the 0.4% average SOH error figure achievable in production BMS hardware, or only in lab conditions?
The 0.4% average was achieved under constant-temperature laboratory conditions using bench-grade impedance analyzers and offline Python-based computation. Real-world BMS implementations face temperature variation, embedded processing constraints, and noisier measurement environments. Field-deployed systems should target ≤1% as a realistic production specification — still substantially better than the 1.8% average for traditional capacity determination, but buyers should not hold suppliers to lab-only figures without acknowledging the environmental delta.
Q3: What cell chemistry does this detection method apply to?
The test data was generated using 18650 lithium-ion cells. The AC impedance methodology is theoretically applicable to LFP, NMC, and LCO chemistries, but impedance model parameters — particularly the fractional-order elements and Warburg diffusion coefficients — will differ by chemistry. Buyers specifying LFP systems should require chemistry-specific validation data, not NMC-derived model parameters.
Q4: Can AC impedance-based detection be integrated into standard BMS modules, or does it require dedicated external equipment?
Currently, high-accuracy impedance spectroscopy uses external instruments (BioLogic VMP3 class), which limits integration into compact BMS hardware. Embedded impedance injection circuits are an active development area. For production systems, buyers should ask whether the supplier’s BMS performs single-frequency or multi-frequency impedance measurement — single-frequency is easier to embed but sacrifices the spectral information that makes multi-frequency approaches accurate.
Q5: What’s the practical implication of SOP estimation error of 15.38 versus 38.75 for the traditional method?
SOP determines how much power a battery can safely deliver or absorb at a given moment — it feeds directly into dispatch logic, load shedding, and thermal management decisions. An absolute error of 38.75 in traditional SOP estimation means the system may authorize a power draw the battery can’t safely sustain, or unnecessarily curtail available power. Halving that error to 15.38 with the bisection method improves both safety margins and energy utilization efficiency.
Published by compactbess.com Technical Team | Request a sourcing quote
Data source: Rapid AC Impedance-Based State Estimation for Energy Storage Batteries Using Neural Networks and Iterative Algorithms, H. Zhang et al., Journal of the Electrochemical Society, 2024


