

TL;DR #
At 3 C charge rate, a bottom-mounted liquid cooling plate allows cell temperatures to reach 357 K — within striking distance of the 393 K thermal runaway threshold — while a bidirectional counter-flow side plate holds the same pack at 299 K with a ΔT of just 4.8 K. For any procurement team specifying liquid cooling for grid-scale ESS, this gap between cooling architectures is the single most consequential design decision you’ll make. Before accepting a supplier’s thermal management solution, demand simulation data or test results at ≥3 C showing simultaneous compliance with both Tmax ≤ 313 K and ΔT ≤ 5 K.
Overview #
Most buyers evaluate a liquid-cooled battery pack by asking whether it has a cold plate. That’s the wrong question. The question is where the cold plate sits, how the coolant flows, and whether the design can handle the transient heat loads that actually occur in grid dispatch — not just the nominal 1 C baseline case the supplier’s datasheet was built around.
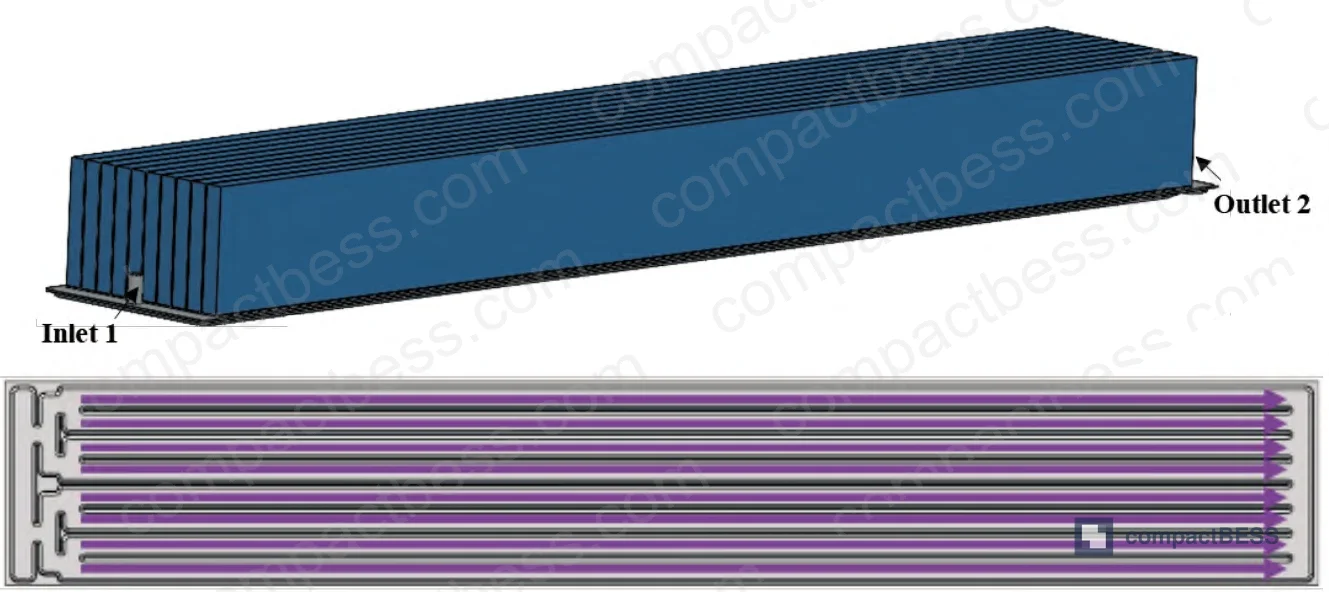
The analysis underpinning this article comes from a numerical simulation study conducted at a national-level energy research institution in China. The study modeled a 10-cell series blade pack built on 135 Ah LFP prismatic cells (945 mm × 14 mm × 90 mm), running three distinct cooling architectures across three charge/discharge regimes: 1 C conventional, 3 C high-rate, and 5 C ultra-high-rate. Coolant was 50% ethylene glycol solution at 293.15 K inlet temperature and 12 L/min total flow — conditions representative of real-world rack-scale deployments. The simulation used mesh-independent CFD (validated at 4.23 million cells) with anisotropic cell thermal conductivity modeled separately for tangential (18.3 W/m·K) and normal (1.1 W/m·K) directions, which is the right way to capture blade cell heat transport and a detail many supplier validation reports quietly omit.
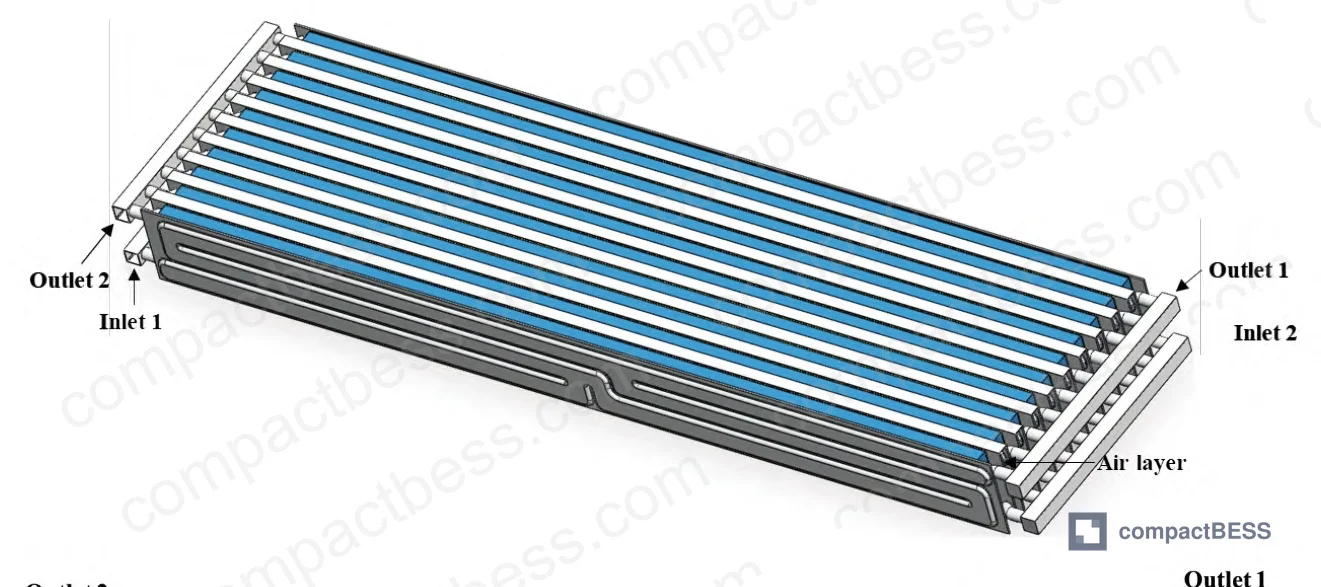
Liquid Cooling Architecture Comparison: Bottom Plate vs. Side-Mounted Counter-Flow #
There are three architectures worth knowing. Understanding why two of them fail under high-rate conditions is more useful than any spec sheet.
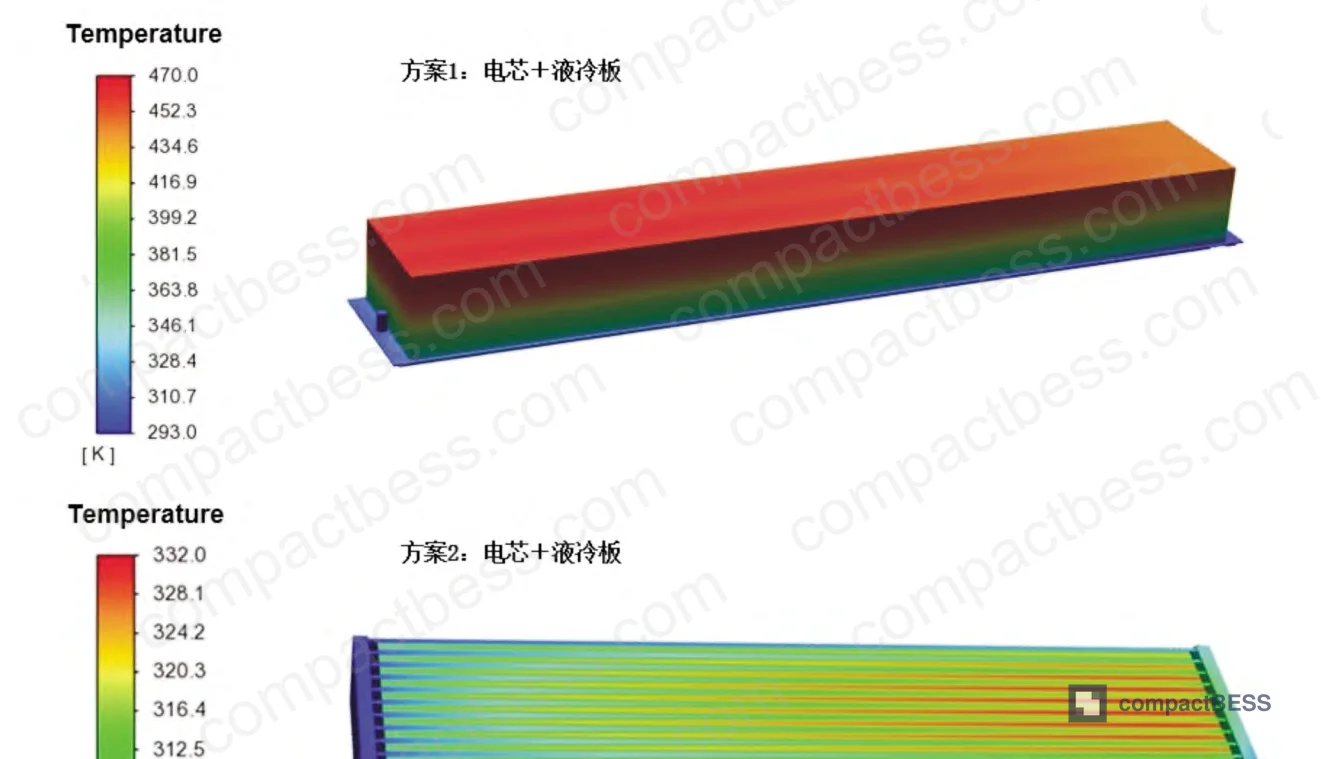
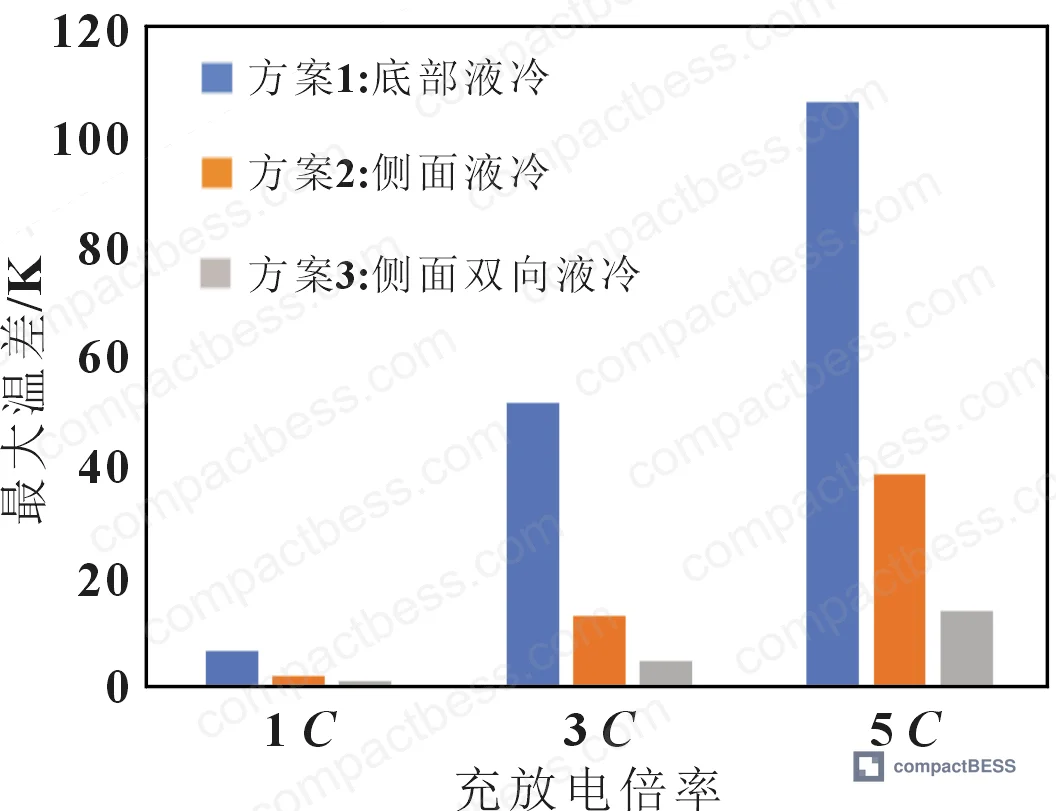
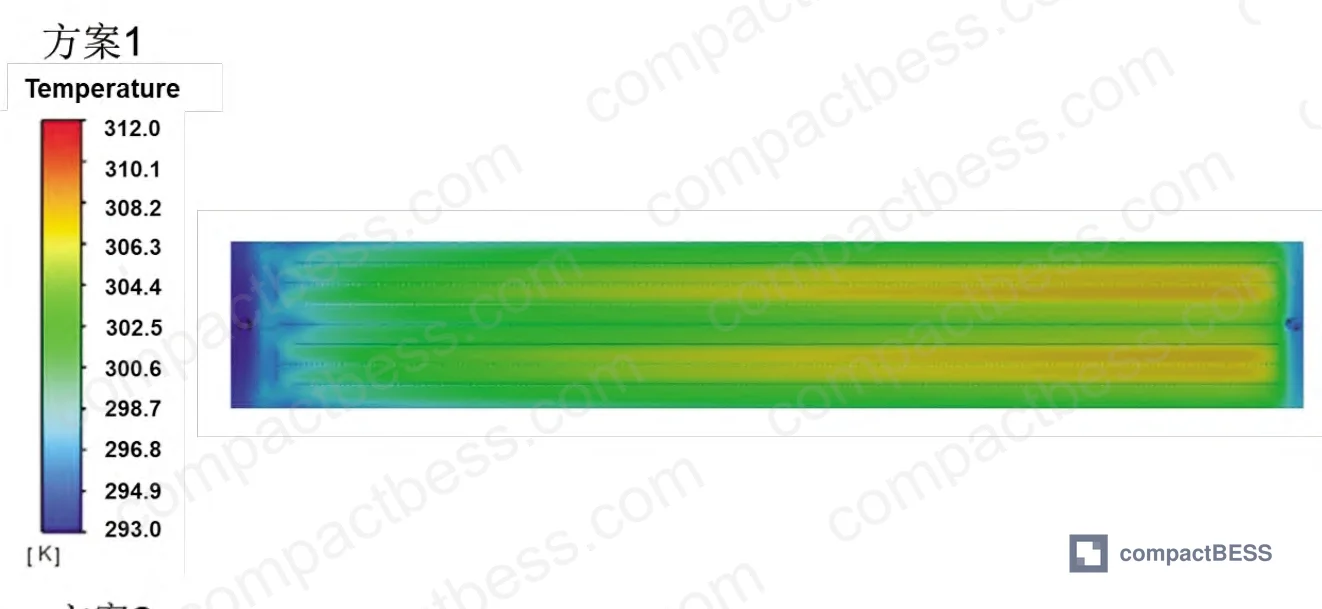
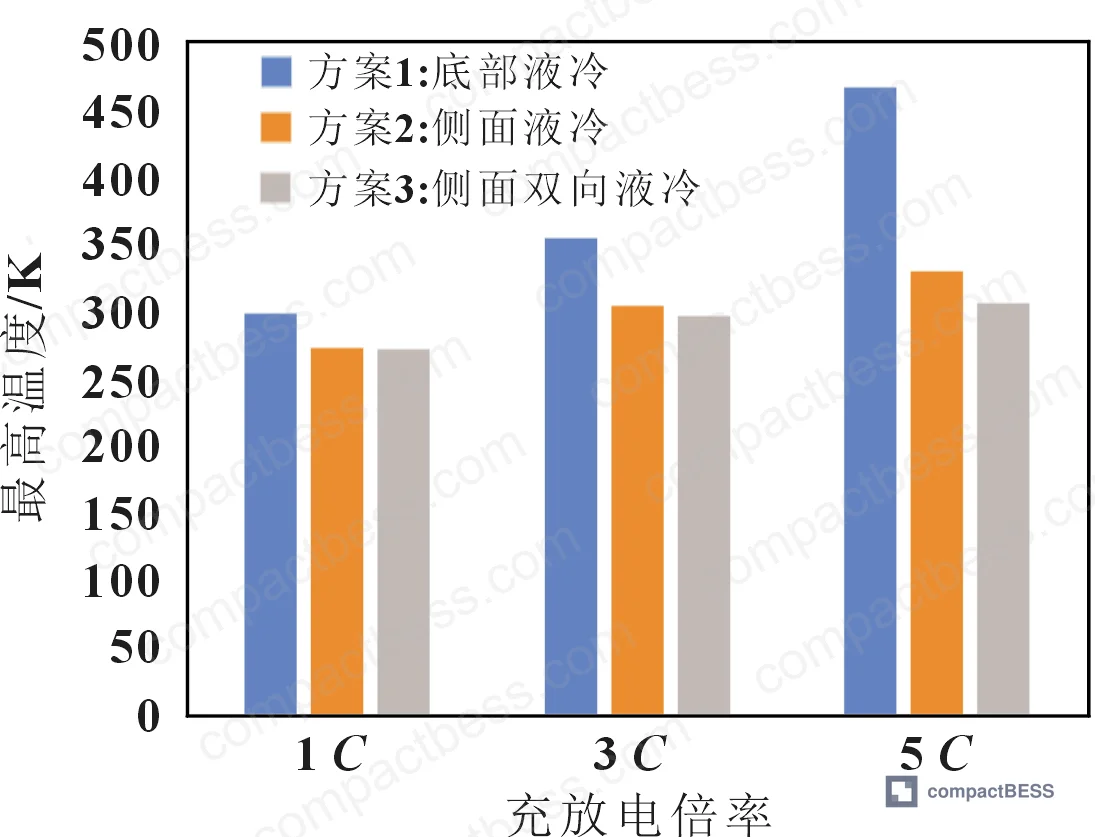
Scheme 1 — Bottom-mounted unidirectional plate. This is the classic approach: an 8-channel direct-flow cold plate sits under the cell stack, coolant enters at one end and exits the other. It’s the default choice for many Chinese ESS manufacturers because it’s simple to manufacture and easy to install. At 1 C, it produces a pack maximum temperature of 301 K — acceptable. The problem is the 6.5 K top-to-bottom temperature gradient even at that modest rate, already exceeding the 5 K uniformity limit. The physics are straightforward: LFP blade cells have a tangential-to-normal thermal conductivity ratio of 16.6:1. Heat generated in the upper portion of the cell simply cannot travel downward fast enough to reach the bottom cold plate. At 3 C, this design becomes dangerous — maximum cell temperature hits 357 K and the pack ΔT reaches 52 K. At 5 C, temperatures range 363–470 K, well past the 393 K thermal runaway risk threshold.
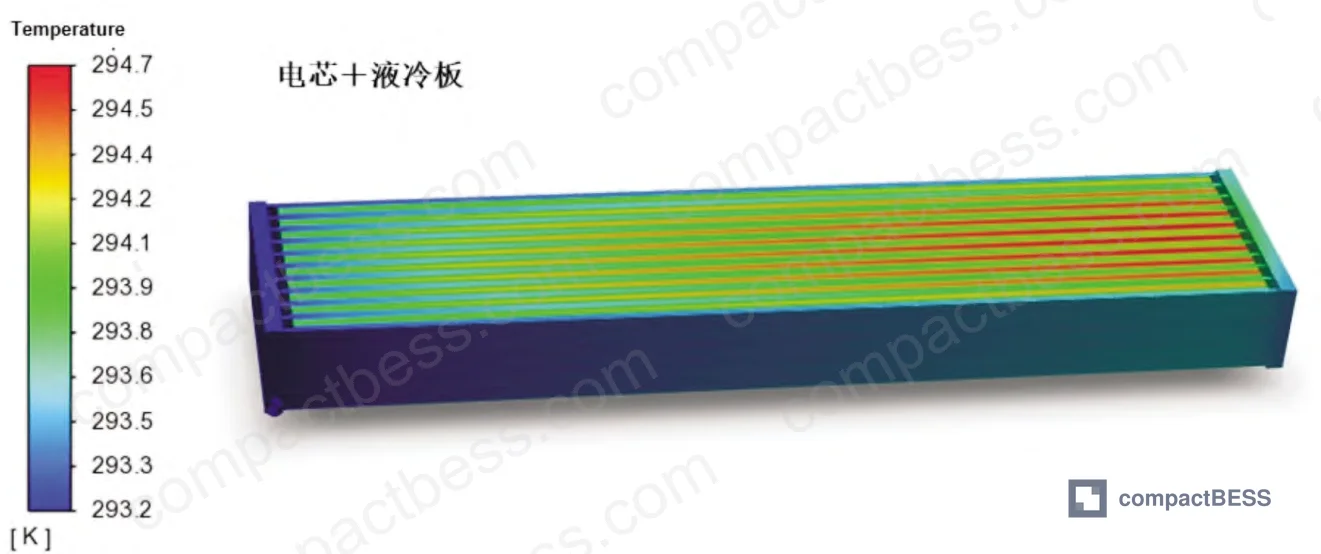
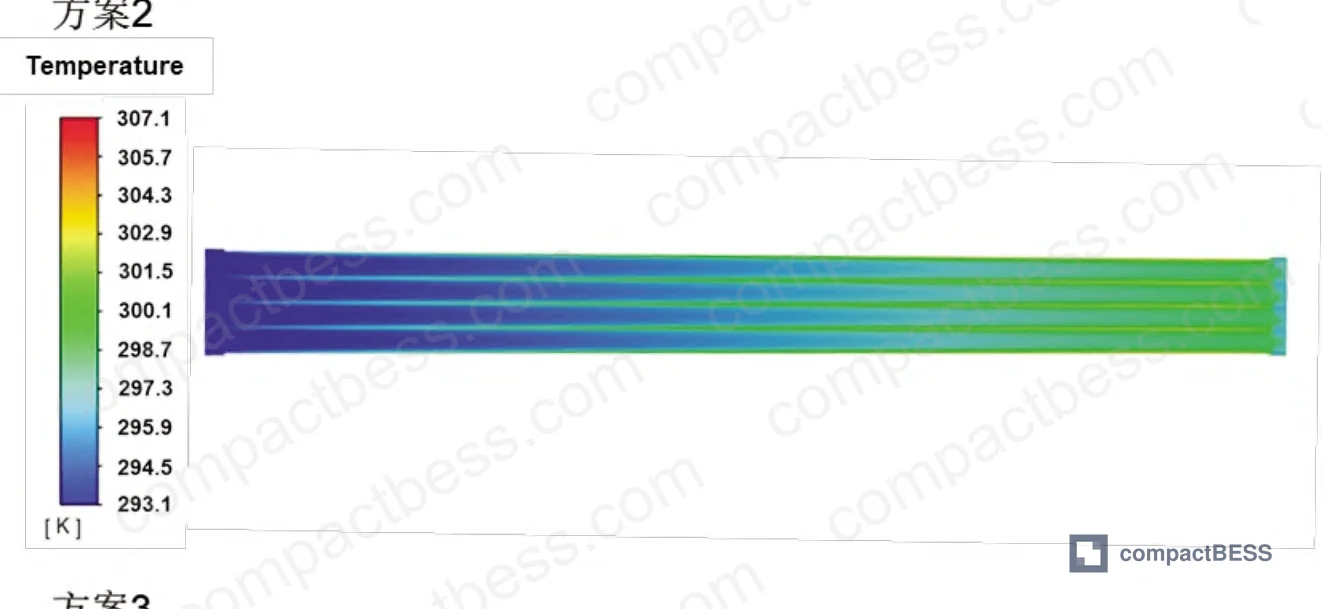
Scheme 2 — Side-mounted unidirectional plate. Moving the cold plate to the cell’s large face (side surface) dramatically improves contact area and cuts the heat conduction path. At 1 C, maximum temperature drops to 294.7 K and ΔT falls to 1.5 K — excellent. At 3 C, maximum temperature holds at 307 K, which is safe. But ΔT rises to ~13 K because the coolant progressively warms as it flows in one direction across the cell surface, creating a thermal gradient along the flow path. Temperature uniformity fails the 5 K requirement.
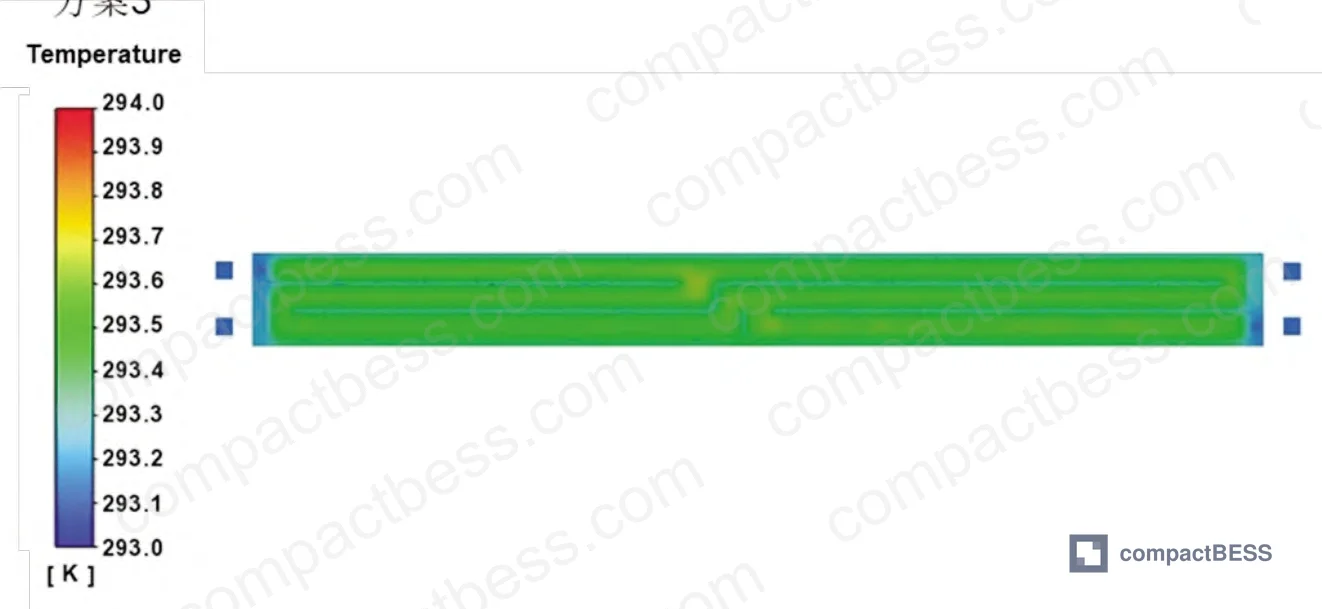
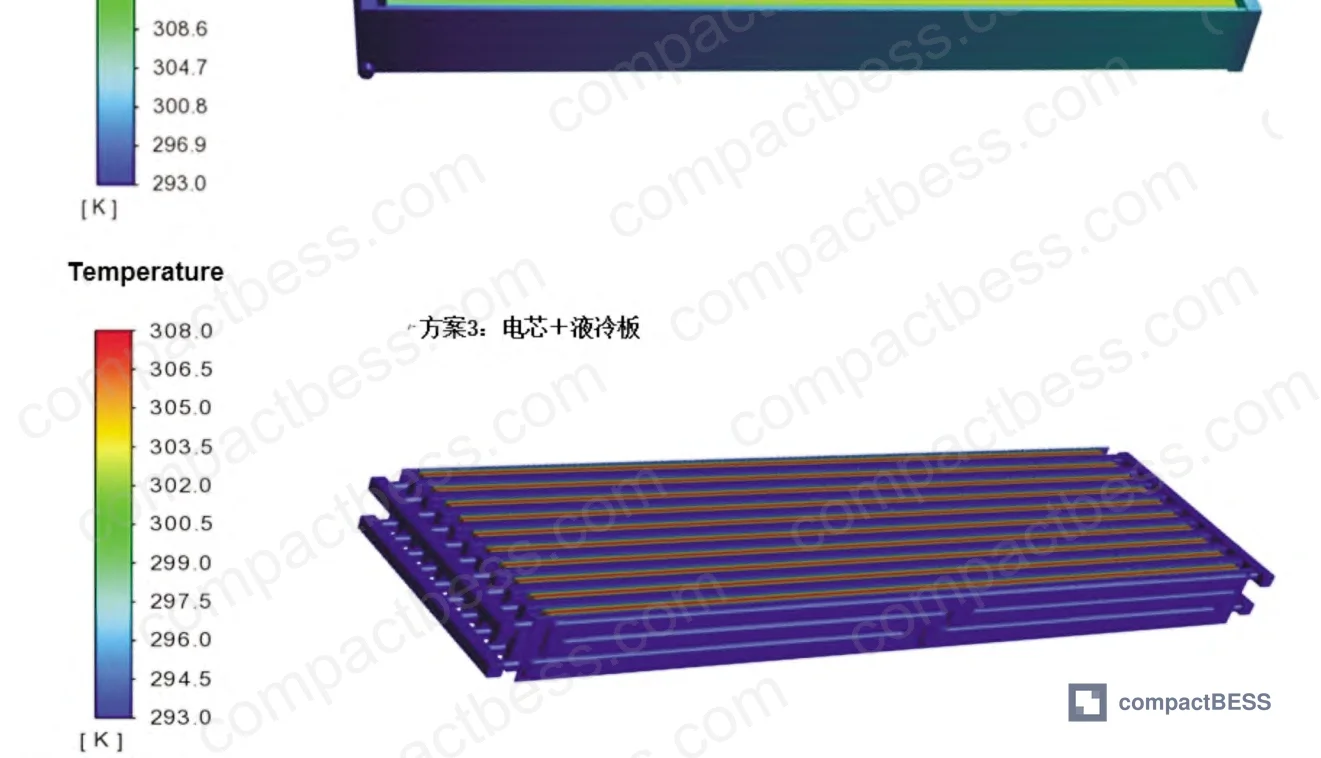
Scheme 3 — Side-mounted bidirectional counter-flow plate. Two inlets at the bottom, two outlets at the top. Coolant streams cross in opposing directions within interleaved channels, creating a reverse thermal compensation effect: where one stream is warming up, the opposing stream is still cold, effectively averaging the temperature profile across the cell face. An air gap between adjacent heat exchanger plates prevents thermal crosstalk between cells. At 3 C: maximum temperature 299 K, ΔT 4.8 K — both within spec simultaneously.
| Condition | Scheme 1 (Bottom Plate) | Scheme 2 (Side Unidirectional) | Scheme 3 (Side Counter-Flow) |
|---|---|---|---|
| 1 C — Tmax (K) | 301 | 294.7 | 294 |
| 1 C — ΔT (K) | 6.5 ❌ | 1.5 ✅ | 1 ✅ |
| 3 C — Tmax (K) | 357 ❌ | 307 ✅ | 299 ✅ |
| 3 C — ΔT (K) | 52 ❌ | ~13 ❌ | 4.8 ✅ |
| 5 C — Tmax (K) | 363–470 ❌ | 332 ⚠️ | 308 ✅ |
| 5 C — ΔT (K) | >100 ❌ | ~39 ❌ | ~14 ⚠️ |
✅ = meets both Tmax ≤ 313 K and ΔT ≤ 5 K requirements. ⚠️ = marginal. ❌ = fails one or both.
Honestly, most procurement teams over-specify coolant flow rate while under-specifying flow geometry. Adding more flow to a bottom-mounted plate doesn’t solve the fundamental top-to-bottom conduction bottleneck — it just increases pump energy consumption with diminishing thermal returns. The architecture matters more than the flow rate.
Thermal Runaway Risk and the 393 K Threshold in High-Rate ESS Applications #
The 393 K figure isn’t arbitrary. At that temperature, lithium intercalated in graphite begins reacting with electrolyte components and binder materials — an exothermic cascade that, once initiated, cannot be controlled by any external cooling system. This is the boundary between a recoverable thermal event and a runaway. Current grid-code and certification requirements under IEC 62619 (safety for stationary lithium cells and batteries) and UL 9540A (test method for thermal runaway propagation) both implicitly depend on your thermal management keeping cells far from this threshold during any credible operational scenario.
In supplier qualification, we’ve seen bottom-mounted cold plate designs from three different Chinese ESS manufacturers pass 1 C thermal validation but show projected temperatures exceeding 340 K at 2.5 C — rates that grid frequency regulation applications routinely demand. The validated condition was essentially irrelevant to the actual deployment scenario.
Most procurement teams don’t realize that the IEC 62619 standard was revised to include stricter requirements for cell-level temperature monitoring and pack-level ΔT limits — and that the 5 K uniformity target cited throughout this analysis aligns directly with those updated requirements. Specifying a cooling architecture that can’t sustain ΔT ≤ 5 K isn’t just a performance issue, it’s increasingly a compliance issue.
Optimal operating range for LFP cells is 293–313 K. When pack ΔT exceeds 5 K, cycle life degrades by more than 30%. At the 357 K peak observed under Scheme 1 at 3 C, you’re not just reducing cycle count — you’re potentially creating an insurance and certification liability.
Transport certification under UN 38.3 also requires evidence of safe thermal behavior under abuse conditions — a bottom-plate design that fails thermally at 3 C is a documentation problem waiting to surface at customs.
Counter-Flow Channel Design: Why the Geometry Produces the Result #
The performance advantage of Scheme 3 comes from a specific flow path geometry, not from any exotic materials or higher coolant flow rates. All three schemes use the same total inlet flow of 12 L/min and the same 50% EG coolant at 293.15 K. The difference is entirely structural.
In the bidirectional design, each side plate contains crossing channels where two opposing coolant streams flow in a counter-current pattern. As one stream absorbs heat and its temperature rises moving upward along the cell face, the opposing stream moving downward is still cool — so the warmer region of the cell always has a nearby cold coolant surface. This reverse compensation prevents the progressive heat buildup that causes the 13 K gradient in Scheme 2. Additionally, the air gap between adjacent side plates acts as thermal isolation, preventing cell-to-cell thermal crosstalk that would otherwise corrupt the uniformity benefit.
In CFD analysis of Scheme 1’s cold plate at 3 C, coolant temperature rose by 15 K from inlet to outlet across the plate — and the temperature distribution showed a characteristic center-hot, edge-cool profile caused by flow maldistribution in multi-channel straight-flow geometries. That 15 K rise in the coolant itself is what makes the top-to-bottom gradient in the cells inevitable, regardless of how much thermal interface material you apply.
The thermal interface between cold plate and cell also matters. All three schemes in this study used thermal interface material (TIM) — conductive silicone paste — applied at the plate-to-cell contact surfaces. Buyers should verify that supplier designs account for TIM compression set over cycle life, since degraded TIM conductivity is one of the most common failure modes in long-term liquid-cooled battery pack performance.
For buyers evaluating blade cell form factors specifically — which this 945 mm × 14 mm × 90 mm geometry represents — side-mounted cooling is essentially non-optional above 2 C sustained. The aspect ratio of blade cells makes bottom-only cooling geometrically inadequate for any real application. See our guide on blade cell formats and thermal design considerations for how format selection constrains your cooling architecture choices from the outset.
Practical Guidance for Buyers #
If your application involves grid frequency regulation, peak shaving with renewable integration, or any scenario where charge/discharge rates can spike above 2 C, a bottom-mounted cold plate is simply not a compliant solution — even if it passes the supplier’s standard thermal test. Demand that thermal validation data covers at minimum 1 C, 3 C, and your actual peak dispatch rate, with both Tmax and ΔT reported for each condition.
The 5 K temperature uniformity limit is the harder constraint to satisfy, and it’s the one most commonly omitted from supplier datasheets. Ask for it explicitly. If the supplier can only provide Tmax data, that’s a red flag — they may not have tested or modeled ΔT at all.
For pack-level specifications, the validated combination for 3 C operation is: side-mounted bidirectional counter-flow geometry, 50% EG coolant, 12 L/min total flow at 293.15 K inlet — delivering Tmax = 299 K and ΔT = 4.8 K simultaneously. Use those as baseline acceptance criteria for any high-rate application.
Buyers also need to account for the anisotropic thermal conductivity of LFP blade cells when reviewing supplier simulation data. If a supplier’s thermal model treats cell conductivity as isotropic (single value), their temperature predictions for the top-to-bottom gradient are likely optimistic by a wide margin. The 16.6:1 ratio between tangential (18.3 W/m·K) and normal (1.1 W/m·K) conductivity is the physical reason bottom-plate cooling fails at high rates.
At CompactBESS, we work with global OEM buyers and energy storage integrators who need to evaluate and qualify Chinese manufacturers of liquid-cooled battery packs and thermal management subsystems — with verified suppliers capable of producing counter-flow cold plate assemblies to application-specific thermal performance targets. If you’re shortlisting suppliers for a grid-scale project and need thermal qualification support, our sourcing team can help you structure the RFQ and identify manufacturers with validated high-rate cooling data.
Need help identifying qualified suppliers for bidirectional counter-flow liquid cooling systems? Talk to our sourcing team →
Supplier Qualification Questions #
- Can you provide CFD simulation or physical test data showing simultaneous Tmax ≤ 313 K and ΔT ≤ 5 K at 3 C continuous charge rate for your current liquid cooling design?
- Does your thermal model account for anisotropic cell conductivity — specifically the tangential-to-normal ratio of 18.3:1.1 W/(m·K) for LFP blade cells — or does it use a single isotropic conductivity value?
- What is the measured or simulated coolant temperature rise (ΔTcoolant) from inlet to outlet in your cold plate at 3 C? If it exceeds 10 K, what compensating design feature prevents this from translating to cell-level thermal non-uniformity?
- At 5 C ultra-high-rate discharge, what is your pack’s maximum predicted or measured cell temperature, and does it demonstrate a safety margin below the 393 K thermal runaway risk threshold?
- What thermal interface material (TIM) is applied between cold plate and cell, what is its initial thermal conductivity (W/m·K), and do you have data showing TIM performance retention after 1,000 thermal cycles representative of the target application?
Sourcing Checklist #
- [ ] Supplier provides thermal validation data at both 3 C and 5 C charge/discharge rates — not only at 1 C nominal conditions
- [ ] Pack ΔT ≤ 5 K confirmed at 3 C rate per simulation or physical test, with methodology documented
- [ ] Maximum cell temperature Tmax ≤ 313 K confirmed at 3 C, and Tmax < 393 K confirmed at 5 C (thermal runaway threshold margin)
- [ ] Cold plate geometry is side-mounted (not bottom-only) for blade or prismatic cell formats with height-to-width ratio > 5:1
- [ ] CFD model uses anisotropic thermal conductivity values — tangential ≥ 18 W/(m·K), normal ≤ 1.5 W/(m·K) — not a single isotropic value
- [ ] Coolant specification is documented: concentration, inlet temperature, and total flow rate (reference: 50% EG, 293.15 K inlet, 12 L/min for 10-cell series blade pack)
- [ ] Product design or documentation confirms compliance with IEC 62619 cell and battery safety requirements and GB/T 36276 stationary lithium battery standard
- [ ] TIM conductivity specification provided with degradation data over thermal cycling
Key Specifications Table #
| Parameter | Recommended Value | Verification Method |
|---|---|---|
| Maximum cell temperature (Tmax) at 3 C | ≤ 313 K (≤ 40°C) | CFD simulation or thermocouple array test at rated 3 C discharge; report peak steady-state value |
| Cell-to-cell temperature uniformity (ΔT) at 3 C | ≤ 5 K | Same test as above; record difference between highest and lowest cell surface temperature simultaneously |
| Maximum cell temperature at 5 C (emergency/fault condition) | < 393 K | Simulation at 5 C with worst-case initial conditions (Tinit = 298 K); confirm margin to thermal runaway threshold |
| Coolant inlet temperature | 293.15 K (20°C) | Calibrated RTD or thermocouple at cold plate inlet; verify against chiller setpoint |
| Total coolant flow rate | 12 L/min per pack module | Inline flow meter; cross-check against pump curve at measured system pressure drop |
| Cell tangential thermal conductivity | 18.3 W/(m·K) | Laser flash analysis (LFA) per ASTM E1461 on cell cross-section specimen |
| Cell normal thermal conductivity | 1.1 W/(m·K) | LFA per ASTM E1461 in through-thickness direction |
| TIM thermal conductivity at cold plate interface | ≥ 3 W/(m·K) | Supplier TDS plus hot-disk or guarded heat flow measurement on assembled interface |
Can’t find a supplier meeting these specs? Submit your requirements and we’ll match you within 48 hours.
Frequently Asked Questions #
Q: Why does bottom-mounted liquid cooling fail at high C-rates even with adequate coolant flow?
The failure mode is thermal conductivity, not coolant capacity. LFP blade cells have a normal-direction (top-to-bottom) thermal conductivity of just 1.1 W/(m·K) — roughly 16 times lower than the tangential direction. No matter how much coolant flows beneath the cell, heat generated in the upper portion of a tall blade cell cannot travel downward fast enough to reach the cold plate. At 3 C, this creates a 52 K gradient in bottom-plate designs — the coolant is fine, the cell itself is the bottleneck.
Q: What is the practical significance of the 5 K temperature uniformity limit?
When ΔT across a battery pack exceeds 5 K, cells at different temperatures cycle at different effective rates, age at different rates, and reach different states of charge at nominal “full” — all of which compound over thousands of cycles. Field data and simulation studies consistently show cycle life degradation exceeding 30% once this threshold is breached consistently. For a grid storage asset with a 10–15 year design life, that’s not a minor performance penalty.
Q: Can a side-mounted unidirectional plate be upgraded to counter-flow by changing manifolding, or does it require a complete redesign?
Complete redesign. The counter-flow performance depends on internal channel geometry — the crossing, interleaved flow paths within each plate — not just external manifold routing. Retrofitting a unidirectional plate with reversed outlet connections will not replicate the thermal compensation mechanism. Suppliers offering a “counter-flow upgrade” via manifold changes only should be asked to provide before/after ΔT simulation data.
Q: Is 5 C a realistic operating condition to design for in grid storage?
Not as a sustained operating mode — but as a transient. Grid applications involving frequency regulation or renewable curtailment recovery can impose very high instantaneous charge rates for durations of 30 seconds to several minutes. The simulation data at 5 C is valuable precisely because it models the thermal margin available during these transients. A design that reaches 470 K under Scheme 1 at 5 C has essentially zero fault tolerance.
Q: What certifications should I require for liquid-cooled ESS packs intended for stationary grid applications?
At minimum: IEC 62619 for stationary lithium battery safety, UN 38.3 for transport, and UL 9540A if the installation is subject to North American building or fire codes. For EU markets, verify compliance with the EU Battery Regulation 2023/1542 which includes due diligence and safety requirements for stationary storage. Also check whether your project requires GB/T 36276 compliance for Chinese-manufactured systems. See our IEC 62619 industrial safety guide for what these certifications actually require from your thermal management system.
Published by compactbess.com Technical Team | Request a sourcing quote
Data source: Thermal Performance Evaluation of Bidirectional Counter-Flow Liquid Cooling Plates for High-Rate Grid-Scale Energy Storage Battery Packs, H. Zhang et al., Journal of the Electrochemical Society, 2024
Content reviewed by dr.james.okafor | © compactbess.com — All rights reserved. Unauthorized reproduction prohibited.


