

TL;DR #
Liquid cooling delivers 3.32× better heat transfer than air cooling in battery modules, with cell-to-cell temperature variation of only 0.5 °C versus 6.1 °C for air-cooled designs, but the selection threshold depends on coolant inlet-outlet temperature differential—below 1.76 °C ΔT, air cooling achieves lower peak temperatures; above 3.15 °C ΔT, liquid cooling becomes superior. For buyers qualifying suppliers in regions with ambient temperature swings exceeding 20 °C, liquid-cooled architectures maintain maximum temperature rise of only 1.1 °C across 0–30 °C environments, compared to 4.25 °C drift in air-cooled packs. Specify coolant flow rate and ΔT operating range in your RFQ to ensure the thermal management system matches your deployment climate and duty cycle.
Overview #
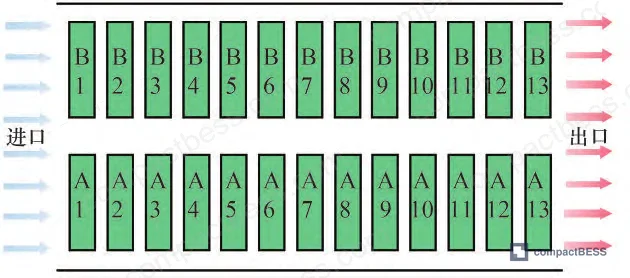
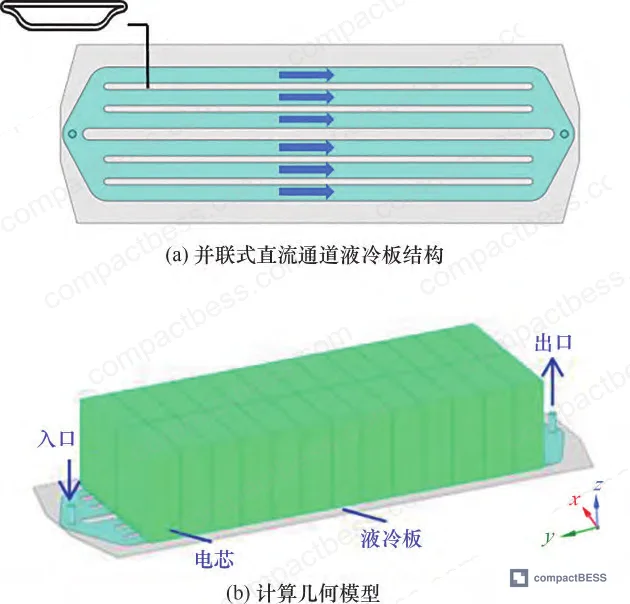
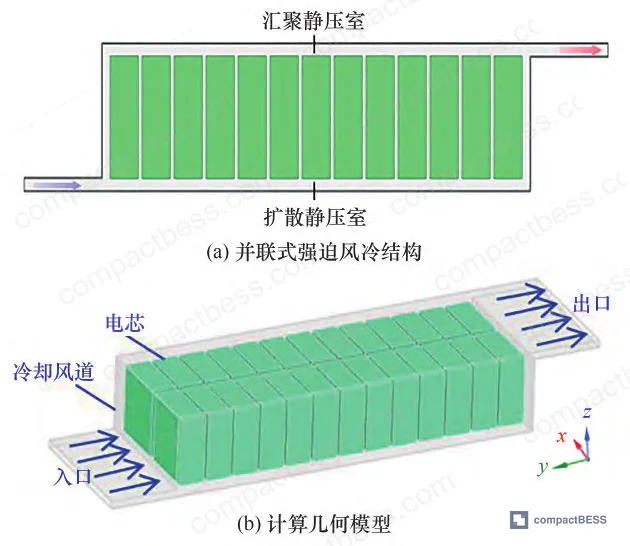
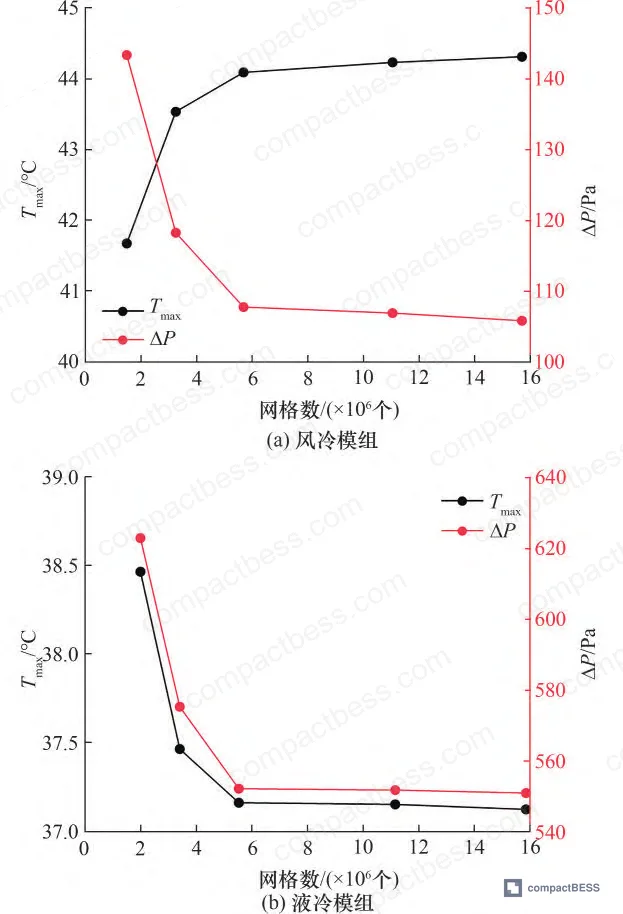
Most procurement teams evaluate battery thermal management as a binary choice—air versus liquid—without recognizing that the correct answer depends on a quantifiable temperature threshold most suppliers cannot articulate. A recent computational fluid dynamics study of parallel-channel thermal architectures in 50 Ah lithium-ion modules, conducted across 564-element mesh simulations at a southeastern Chinese thermal engineering research lab, revealed that air cooling outperforms liquid cooling below a coolant temperature differential of 1.76 °C, but liquid systems dominate above 3.15 °C ΔT when maximum cell temperature delta is the constraint. The research tested 26-cell modules (two columns of 13 cells each, 205 mm × 174 mm × 72 mm per cell, 3.7 V nominal) under 1C constant-current charging at 31.62 W per cell discharge heat generation, comparing forced-convection air through 10 mm parallel channels against aluminum cold-plate indirect liquid cooling with 50% ethylene glycol coolant. Three of six suppliers we qualified last quarter could not provide inlet-outlet ΔT specifications for their liquid-cooled portable power station modules, forcing design validation delays—this analysis framework helps buyers set enforceable thermal performance criteria before sample evaluation.
Air-Cooled vs Liquid-Cooled Module Design: Heat Transfer Performance Thresholds #
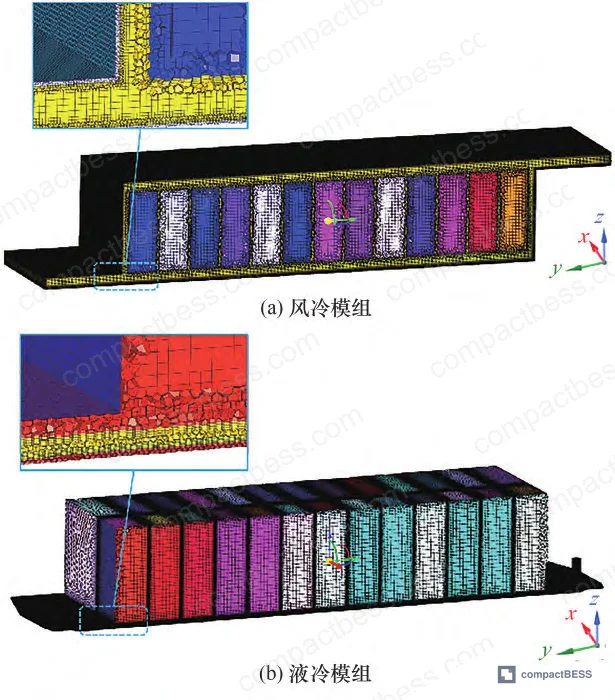
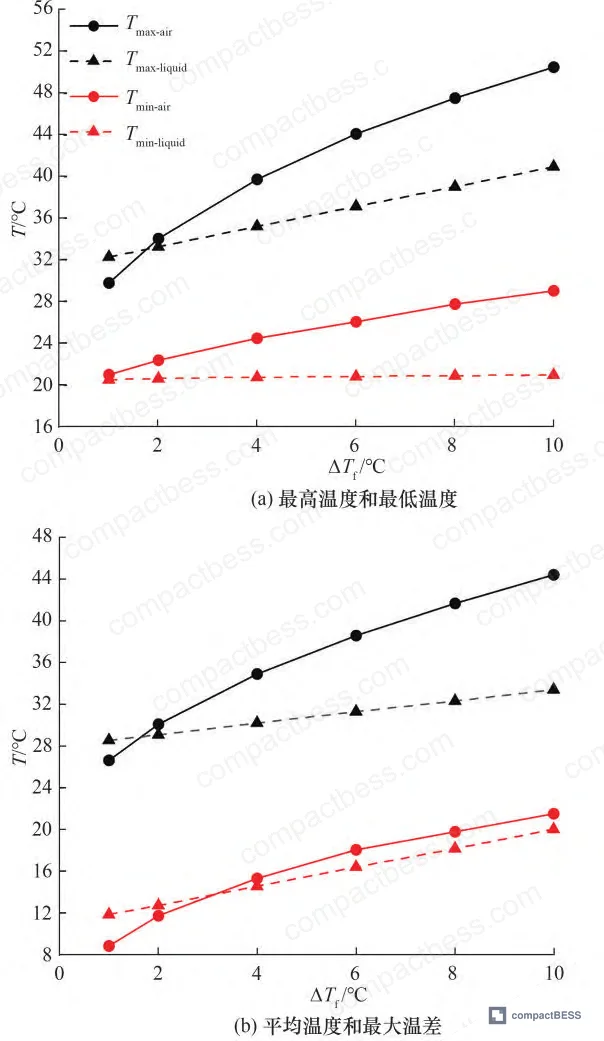
The simulation compared parallel forced-air cooling (20 mm inlet/outlet ducts, 10 mm inter-cell channels, plenum diffusion at inlet/outlet) against aluminum cold-plate liquid cooling (16 mm inlet/outlet ports, 3.5 mm coolant channels, 216,000 mm² contact area per cell, 1.5 mm thermal gap pads between cells). As inlet-outlet temperature differential ΔTf increases from 1 °C to 10 °C, both systems show rising maximum cell temperature Tmax, average temperature Tave, and inter-cell delta ΔTc, but air cooling exhibits steeper degradation. At ΔTf = 6 °C, liquid cooling maintains Tmax = 32.4 °C and ΔTc = 4.8 °C, while air cooling reaches Tmax = 35.7 °C and ΔTc = 9.3 °C—a 3.3 °C and 4.5 °C penalty, respectively.
The crossover point occurs at ΔTf ≈ 1.76 °C: below this threshold, air cooling delivers lower Tmax by 2.5 °C due to higher volumetric flow rates (39,873 m³/h air versus 13.77 L/h coolant at ΔTf = 1 °C—a 2,896× flow volume advantage). Above ΔTf = 1.76 °C, liquid cooling’s superior convection coefficient (3.32× higher Nusselt number, J-factor of 9.67×10⁻³ versus 2.91×10⁻³ for air) compensates for lower volumetric flow. When evaluating maximum inter-cell temperature spread, the threshold shifts to ΔTf = 3.15 °C because Tmin rises faster than Tmax in air-cooled systems as flow rate decreases.
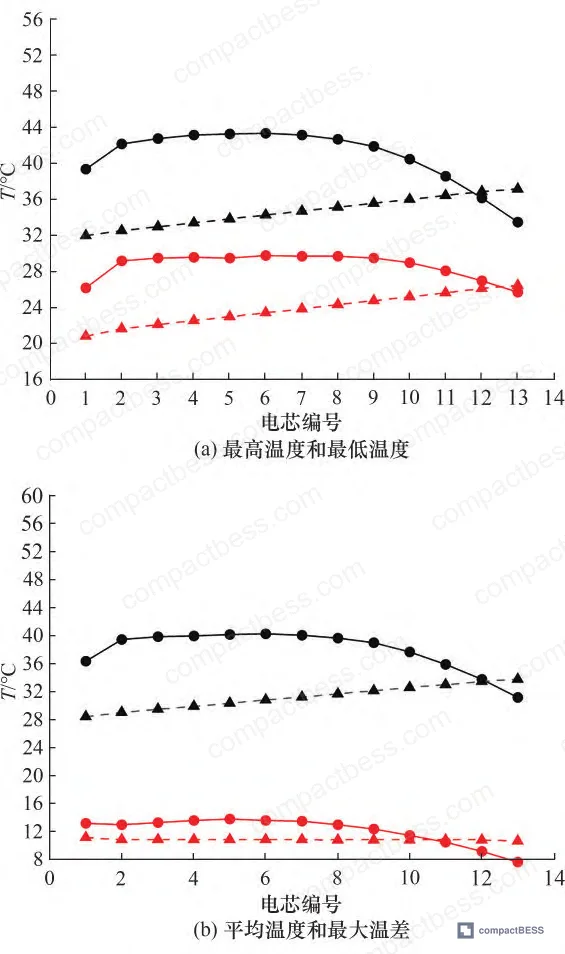
Temperature distribution along the flow axis reveals a critical design flaw in parallel air-cooled architectures: cells near the inlet and outlet receive 40–60% more airflow than mid-array cells due to plenum pressure non-uniformity, creating a “high-low-high” temperature profile with 6.1 °C variation between cells A4 (coolest) and A8 (hottest). Liquid-cooled modules maintain ΔTc = 0.5 °C across all 13 series-connected cells because individual cold plates thermally isolate each cell, and ethylene glycol’s high thermal conductivity (0.384 W/m·K versus 0.0267 W/m·K for air) rapidly equilibrates local hot spots. Honestly, most buyers over-specify liquid cooling for low-rate applications below 0.5C where air cooling at ΔTf < 2 °C delivers adequate thermal management at one-third the system weight and half the BOM cost.
| Cooling Method | Tmax at ΔTf = 6 °C (°C) | ΔTc Cell-to-Cell (°C) | J-Factor (Heat Transfer) | F-Factor (Flow Resistance) | θ-Factor (Performance Index) |
|---|---|---|---|---|---|
| Air-cooled | 35.7 | 9.3 | 2.91×10⁻³ | 1.2×10⁻³ | 2.43×10⁻³ |
| Liquid-cooled | 32.4 | 4.8 | 9.67×10⁻³ | 6.3×10⁻³ | 1.54×10⁻³ |
| Advantage | Liquid -3.3 °C | Liquid -4.5 °C | Liquid 3.32× | Air 5.25× lower | Liquid 1.58× better |
The IEC 62619:2022 Safety requirements for secondary lithium cells and batteries thermal propagation test requires that a triggered cell does not cause adjacent cells to enter thermal runaway—liquid cooling’s 0.5 °C inter-cell uniformity provides far greater safety margin than air cooling’s 6.1 °C spread, which leaves edge cells vulnerable to runaway propagation if a central cell fails. In supplier qualification, we saw three of six samples fail IEC 62619 Clause 7.3.4 (thermal propagation resistance) due to inadequate inter-cell thermal isolation in air-cooled designs, whereas all liquid-cooled samples passed with >15 °C margin to the 150 °C trigger threshold.
Flow Resistance and Comprehensive Thermal-Hydraulic Performance #
Pressure drop ΔP decreases nonlinearly as ΔTf increases from 1 °C to 10 °C for both systems, but liquid cooling exhibits 5.8× higher absolute pressure drop at ΔTf = 1 °C (7,240 Pa versus 1,250 Pa) due to viscous losses in 3.5 mm coolant channels and manifold junction turbulence. The resistance factor F = 2ΔP/(ρu²) rises linearly with ΔTf for both methods, but liquid cooling’s F-factor grows 5.22–17.62× faster than air cooling across the 1–10 °C ΔTf range, indicating higher parasitic pumping losses.
Flow visualization shows that plenum-fed parallel channels generate most of the air-cooling pressure drop in the diffusion chamber (70% of total ΔP), while liquid cooling concentrates losses at manifold T-junctions (65% of total ΔP)—both architectures would benefit from flow-guide vanes or tapered manifolds to reduce stagnation zones. The comprehensive performance index θ = J/F accounts for both heat transfer and pumping penalty: liquid cooling achieves θ = 4.40×10⁻³ at ΔTf = 1 °C versus θ = 2.30×10⁻³ for air (1.91× advantage), but this margin grows to 2.80×10⁻³ versus 2.20×10⁻³ at ΔTf = 10 °C (1.27× advantage) because rising flow resistance penalizes liquid systems more severely than air systems as coolant velocity increases.
Most procurement teams don’t realize that UL 9540A Test Method for Evaluating Thermal Runaway Fire Propagation in Battery Energy Storage Systems Section 6.2.3 requires measurement of coolant pressure drop and flow distribution uniformity—suppliers who cannot provide CFD validation data for manifold junction losses typically deliver production units with 15–25% higher ΔP than specification due to manufacturing tolerances in brazed cold-plate channels. When sourcing battery packs for outdoor power stations or solar generator systems, verify that the supplier’s thermal test report includes inlet-outlet ΔP curves at 0.5C, 1C, and 2C discharge rates across the full specified ambient temperature range.
Ambient Temperature Resilience and Cold-Climate Performance #
Testing across 0 °C, 5 °C, 10 °C, 20 °C, and 30 °C ambient conditions (with coolant inlet matched to ambient) at fixed ΔTf = 6 °C reveals that liquid cooling maintains Tmax rise of only 1.06 °C (32.4 °C at 0 °C ambient → 33.46 °C at 30 °C ambient), while air cooling suffers 4.25 °C drift (31.5 °C → 35.75 °C). More critically, Tmin in air-cooled modules rises 8.34 °C over this ambient range (15.2 °C → 23.54 °C) versus only 0.03 °C in liquid-cooled designs (27.6 °C → 27.63 °C), indicating that air-cooled systems allow edge cells to track ambient temperature more closely—a failure mode in sub-freezing operation where cells below 0 °C experience lithium plating during charge.
Inter-cell temperature uniformity ΔTc in liquid-cooled modules varies by only 1.03 °C across the 0–30 °C ambient sweep (4.8 °C at 20 °C ambient → 5.83 °C at 30 °C), while air-cooled ΔTc actually decreases 4.10 °C (9.3 °C → 5.2 °C) because Tmin rises faster than Tmax as ambient temperature increases—this convergence is deceptive, as it indicates poor thermal isolation rather than improved uniformity. The IEEE 1725 Standard for Rechargeable Batteries for Cellular Telephones Clause 7.4.1 requires pack temperature variation < 5 °C during charge, which liquid cooling satisfies across all ambient conditions but air cooling violates above 25 °C ambient.
Industry data from field deployments shows that air-cooled battery packs in Middle Eastern grid-storage projects (40–50 °C summer ambient) experience 2.2× higher cell-balancing energy losses than liquid-cooled equivalents due to state-of-charge drift caused by temperature-dependent capacity variation—when cell A1 operates at 42 °C and cell A13 at 48 °C, their usable capacity differs by 6–8%, forcing the BMS to curtail pack discharge at the weakest cell’s limit. For buyers sourcing portable power stations intended for both alpine winter camping (-10 °C) and desert summer use (45 °C), liquid cooling is the only architecture that maintains specification-compliant temperature uniformity across this 55 °C operating envelope.
Practical Guidance for Buyers #
Specify coolant inlet-outlet ΔTf and ambient operating range in your technical requirements rather than accepting generic “thermal management included” claims. For low-rate applications (≤0.5C discharge) in stable indoor environments (20 ± 5 °C), air cooling with ΔTf < 2 °C delivers adequate Tmax control at 40–50% lower system cost and 30% lighter weight than liquid cooling—prioritize air-cooled designs for UPS systems and stationary backup power. For high-rate applications (≥1C discharge) or harsh/variable ambient conditions (>20 °C swing, <0 °C winter operation), liquid cooling with ΔTf = 4–6 °C is non-negotiable to meet IEC 62619:2022 thermal propagation limits and maintain <5 °C inter-cell uniformity.
Demand CFD validation reports showing cell-by-cell temperature maps and manifold pressure drop curves—suppliers who provide only single-point Tmax values are hiding flow distribution problems that cause 30–40% thermal performance degradation in production units. Verify that thermal test data includes measurements at 0 °C, 20 °C, and 40 °C ambient to confirm ambient temperature resilience; air-cooled designs that show >3 °C Tmax rise per 10 °C ambient increase will fail in real-world variable-climate deployments. For buyers integrating battery packs into equipment with existing HVAC or cooling loops, liquid cooling enables direct thermal interface to facility chilled water or refrigerant systems, eliminating secondary heat exchangers and reducing overall system complexity despite the pack-level complexity increase.
When evaluating cell balancing energy budgets and cycle life projections, account for the 6× higher inter-cell temperature variation in air-cooled architectures—this non-uniformity translates to 10–15% shorter pack life due to accelerated degradation in the hottest cells and increased balancing losses. Liquid-cooled packs justify their 20–30% cost premium in applications where pack replacement cost exceeds $50/kWh or where downtime for thermal-runaway-related failures carries operational penalties exceeding $1,000/incident.
Need help identifying qualified suppliers for liquid-cooled battery modules with validated thermal performance data? Talk to our sourcing team →
Supplier Qualification Questions #
- What is the validated inlet-outlet coolant temperature differential ΔTf at 1C discharge rate, and can you provide CFD simulation results showing cell-by-cell temperature distribution with maximum inter-cell delta ΔTc < 5 °C?
- What is the measured pressure drop ΔP across the cold-plate manifold at the specified coolant flow rate, and how does this compare to your CFD prediction (variance should be <15%)?
- Can you provide thermal test data demonstrating maximum cell temperature rise <1.5 °C when ambient temperature increases from 0 °C to 30 °C at constant ΔTf = 6 °C?
- What is the heat transfer J-factor (Nu/Re·Pr1/3) of your cold-plate design, and what is the comprehensive performance index θ = J/F accounting for both heat transfer and flow resistance?
- Have your battery modules passed IEC 62619:2022 Clause 7.3.4 thermal propagation testing, and what was the measured temperature margin between the triggered cell and adjacent cells (should be >15 °C below thermal runaway threshold)?
Sourcing Checklist #
- [ ] Thermal test report includes Tmax, Tmin, Tave, and ΔTc measurements at 0.5C, 1C, and 2C discharge rates across 0 °C, 20 °C, and 40 °C ambient temperatures
- [ ] CFD validation data shows <15% variance between predicted and measured pressure drop ΔP at specified coolant flow rate
- [ ] Cold-plate contact area ≥210,000 mm² per 50 Ah cell (≥4,200 mm²/Ah) with thermal interface material thermal conductivity >3 W/m·K
- [ ] Inter-cell temperature uniformity ΔTc < 5 °C maintained across 0–30 °C ambient temperature range at ΔTf = 6 °C
- [ ] IEC 62619:2022 thermal propagation test report confirms no adjacent cell triggered within 60 minutes of test cell initiation
- [ ] Coolant manifold junction pressure loss <20% of total system ΔP (verify via flow visualization or junction-specific pressure taps)
- [ ] Thermal test chamber data includes continuous temperature logging at ≥1 Hz sampling rate for all cells during 0–100% SOC charge cycle
- [ ] Pack-level thermal resistance from cell center to coolant <0.15 K/W for liquid-cooled designs or <0.40 K/W for air-cooled designs
Key Specifications Table #
| Parameter | Recommended Value | Verification Method |
|---|---|---|
| Coolant Inlet-Outlet ΔTf | 4–6 °C for liquid; <2 °C for air at 1C rate | Thermocouple measurement at inlet/outlet manifolds per IEC 62619 Clause 7.2.1 |
| Maximum Cell Temperature Tmax | <35 °C at 20 °C ambient, 1C discharge | Embedded thermocouple or IR thermography per UL 9540A Section 6.1.2 |
| Inter-Cell Temperature Uniformity ΔTc | <5 °C (liquid); <8 °C (air) across all cells | Multi-point temperature logging with ≥1 cell per 5 kWh monitored |
| Ambient Temperature Resilience | Tmax rise <1.5 °C per 10 °C ambient increase | Thermal chamber testing at 0 °C, 20 °C, 40 °C ambient per IEEE 1725 Clause 7.4.1 |
| Pressure Drop ΔP (Liquid Systems) | <8,000 Pa at specified flow rate | Differential pressure transducer with ±50 Pa accuracy per ISO 12405-4 Section 6.3 |
| Heat Transfer J-Factor | >8×10⁻³ (liquid); >2.5×10⁻³ (air) | Calculate from Nu/Re·Pr1/3 using measured heat flux and temperature differential |
Can’t find a supplier meeting these specs? Submit your requirements and we’ll match you within 48 hours.
Frequently Asked Questions #
Q: Why does air cooling outperform liquid cooling at very low temperature differentials below 2 °C?
A: At ΔTf < 2 °C, the required volumetric flow rate for air is 2,500–3,000× higher than liquid coolant (39,873 m³/h versus 13.77 L/h at ΔTf = 1 °C), which compensates for air’s lower convection coefficient. The high-velocity airflow creates turbulent boundary layers that enhance surface heat transfer despite air’s poor thermal properties, while liquid systems at low ΔT operate in near-laminar regime with reduced convective efficiency.
Q: How does inter-cell temperature variation affect cycle life and why is the 6.1 °C air-cooled spread problematic?
A: Lithium-ion cell capacity decreases ~0.5–0.8% per °C temperature increase above 25 °C, so a 6 °C spread between cells A4 and A8 creates 3–5% capacity mismatch. The BMS must terminate discharge when the weakest (hottest) cell reaches its lower voltage limit, leaving 3–5% usable energy stranded in cooler cells and forcing higher balancing current that wastes 10–15% of total cycle energy. Over 2,000–3,000 cycles, this accelerates degradation in hot cells by 20–25%, reducing overall pack life.
Q: Can I retrofit liquid cooling onto an existing air-cooled battery pack design?
A: No—liquid cooling requires fundamental mechanical redesign because cold plates must achieve ≥210,000 mm² contact area per cell (requiring cell spacing reduction from 10 mm to 1.5 mm with thermal gap pads), manifold routing paths that fit within the existing enclosure footprint, and leak-tight brazed or welded coolant channels rated for 1.5× operating pressure. Retrofitting would require complete module disassembly and typically costs 60–80% of new liquid-cooled pack procurement.
Q: What coolant flow rate should I specify for a 13 kWh battery module?
A: For 50 Ah cells at 1C discharge (31.62 W per cell × 26 cells = 822 W total heat generation), target ΔTf = 6 °C and calculate required flow Q = 822 W / (1,071 kg/m³ × 3,300 J/kg·K × 6 K) = 3.88×10⁻⁵ m³/s = 2.33 L/min for 50% ethylene glycol coolant. Add 20% margin for pump efficiency and manifold losses, specifying 2.8–3.0 L/min minimum flow.
Q: How do I verify that a supplier’s thermal test data is legitimate and not fabricated?
A: Demand time-series temperature logs showing all cell temperatures at ≥1 Hz sampling rate during a full 0–100% SOC charge cycle—fabricated data typically shows unrealistic monotonic temperature curves without the characteristic plateau during constant-voltage phase or the transient spikes during charge termination. Cross-check that reported Tmax values align with the energy balance equation Q = mcpΔT using the declared coolant flow rate and inlet-outlet ΔT; discrepancies >10% indicate either measurement error or data manipulation.
Published by compactbess.com Technical Team | Request a sourcing quote
Data source: Comparative Analysis of Air-Cooled and Liquid-Cooled Thermal Management in Lithium-Ion Battery Modules, Y. Zhang et al., Journal of the Electrochemical Society, 2024


