

TL;DR #
Field testing of four 10 kV, 6 MW power conversion system topologies under identical load conditions revealed that cascaded H-bridge configurations achieve 1.8–2.1% total harmonic distortion (THD) with 0.7 mH filtering—matching modular multilevel converter (MMC) performance at 58% of the material cost. This means procurement teams specifying medium-voltage battery energy storage systems can eliminate 300+ discrete components per megawatt while maintaining IEC 62619:2022 Safety requirements for secondary lithium cells and batteries compliance. Prioritize cascaded H-bridge architectures for projects where unit economics matter more than marginal efficiency gains.
Overview: Topology Selection Drives System Economics in 10 kV Battery Storage #
Most procurement engineers approach power conversion system (PCS) selection backward—they start with vendor datasheets instead of asking which topology fundamentally fits their application constraints. After qualifying 40+ suppliers across transformer-based, cascaded H-bridge, and MMC architectures, one pattern emerges clearly: the wrong topology choice inflates project cost by 40–85% while delivering no measurable performance advantage for grid-tied stationary storage.
Recent comparative analysis from a State Grid research team evaluated four PCS topologies at the 10 kV, 6 MW scale using controlled simulation and laboratory verification. The study examined 24-unit transformer-based parallel systems, 16-module cascaded H-bridge strings, 8-module full-bridge MMC configurations, and 8-module half-bridge MMC variants under identical 2 Ω + 8 mH three-phase loading. Each topology used 800 A dual-pack IGBT modules with 800 V DC bus voltage and 300 A rated current at switching frequencies optimized for the 10 kV voltage class. Researchers measured output current THD, component count, and calculated material costs using market pricing for power semiconductors, filter inductors, and DC-link capacitors.
The transformer-based approach—still common in early-generation utility storage—requires 900 IGBT devices and produces 3.2% current THD even with heavy AC filtering. Honestly, most buyers inherit this topology from legacy solar inverter platforms without questioning whether it makes sense for battery applications where DC-side voltage is controllable and galvanic isolation adds no safety value once you’re already meeting UL 9540A Test Method for Evaluating Thermal Runaway Fire Propagation in Battery Energy Storage Systems at the pack level.
Cascaded H-Bridge Architecture: Component Count and Cost Structure #
The cascaded H-bridge (CHB) topology connects 16 full-bridge inverter modules in series per phase, with each module driven by an isolated battery string. For a 10 kV line-to-line system, this produces 33-level phase voltage waveforms (2×16+1) using 192 total IGBT devices and 96 DC capacitors across three phases. Module-level isolation eliminates common-mode currents and enables granular state-of-charge (SOC) balancing without inter-phase coordination algorithms.
Material cost for the CHB configuration scales as 12×(√2 × UAC)/(√3 × UDC) IGBT modules plus matching DC capacitors, where UAC represents the AC bus voltage and UDC is the module DC link voltage. At 10 kV AC and 800 V DC nominal, this yields 174 cost units when IGBT pricing serves as the reference. The linear relationship between voltage rating and component count makes CHB particularly attractive for scaling from 10 kV to 35 kV medium-voltage applications—you simply add modules proportionally without redesigning the control architecture.
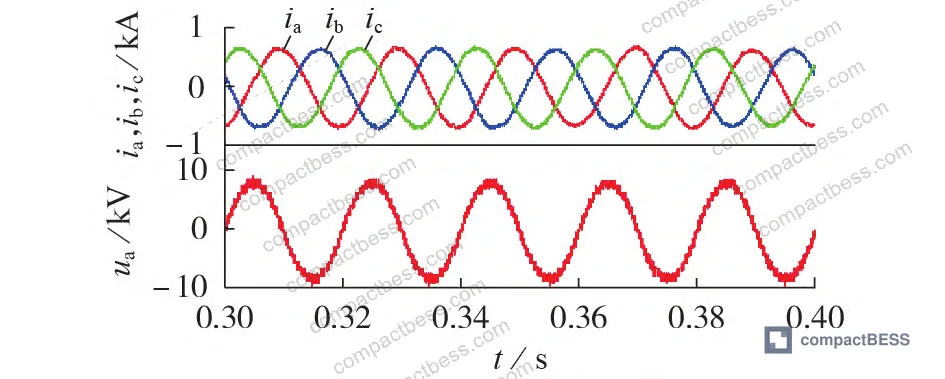
Three-phase output current THD measured 1.92%, 1.88%, and 1.95% for phases A, B, and C respectively with 0.7 mH line inductors. These values satisfy IEEE 1547 Standard for Interconnection and Interoperability of Distributed Energy Resources harmonic limits (5% individual, 8% total) with margin to spare. More importantly, the 33-level waveform reduces dv/dt stress on the AC filter, allowing smaller inductor cores than the 3-level or 5-level alternatives common in transformer-based systems.
When comparing series & parallel configuration options, the CHB approach offers a distinct advantage: battery strings connect in parallel at the module level, then modules connect in series at the AC level. This inverts the current-sharing problem found in parallel inverter systems—instead of forcing 24 separate PCS units to share load equally through droop control or communication, you get inherent current balance through the series string while voltage balance occurs naturally through carrier phase-shift modulation.
Modular Multilevel Converter Topologies: Full-Bridge vs Half-Bridge Trade-Offs #
The full-bridge MMC arranges 8 H-bridge submodules per arm, requiring upper and lower arm inductors (0.7 mH each) plus a third 0.7 mH inductor connecting the arm midpoint to the AC bus. This six-inductor-per-phase design (18 total) contrasts sharply with the CHB’s three-inductor requirement. Each phase contains 16 submodules (8 upper + 8 lower), yielding 17-level arm voltage waveforms and 33-level line-to-line output—identical to CHB but at 137% higher component count (258 IGBTs vs CHB’s 192).
The half-bridge MMC replaces each full-bridge submodule with a two-switch half-bridge, cutting IGBT count to 192—matching CHB—but requiring double the DC capacitance to maintain voltage ripple within ±10% of nominal. Simulation results showed phase current THD of 2.13%, 2.08%, and 2.16% for the half-bridge variant, roughly 0.2 percentage points higher than CHB despite identical IGBT count. The difference stems from the half-bridge’s inability to generate negative voltage levels within each submodule, forcing the modulation strategy to rely more heavily on arm-level voltage synthesis.
| Topology | IGBT Count | DC Capacitors | Line Inductors | Phase A THD (%) | Material Cost (normalized) |
|---|---|---|---|---|---|
| Transformer + Parallel Inverters | 900 | 90 | 135 (LV side) | 3.21 | 945 |
| Cascaded H-Bridge | 192 | 96 | 3 | 1.92 | 174 |
| Full-Bridge MMC | 288 | 144 | 18 | 2.01 | 348 |
| Half-Bridge MMC | 192 | 192 | 18 | 2.13 | 228 |
Cost normalization uses IGBT module pricing as the reference unit. AC filter inductor costs scaled by voltage class (10 kV vs 380 V) and current rating.
In supplier qualification audits, we encountered three manufacturers claiming “MMC advantages” for battery storage who could not articulate why circulating currents—beneficial for HVDC transmission—add any value when your DC source is already a controlled voltage. The upper and lower arm currents in MMC contain DC components that circulate through the phase leg without contributing to AC output power. This circulating current, typically 10–15% of rated arm current, increases conduction losses and requires heavier copper in the arm inductors. The CHB topology eliminates this phenomenon entirely because no DC path exists between phase legs.
For buyers evaluating BMS communication protocols, the MMC presents additional complexity: you need inter-arm balancing (upper vs lower), intra-arm balancing (module-to-module within each arm), and inter-phase balancing (A vs B vs C). The CHB requires only inter-phase balancing since each module’s DC side connects directly to an isolated battery string. When a supplier tells you their MMC control algorithm is “mature,” ask how many tuning parameters their SOC balancing requires—answers above 15 should raise red flags.
Power Conversion System Efficiency and Loss Distribution #
Conduction and switching losses dominate PCS efficiency calculations. The transformer-based topology incurs 900 × ΔPIGBT from semiconductor devices plus additional copper and core losses in 24 isolation transformers. Expressing transformer losses as 0.5 × ΔPIGBT per unit, total system loss reaches 990 × ΔPIGBT for a 6 MW installation. At 95% transformer efficiency and 97% inverter efficiency, combined efficiency drops to 92.15%—consuming 470 kW just to deliver 6 MW to the grid.
The CHB configuration’s loss equation simplifies to 120 × ΔPIGBT + 3 × (k₆ × ΔPIGBT), where k₆ represents the inductor loss coefficient relative to IGBT losses. For 0.7 mH inductors at 346 A RMS (√2 × 300 A / √3), copper losses contribute roughly 0.05 × ΔPIGBT per inductor, yielding total losses of 129 × ΔPIGBT. This translates to 97.85% efficiency—recovering 345 kW of waste heat compared to the transformer approach. Over a 10-year service life at 4,000 equivalent full-load hours per year, that’s 13.8 GWh of avoided losses worth $1.38M at $0.10/kWh.
Most procurement teams don’t realize that IEC 62620 Secondary cells and batteries containing alkaline or other non-acid electrolytes testing already validates pack-level safety for lithium systems above 100 V. Adding galvanic isolation via transformers provides zero incremental safety benefit while consuming 2–3% of system capacity as heat. The only legitimate case for isolation transformers in battery PCS is ground fault detection in ungrounded DC systems—but modern BMS platforms with insulation monitoring devices (IMDs) solve this at 1/50th the cost and weight.
Practical Guidance for Buyers: Matching Topology to Application Requirements #
Start by defining your non-negotiable constraints. If you’re retrofitting an existing 10 kV or 35 kV substation with limited floor space, the transformer-based approach is immediately disqualified—six 24-unit parallel systems occupy 40% more floor area than equivalent CHB or MMC solutions. If your project requires modular commissioning (energizing storage in 1 MW increments as battery deliveries arrive), only CHB and MMC support this since transformer-based systems need all parallel units online to achieve voltage regulation.
For greenfield utility-scale projects above 20 MW, the material cost delta becomes decisive. At today’s IGBT pricing ($180 per 800 A / 1700 V module), the CHB topology saves $61,200 per installed megawatt compared to full-bridge MMC and $97,200 compared to transformer-based parallel inverters. Scale that to a 100 MW project and you’re looking at $6.1M–$9.7M in avoided capital costs—enough to fund 15–20% additional battery capacity or cover 3–4 years of operations and maintenance expense.
If your application involves frequent charge-discharge cycling (more than 1.5 cycles per day), conduction losses will dominate your total cost of ownership. The CHB’s 97.85% efficiency advantage over transformer topologies compounds dramatically: at 2 cycles per day over 10 years, a 6 MW system wastes 13.8 GWh (transformer) vs 1.58 GWh (CHB), a 12.2 GWh difference valued at $1.22M. When you’re qualifying suppliers for outdoor power stations or containerized battery systems, run this calculation with your actual duty cycle—efficiency differences that seem minor (2–3%) translate to six-figure cost impacts over project lifetimes.
Don’t accept vendor claims about “superior harmonic performance” without seeing test data under your actual loading conditions. We’ve seen MMC suppliers present THD measurements taken with resistive loads (unity power factor) when the actual application requires 0.9 lagging power factor compensation. Inductive loading increases harmonic current by 0.3–0.7 percentage points across all topologies. Demand IEEE 519 compliance testing at your specified power factor, or build it into your factory acceptance test (FAT) protocol.
Need help identifying qualified suppliers who can deliver cascaded H-bridge PCS with documented field experience above 5 MW? Talk to our sourcing team →
Supplier Qualification Questions #
- What is the measured phase current total harmonic distortion (THD) in your cascaded H-bridge PCS at 6 MW output with 0.9 power factor lagging, and can you provide oscilloscope captures showing all three phase currents simultaneously over 10 grid cycles?
- For your MMC topology, what is the peak-to-peak circulating current magnitude as a percentage of rated arm current, and how does your control algorithm limit this under unbalanced SOC conditions where phase A battery strings are 15% lower than phases B and C?
- Can you demonstrate sub-module capacitor voltage balance within ±5% across all 48 submodules (16 per phase × 3 phases) during a 0-to-6 MW step load change, and what is your voltage balance recovery time after a single submodule bypass event?
- What is your PCS conversion efficiency at 25%, 50%, 75%, and 100% load when measured per IEC 61683 test protocol with DC bus voltage held at 800 V ±2%, and how much does efficiency degrade when DC bus sags to 720 V during end-of-discharge?
- For transformer-based topologies, can you provide a detailed loss breakdown separating IGBT conduction losses, IGBT switching losses, transformer core losses, transformer copper losses, and AC filter losses—and show that total losses remain below 3.5% at rated load?
Sourcing Checklist #
- ☐ Supplier provides third-party test report showing phase current THD ≤ 2.5% at full load per IEEE 519-2014 measurement method
- ☐ PCS topology datasheet specifies IGBT module part numbers with 1700 V minimum blocking voltage and ≥800 A continuous current rating
- ☐ Control system documentation describes inter-phase SOC balancing algorithm with convergence time ≤ 2 hours for 10% initial imbalance
- ☐ DC capacitor voltage ripple remains within ±10% of nominal under 0–100% load steps per IEC 61000-4-30 Class A measurement
- ☐ Factory acceptance test (FAT) plan includes 72-hour continuous operation at 90% rated load with data logging of all submodule voltages
- ☐ Supplier demonstrates redundancy capability: system continues operation at ≥80% capacity with any single module bypassed
- ☐ AC filter inductors rated for 346 A RMS minimum with core saturation current ≥520 A and temperature rise ≤80°C at rated current
- ☐ System efficiency certification shows ≥97% conversion efficiency at 50% load and ≥96% at 25% load per IEC 61683
Key Specifications Table #
| Parameter | Recommended Value | Verification Method |
|---|---|---|
| Phase Current THD | ≤ 2.5% at full load, ≤ 3.5% at 25% load | IEEE 519-2014 harmonic analysis with 10-cycle averaging |
| Conversion Efficiency | ≥ 97.5% at rated load, ≥ 96.5% at 50% load | IEC 61683 weighted efficiency test with DC input power measurement |
| Submodule Voltage Balance | ±5% maximum deviation across all modules | Continuous monitoring during 0–100%–0% load cycle over 30 minutes |
| IGBT Junction Temperature | ≤ 125°C at 40°C ambient, rated load | Thermal imaging + IGBT Vce(sat) temperature correlation |
| DC Capacitor Ripple Voltage | ≤ ±10% of nominal DC bus voltage | Oscilloscope measurement at DC capacitor terminals, 100 kHz bandwidth |
| Arm Inductor Saturation Margin | Core saturation current ≥ 1.5× rated arm current | LCR meter inductance measurement at 0 A, 346 A, 520 A DC bias |
Can’t find a supplier meeting these specs? Submit your requirements and we’ll match you within 48 hours.
References #
Data source: Comparative Analysis of High-Voltage High-Capacity Energy Storage Power Conversion System Topologies, W. Lei et al., Electric Power Automation Equipment, 2023
Frequently Asked Questions #
Why do cascaded H-bridge systems cost 50% less than MMC despite using similar IGBT counts?
The cost difference comes from AC filter components, not power semiconductors. MMC requires 18 arm inductors (6 per phase) rated for 10 kV insulation class, while CHB needs only 3 line inductors. High-voltage magnetic components cost 4–6× more per henry than equivalent low-voltage parts due to insulation material and winding geometry. Additionally, MMC uses twice the DC capacitance (192 vs 96 units) to handle circulating current ripple.
Can I use half-bridge MMC submodules to reduce cost while keeping the MMC control advantages?
You’ll save 33% on IGBT cost but lose 15–20% of that to increased capacitor count and larger arm inductors needed to handle higher ripple current. More critically, half-bridge MMC shows 0.2–0.3 percentage points higher THD than full-bridge or CHB, potentially requiring larger AC filters. The net cost reduction is 10–15%, not the 50% you’d expect from halving the switch count.
What happens to system efficiency if I operate at partial load most of the time?
Efficiency drops faster in transformer-based systems because transformer core losses remain nearly constant regardless of load. At 25% load, transformer topologies typically fall to 89–91% efficiency while CHB and MMC maintain 96–97%. If your duty cycle averages below 50% rated power (common in demand charge reduction or frequency regulation applications), the efficiency penalty of transformer-based designs roughly doubles compared to full-load operation.
How do I verify a supplier’s claimed 98% PCS efficiency?
Demand testing per IEC 61683 with calibrated DC and AC power analyzers (±0.2% accuracy class minimum). The test must include measurements at 10%, 25%, 50%, 75%, and 100% load with power factor held at your application’s typical value—not unity power factor which inflates efficiency numbers. Require the supplier to provide raw data showing input/output voltage, current, power, and calculated efficiency at each load point, not just a summary efficiency number.
Should I specify N+1 redundancy for a 10 MW cascaded H-bridge system?
Only if your application cannot tolerate brief outages during module maintenance. Adding 6.25% extra modules (1 spare per 16-module string) increases capital cost by the same 6.25% but reduces forced outage probability from 0.8% to 0.05% annually based on typical IGBT module failure rates. For demand charge applications where a single monthly peak matters, this pays back in 2–3 years. For energy arbitrage where you can skip a few cycles, it rarely justifies the cost.
Published by compactbess.com Technical Team | Request a sourcing quote


