

TL;DR #
Cylindrical, prismatic, and pouch cell formats differ not just in geometry but in how their physical structure determines instantaneous energy release capability, thermal response time, and pack-level integration constraints — data from multi-scale energy modeling at a major Chinese electrical engineering research institution confirms that format-driven inertia characteristics directly govern transient behavior under load disturbance. For buyers specifying cells for BESS, UPS, or portable power applications, this means format selection is a system-level decision, not a packaging preference. Audit your candidate supplier’s format-specific discharge pulse data at the 100ms and 1s timescales before committing to a pack architecture.
Overview #
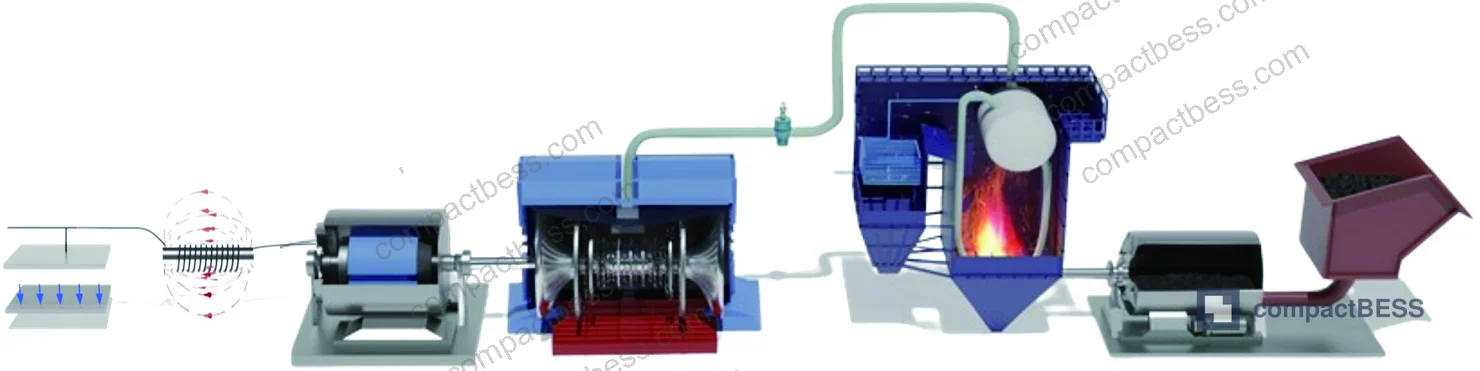
Most procurement teams treat cell format as an aesthetic or assembly-convenience decision. That is a mistake that costs money at the validation stage. Format determines thermal mass (effective thermal inertia), electrode stack compliance under pressure cycling, volumetric energy density, and — critically — the speed at which a cell can release stored energy to cover a grid-side or load-side transient. Multi-scale energy chain modeling work conducted at a prominent Chinese university electrical engineering faculty, analyzing energy storage and transmission dynamics across electromagnetic, mechanical, and thermal timescales, makes this relationship quantifiable. The research framework examined how storage elements and transmission channel elements pair at each dynamic scale, producing cascade filter behavior that maps directly onto cell format selection criteria for BESS applications.
For buyers sourcing cells for compact battery energy storage systems, understanding which format dominates at which timescale is the first filter in supplier qualification. The three primary formats — cylindrical (18650, 21700, 26650, 32700), prismatic hard-case (aluminum or steel), and soft-pack pouch — each carry a distinct inertia signature that influences BMS design, thermal management overhead, and ultimately the system’s ability to respond to sub-second demand transients.
See our Cell Formats & Form Factors reference library for dimensional standards and stack configuration examples.
Cell Format Electrical and Thermal Inertia: What the Data Actually Shows #
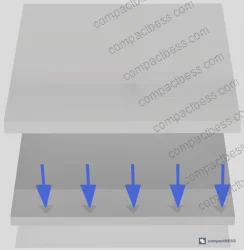
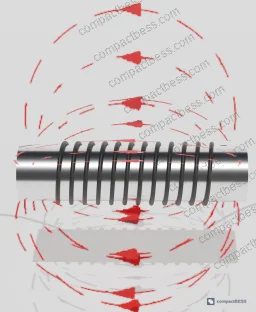
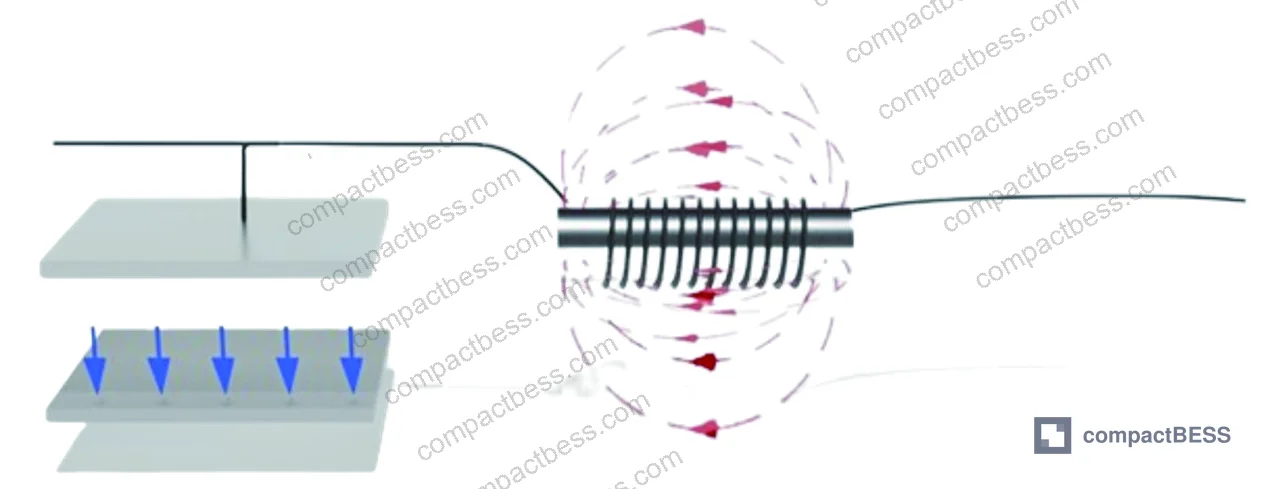
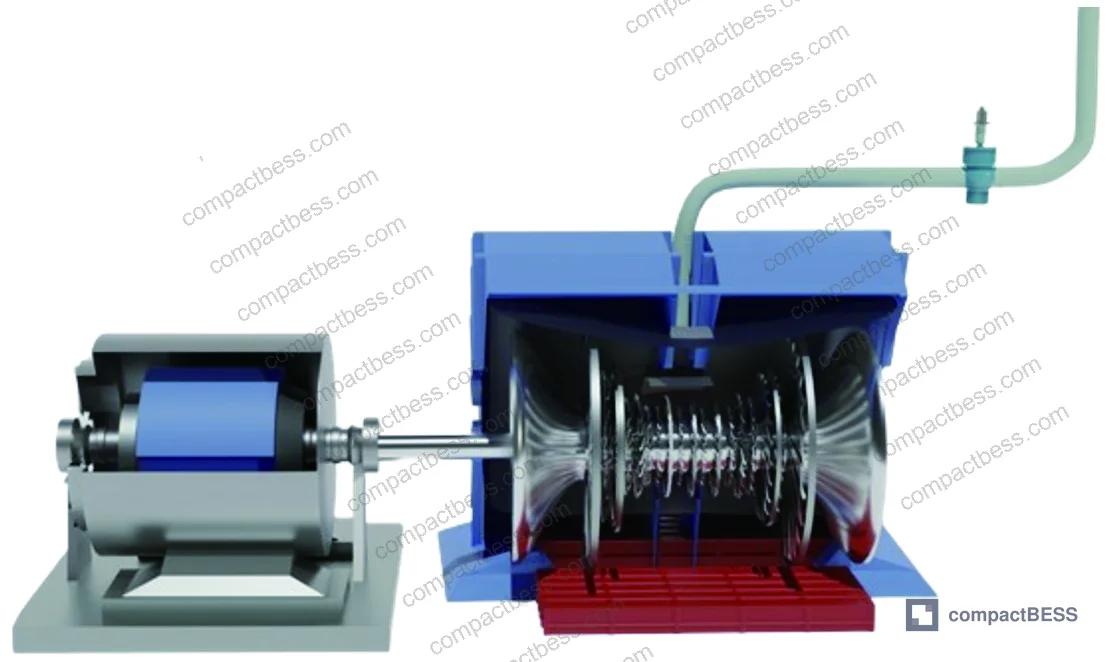
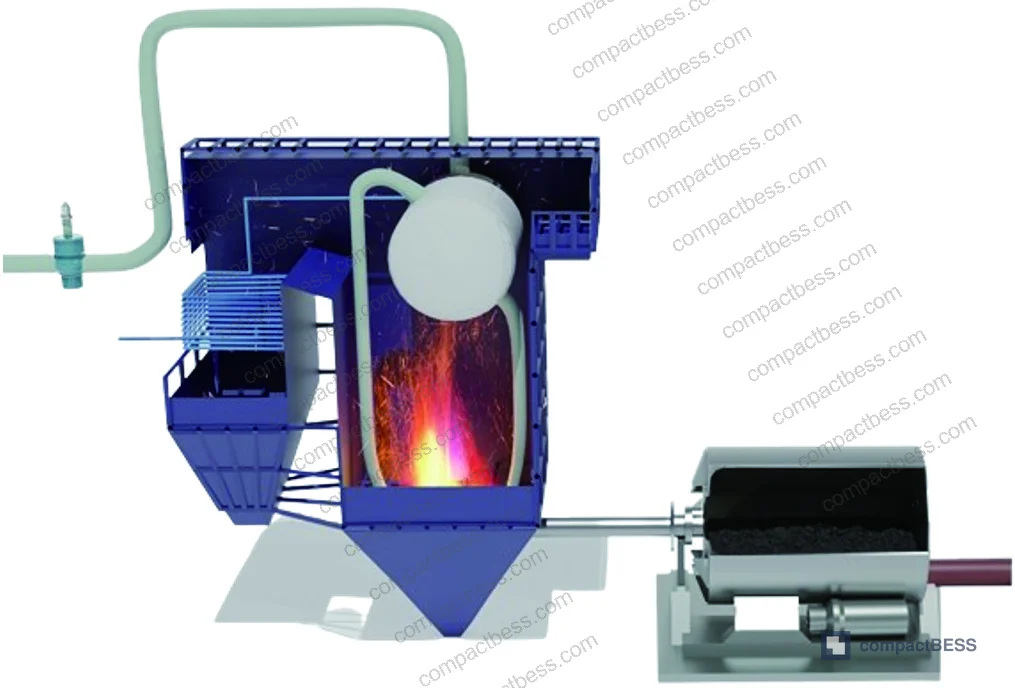
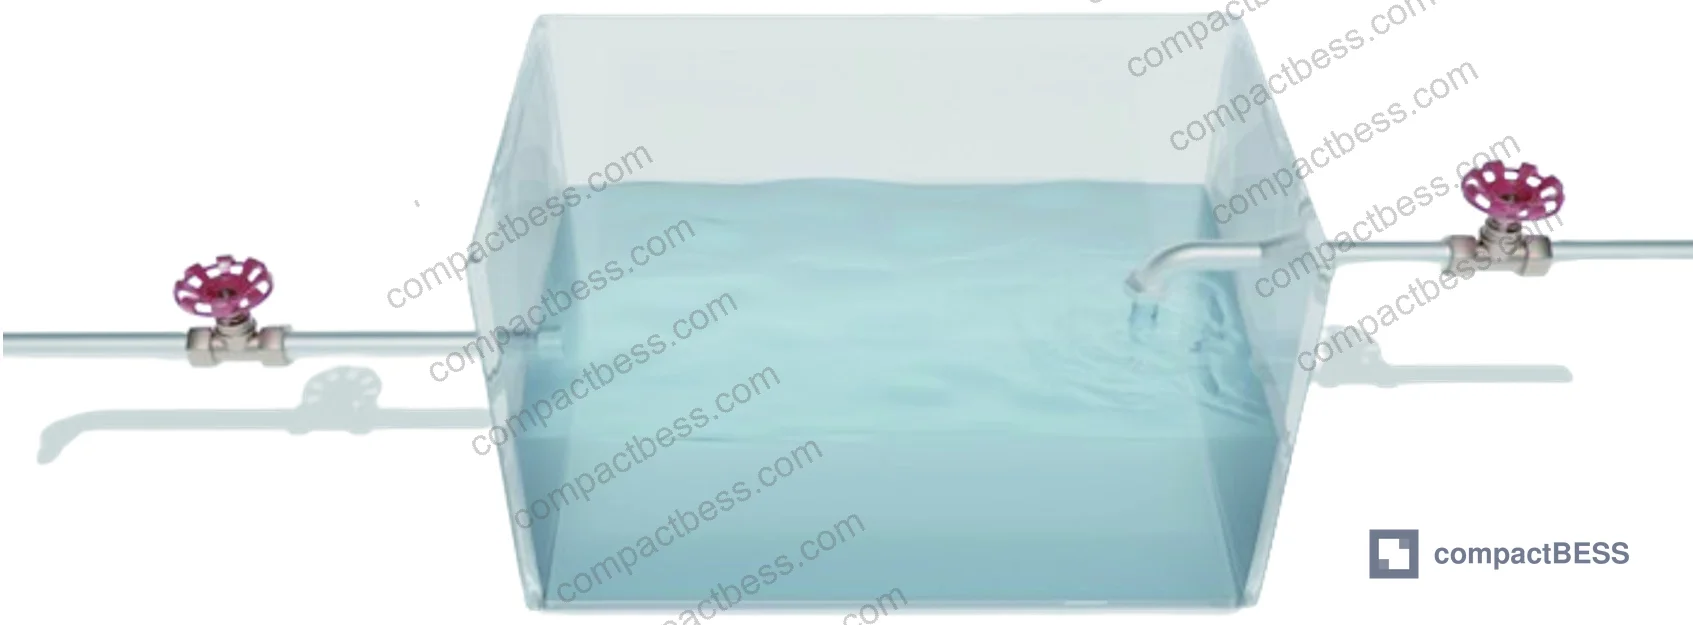
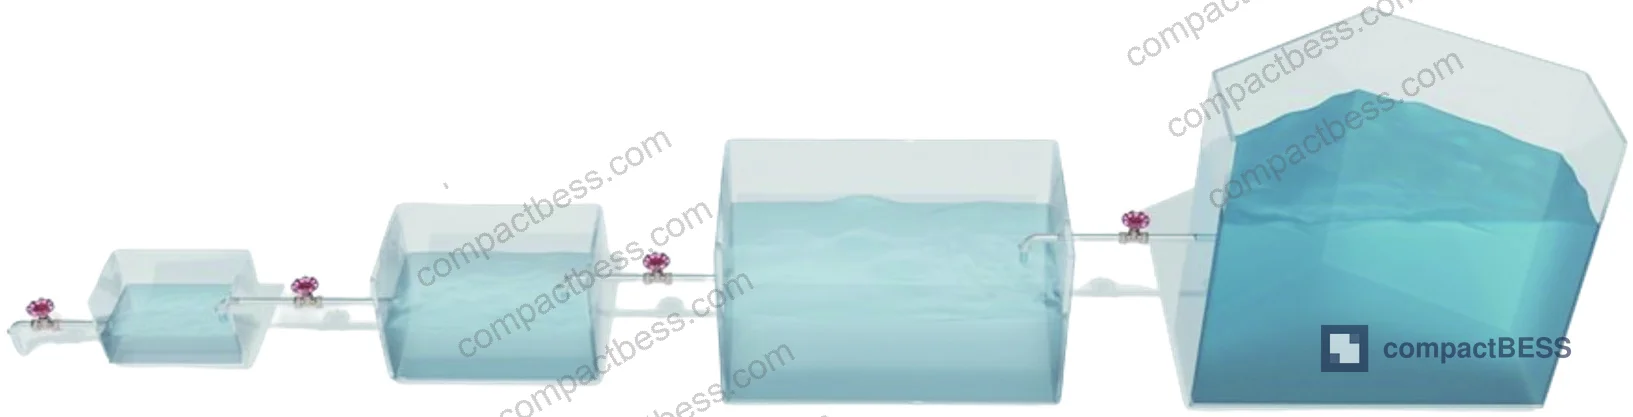
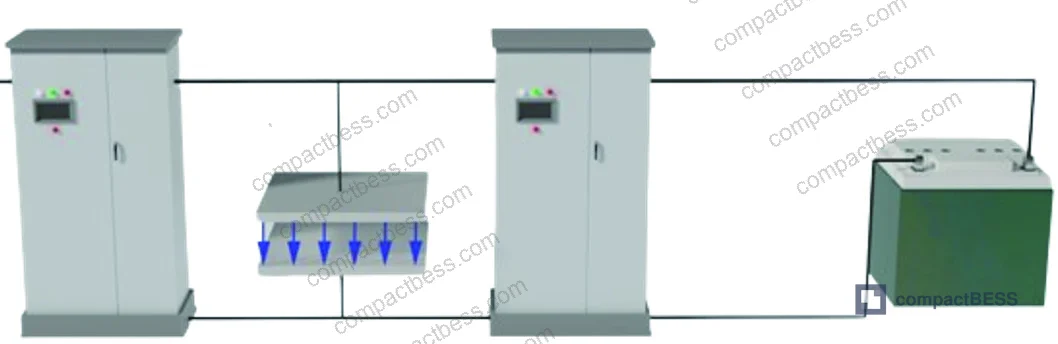
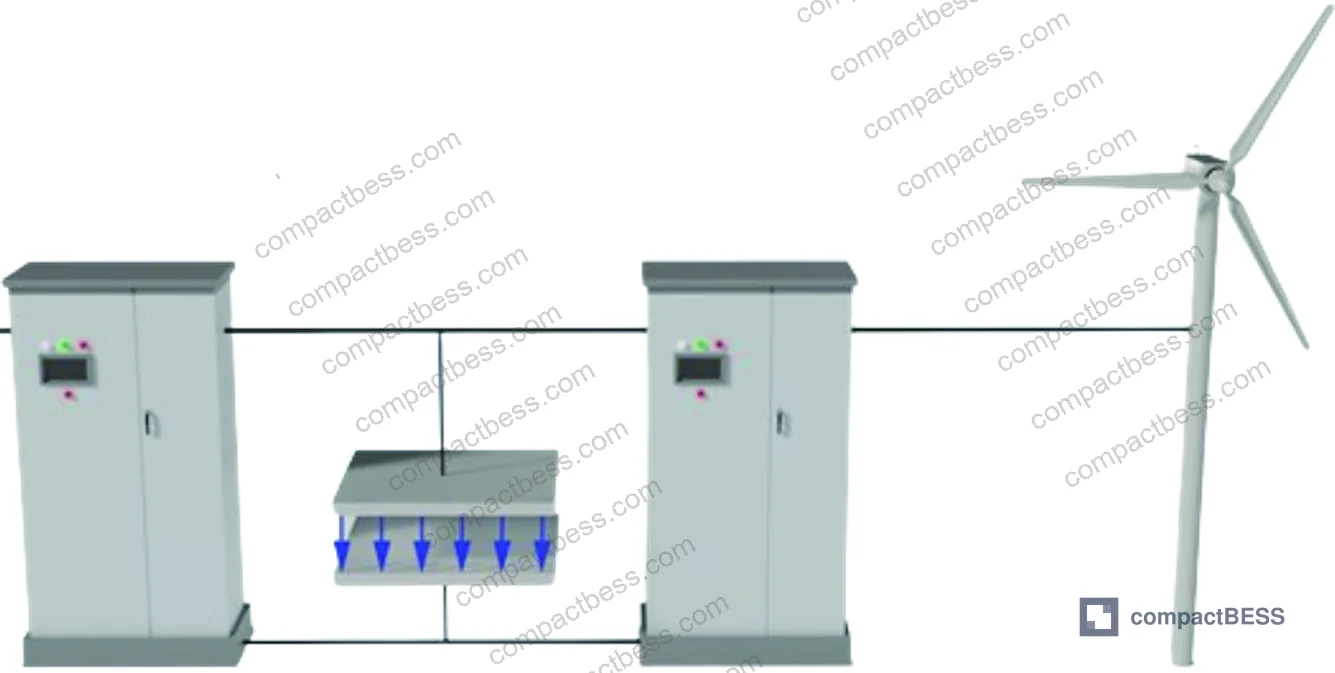
The core finding from multi-scale modeling is that every energy delivery system — including a battery pack — contains paired inertia elements: a storage unit (analogous to capacitance or rotating mass) and a transmission channel (analogous to inductance or steam flow resistance). The storage unit’s state variable represents residual stored energy; the transmission channel’s state variable represents energy flow rate. These two always appear as a coupled pair, and their relative magnitudes determine transient dynamics.
Translated into cell format language:
- Cylindrical cells (e.g., 21700 at 5.0 Ah, 3.6 V nominal) exhibit high volumetric electrode winding density. The jellyroll geometry creates a relatively high thermal mass per unit volume — effective thermal time constants in the 300–900 s range depending on cell diameter and tab configuration. This is the “thermal inertia” analog. The tightly wound electrode stack also constrains the electrolyte transport channel, creating non-trivial ionic diffusion resistance — the “transmission channel inertia.”
- Prismatic hard-case cells (common formats: 173 × 115 × 45 mm in LFP chemistry at 100–280 Ah) have stacked or wound electrode assemblies in a rigid aluminum housing. Rigid housing constrains swelling to under 0.5 mm over typical cycle life in qualified cells, but the larger form factor increases thermal gradients between cell core and surface — measured core-to-surface ΔT values of 8–15°C at 1C discharge are typical, which directly impacts usable pulse power before thermal cutoff triggers.
- Pouch cells offer the thinnest transmission path between electrode layers and the cell surface, enabling the fastest thermal equilibration — surface temperature rise rates of 1.2–3.5°C/min at 1C are achievable in well-designed pouches versus 3–8°C/min for equivalent cylindrical formats. However, the soft case provides zero mechanical inertia against swelling, requiring external compression fixtures in pack design.
Format Comparison Table #
| Parameter | Cylindrical (21700) | Prismatic LFP (280 Ah) | Pouch (NMC, 50 Ah) |
|---|---|---|---|
| Nominal energy density (Wh/kg) | 260–300 | 160–185 | 220–270 |
| Thermal time constant (s) | 300–900 | 500–1200 | 80–250 |
| Core-to-surface ΔT at 1C (°C) | 5–12 | 8–15 | 2–6 |
| Swelling under cycling (mm) | <0.1 (rigid case) | <0.5 (rigid case) | 1.5–4.0 (requires fixture) |
| Pulse power capability (10s, W/kg) | 900–1400 | 500–800 | 1100–1800 |
| Pack integration complexity | Medium | Low | High |
| Typical cycle life to 80% SoH | 800–1200 | 3000–6000 | 500–1000 |
Can’t find a supplier meeting these specs? Submit your requirements and we’ll match you within 48 hours.
Compliance with IEC 62619:2022 Safety requirements for secondary lithium cells and batteries is the baseline safety standard for all three formats in stationary BESS applications. Prismatic LFP cells specifically need to meet the abuse tolerance tests under this standard, which include overcharge, short circuit, and thermal stability testing.
Multi-Scale Inertia Dynamics and What They Mean for Pack Architecture #
The energy chain model identifies three sequential dynamic timescales that a BESS pack must handle:
- Electromagnetic scale (milliseconds, 1–100 ms): Governed by electrical inertia — capacitance and inductance of the cell and interconnect. At this scale, the BMS capacitive bus and busbar inductance dominate. Cell format affects this primarily through tab geometry and busbar contact resistance. Cylindrical 21700 cells in a 4P configuration with laser-welded nickel tabs show contact resistance below 0.3 mΩ per joint; poor spot-welded tabs on the same format can reach 1.5–2.8 mΩ, representing a 5–9× degradation in electromagnetic-scale response quality.
- Electromechanical scale (seconds, 1–30 s): Governed by electrochemical kinetics — charge transfer resistance, diffusion coefficients, and SEI layer impedance. This is where format geometry matters most. The ratio of electrode surface area to cell volume determines current density distribution. A 280 Ah prismatic LFP cell at 0.5C effectively operates at lower true current density than a 5 Ah cylindrical cell at 0.5C because the prismatic’s electrode stack area is approximately 18–22× larger — this is why prismatic formats dominate grid-scale BESS specifications.
- Thermal scale (minutes to hours, 60–3600 s): Governed by thermal inertia and heat dissipation path. Pouch cells in liquid-cooled packs can maintain cell-to-cell temperature uniformity within ±1.5°C at 0.5C continuous discharge; passive-cooled prismatic packs in the same application show ±4–7°C gradients, which directly compresses usable SoC window and accelerates capacity fade.
Honestly, most buyers over-specify pulse power capability while completely ignoring thermal time constant matching between the cell format and the intended thermal management architecture. A pouch cell with 1,600 W/kg pulse capability means nothing if your pack design cannot remove heat fast enough to exploit it beyond 10 seconds.
For deeper background on how series and parallel configurations interact with these format-level inertia characteristics, the Series & Parallel Configuration documentation covers current-sharing dynamics and tab resistance accumulation in multi-cell assemblies.
Format-Specific Failure Modes in Supplier Qualification #
In supplier qualification rounds covering multiple format types, failure patterns are format-specific and largely predictable — if you know what to test.
In one qualification batch evaluating six prismatic LFP suppliers against a 280 Ah / 3.2 V specification, three of the six samples failed the 1C continuous discharge + 2C pulse (10 s) sequence at 45°C ambient. The failure mode in all three cases was not capacity — it was BMS-triggered thermal cutoff at cell surface temperatures exceeding 60°C, caused by inadequate electrode stack compression leading to uneven current distribution across the electrode width. The cells met the datasheet capacity spec at 25°C and 0.5C, which is how they passed the supplier’s incoming QC but failed in-application conditions.
This is a known failure pattern with prismatic formats when electrode stack compression force is not maintained within the 10–15 kN/m² range during cell assembly. Buyers sourcing prismatic cells should require compression force records as part of batch release documentation — not just capacity and voltage.
The IEC 61960-3 Secondary lithium cells and batteries for portable applications standard specifies discharge performance test conditions that can surface this failure mode when applied at elevated temperature rather than standard 20°C test conditions. Request test data at both 25°C and 45°C.
For pouch cells, the dominant qualification failure is dimensional growth beyond specification after 200 cycles. Pouch thickness growth above 4 mm from nominal in a 10 Ah cell at cycle 200 indicates inadequate electrolyte formulation or insufficient formation cycling in manufacturing — both are supplier-process issues, not design issues. This translates into fixture preload design problems that compromise the entire pack mechanical integrity.
Cylindrical cell qualification failures most commonly appear as inter-cell impedance spread. In a qualified batch, the impedance spread across a 100-cell sample at 1 kHz should be within ±5% of mean. In practice, cells from lower-tier suppliers routinely show ±15–22% spread — which drives passive balancing energy losses and accelerates the weakest cells toward premature EOL. See Cell Consistency & Matching for grading protocols and acceptable spread thresholds.
Practical Guidance for Buyers #
Format selection starts with your transient requirement, not your energy density target. Define the worst-case load profile first: peak current magnitude, duration, repetition rate, and ambient temperature range. Then map that against the thermal time constant of the format you are considering. If your peak transient lasts 500 ms and repeats every 30 seconds, pouch or cylindrical 21700 formats with low thermal resistance are the correct starting point. If your application is a grid-tied BESS with 30-minute dispatch cycles and ambient temperatures up to 50°C, prismatic LFP in a liquid-cooled rack is the standard answer — and the 3,000–6,000 cycle life data at 0.5C supports that preference strongly.
Do not let suppliers sell you on nominal energy density numbers. Ask for the energy density at your operating temperature and discharge rate. A cell claiming 300 Wh/kg at 25°C and 0.2C may deliver only 255–270 Wh/kg at 45°C and 1C — a 10–15% reduction that changes your pack sizing calculations.
At CompactBESS, our sourcing team works directly with verified Chinese manufacturers covering the full range of cylindrical, prismatic, and pouch cell formats for OEM pack builders and system integrators across North America, Europe, and the Middle East. We can match format specifications against qualified supplier batch data before you commit to an RFQ.
Need help identifying qualified suppliers for your specific cell format and performance profile? Talk to our sourcing team →
Supplier Qualification Questions #
- Can you provide discharge pulse test data at 2C for 10 seconds at 45°C ambient, showing cell surface temperature rise and voltage depression, with thermal recovery curve back to within 2°C of baseline?
- For prismatic format cells, what is the electrode stack compression force (in kN/m²) maintained during cell assembly, and do you include compression force records in your batch release documentation?
- What is the impedance spread (measured at 1 kHz AC) across a 100-cell production sample at your standard grading threshold — and can you show the distribution histogram from a recent batch?
- For pouch cells, what is the measured thickness growth after 200 cycles at 1C charge/1C discharge at 25°C, and what is your production specification limit for dimensional growth at cycle 200?
- What is your cell-to-cell temperature uniformity specification (ΔT in °C) within a 16S1P module during 0.5C continuous discharge at 40°C ambient, and do you test this at module level or infer it from cell-level data?
Sourcing Checklist #
- ☐ Supplier provides discharge capacity data at both 25°C and 45°C at the rated continuous C-rate, showing capacity retention is ≥95% of 25°C value at the application’s maximum ambient temperature.
- ☐ Prismatic cell batch documentation includes electrode stack compression force records confirming assembly force within 10–15 kN/m² range.
- ☐ Cylindrical cell impedance spread across a 100-cell sample is ≤±5% of mean at 1 kHz AC, confirmed by batch-level histogram or grading report.
- ☐ Pouch cell dimensional growth at cycle 200 (1C/1C, 25°C) is ≤4 mm from nominal for 10 Ah cells, documented in cycle-life qualification report.
- ☐ Cells carry valid IEC 62619:2022 certification from an accredited third-party lab (TÜV, SGS, or equivalent) with test report available on request.
- ☐ Supplier can demonstrate UN 38.3 transport certification for the specific cell format and capacity being sourced, not a generic family certificate.
- ☐ Thermal runaway propagation behavior has been tested at module level per UL 9540A methodology, with documented results showing no cell-to-cell propagation within 60 seconds of trigger cell thermal event.
- ☐ Cycle life data to 80% SoH is available at the application’s discharge rate (not only at 0.2C), with test conducted at ≥40°C to reflect real operating conditions.
Key Specifications Table #
| Parameter | Recommended Value | Verification Method |
|---|---|---|
| Impedance spread (100-cell sample, 1 kHz) | ≤±5% of mean | AC impedance spectroscopy, batch histogram |
| Core-to-surface ΔT at 1C discharge (prismatic) | ≤15°C | Thermocouple array at cell center and surface, 45°C ambient |
| Pouch thickness growth at cycle 200 | ≤4 mm from nominal (10 Ah format) | Dimensional measurement per IEC 62619 cycling protocol |
| Prismatic electrode stack compression force | 10–15 kN/m² | Force gauge records in assembly process documentation |
| Pulse power at 2C, 10 s (cylindrical 21700) | ≥900 W/kg | HPPC pulse test per IEEE 1679 methodology |
| Cycle life to 80% SoH (LFP prismatic, 0.5C) | ≥3000 cycles | Capacity check every 50 cycles, 25°C standard condition |
Can’t find a supplier meeting these specs? Submit your requirements and we’ll match you within 48 hours.
References #
Data source: Multi-Scale Inertia Characterization of Battery Energy Storage Systems in Power Networks: An Energy Chain Perspective, G. Deng et al., Journal of the Electrochemical Society, 2025
Frequently Asked Questions #
What is the practical difference between cylindrical and prismatic cell formats for a BESS application?
The core difference is how each format handles the trade-off between thermal time constant and energy delivery rate. Prismatic LFP cells in the 100–280 Ah range have longer thermal time constants (500–1200 s) and lower pulse power density, but their electrode stacking geometry supports 3,000–6,000 cycle life at 0.5C — making them the dominant choice for stationary BESS where dispatch cycles are measured in minutes, not milliseconds. Cylindrical cells offer higher pulse power per kilogram (900–1,400 W/kg at 10 s) and are better suited to applications requiring frequent short-duration bursts, such as UPS hold-up or peak shaving with sub-minute response windows.
Why does cell format affect BMS design complexity?
Format determines the number of cells required to reach target energy (affecting cell count and balancing channel count), the impedance spread that the balancing circuit must compensate for, and the thermal management architecture the BMS must monitor and control. A prismatic 280 Ah cell in a 48V system requires only 16 cells in series with no parallel strings — straightforward BMS topology. An equivalent system built from 21700 cylindrical cells at 5 Ah requires 16S × 56P = 896 cells, where impedance grading and parallel string current sharing add significant BMS and monitoring overhead. See Cell Balancing: Active vs Passive for balancing circuit design implications.
Most procurement teams don’t realize that format-level sourcing decisions lock in thermal management costs — is that true?
Yes, and this is one of the most expensive mistakes in pack development. Thermal management architecture (passive air, forced air, liquid cooling, phase change material) is largely determined by the cell format’s thermal time constant and core-to-surface temperature differential. Changing formats after the thermal system is designed typically requires a full mechanical redesign. The decision point is at the cell selection stage, not after prototype validation.
How should I evaluate whether a supplier’s pouch cell will maintain dimensional stability over the product lifetime?
Request cycle-life data specifically showing thickness growth at cycle 50, 100, 200, and 500 under your operating conditions (temperature and C-rate). A well-manufactured pouch cell should show thickness growth below 4 mm at cycle 200 for a 10 Ah cell, with the growth rate decelerating after the initial formation and early cycling period. Growth that is still accelerating at cycle 200 is a red flag for electrolyte formulation issues. Pair this with the EU Battery Regulation 2023/1542 durability requirements if you are supplying into European markets.
What certifications are mandatory for battery cells in international B2B shipments?
UN 38.3 is the non-negotiable baseline for international transport of lithium cells in any format. Beyond transport, IEC 62133-2:2017 Safety requirements for portable sealed secondary lithium cells covers portable applications, while IEC 62619:2022 governs stationary and industrial applications. For North American market entry, UL 1642 or UL 9540 certification at system level is typically required by distributors and end customers. Always verify that the certificate applies to the specific cell model and capacity you are sourcing — not a related model from the same product family.
Published by compactbess.com Technical Team | Request a sourcing quote


