

TL;DR #
Across all Stackelberg game model scenarios tested — covering four distinct government policy types and three recovery channel configurations — the battery manufacturer-led collection model consistently produced the highest battery capacity utilization, the highest end-of-life recovery rates, and the strongest total supply chain profit. For overseas buyers sourcing EV battery packs or second-life BESS modules, this finding directly informs supplier qualification: a cell manufacturer with an integrated take-back and cascade reuse program is structurally incentivized to produce higher-capacity, better-designed cells from the start. Prioritize suppliers who can demonstrate a closed-loop recovery mechanism and battery capacity retention rate (h) of ≥0.8 when evaluating second-life or high-cycle-count applications.
Overview #
If you’ve been evaluating lithium battery cell suppliers without accounting for how they handle end-of-life capacity and cascade reuse, you’re missing a variable that directly affects the initial design quality of what they ship you. The research summarized here — conducted using closed-loop supply chain Stackelberg game models across three recovery channel types and five policy scenarios — draws on a dataset anchored to real-world EV market parameters, including a reference battery capacity of 75 kWh (based on a leading Chinese EV platform) and a simulated market demand base covering capacity retention coefficients, recycling cost parameters, and consumer price sensitivity values calibrated to current industry ranges.
The study evaluated three recovery modes: collection by the EV manufacturer (Mode M), collection by the battery cell manufacturer (Mode N), and collection by a third-party recycler (Mode O). Each was tested under five policy conditions: no government intervention (B), fixed subsidy (C), reward-penalty (G), deposit-refund (E), and fund policy (F). The results are unambiguous at the structural level, but the policy interaction effects are where the practical procurement intelligence lives.
For buyers evaluating cells for Cell Formats & Form Factors applications — whether cylindrical, prismatic, or pouch — the cascade reuse lifecycle of a cell is increasingly a procurement-relevant metric, not just a sustainability checkbox.
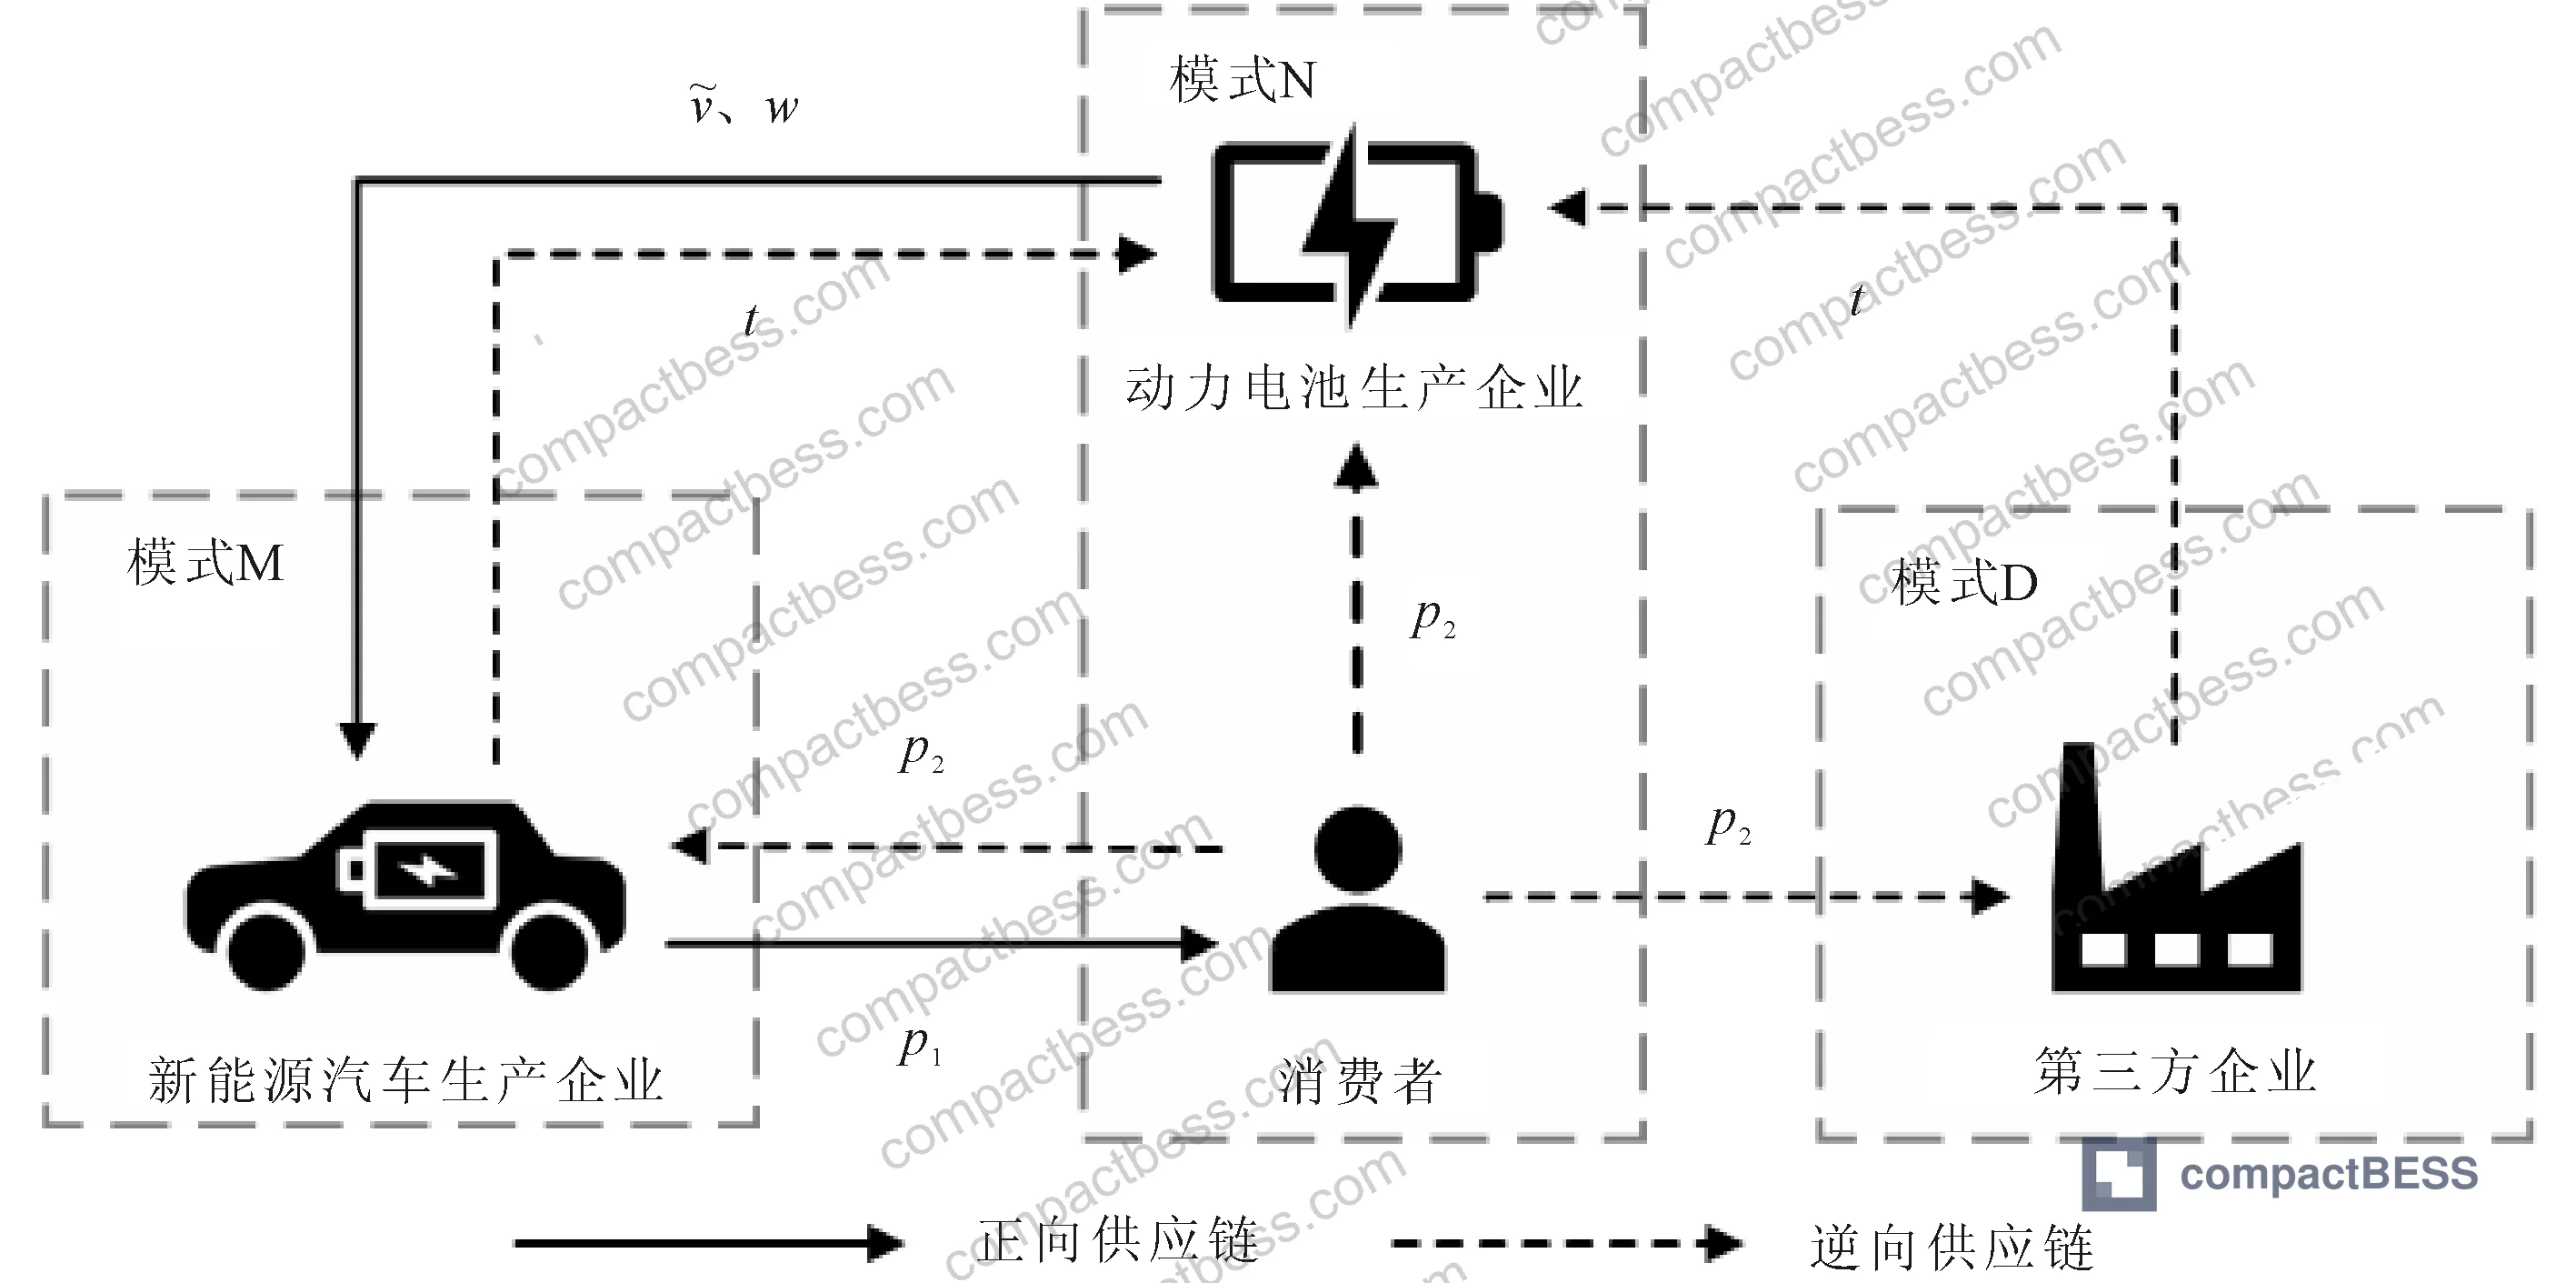
Battery Cell Capacity and Recovery Mode: Why the Manufacturer-Led Model Wins #
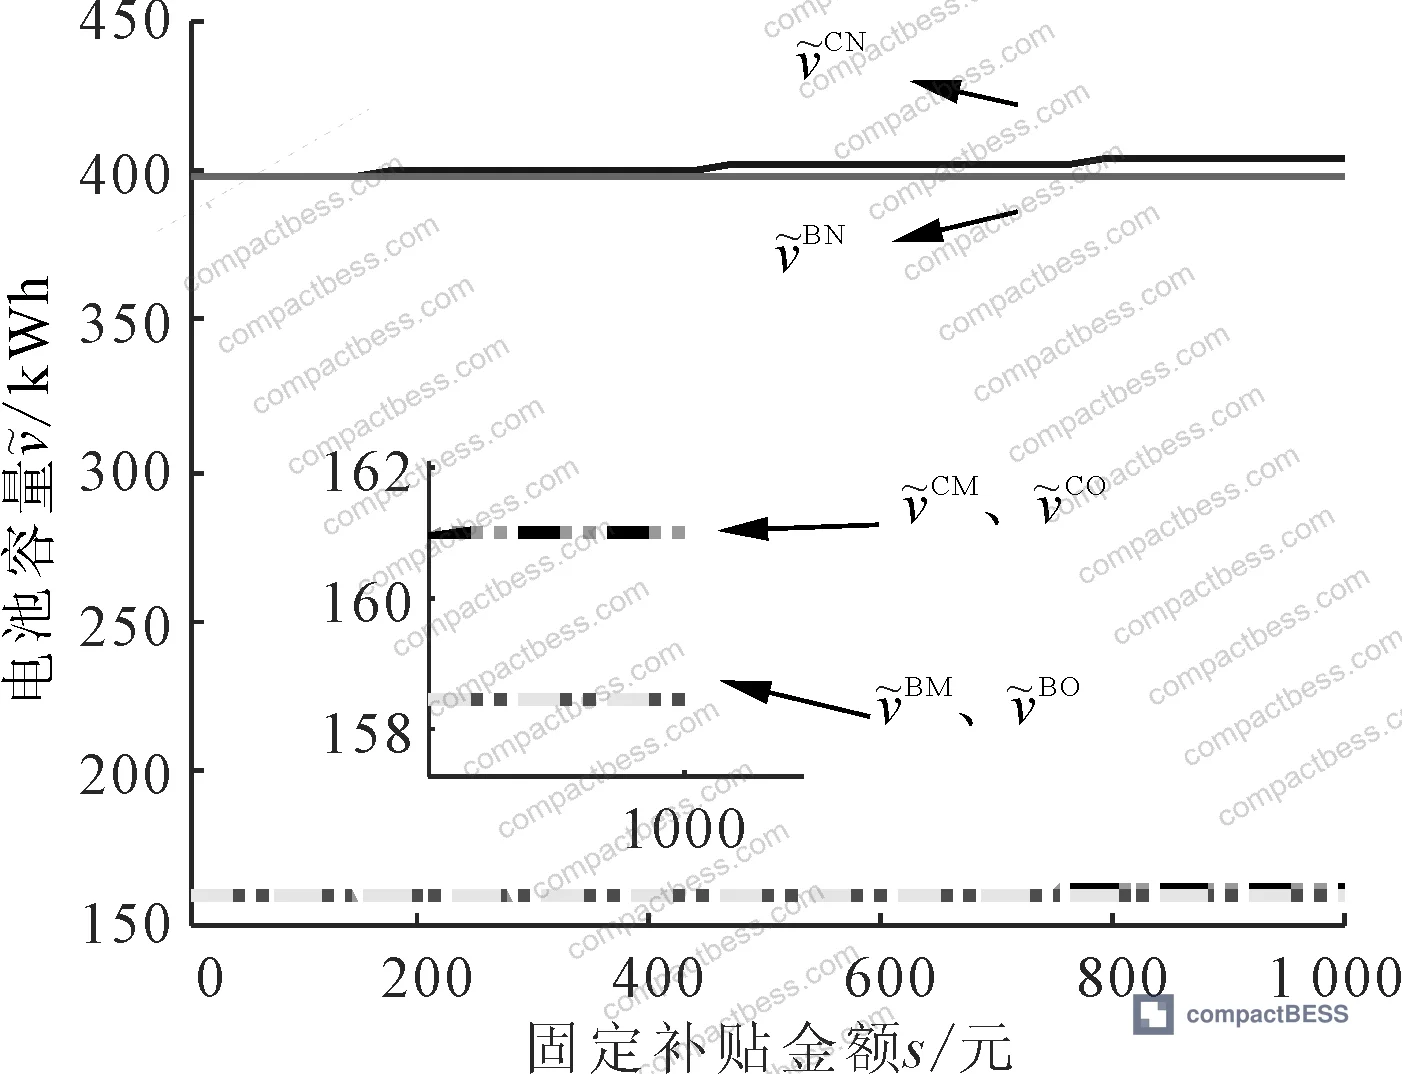
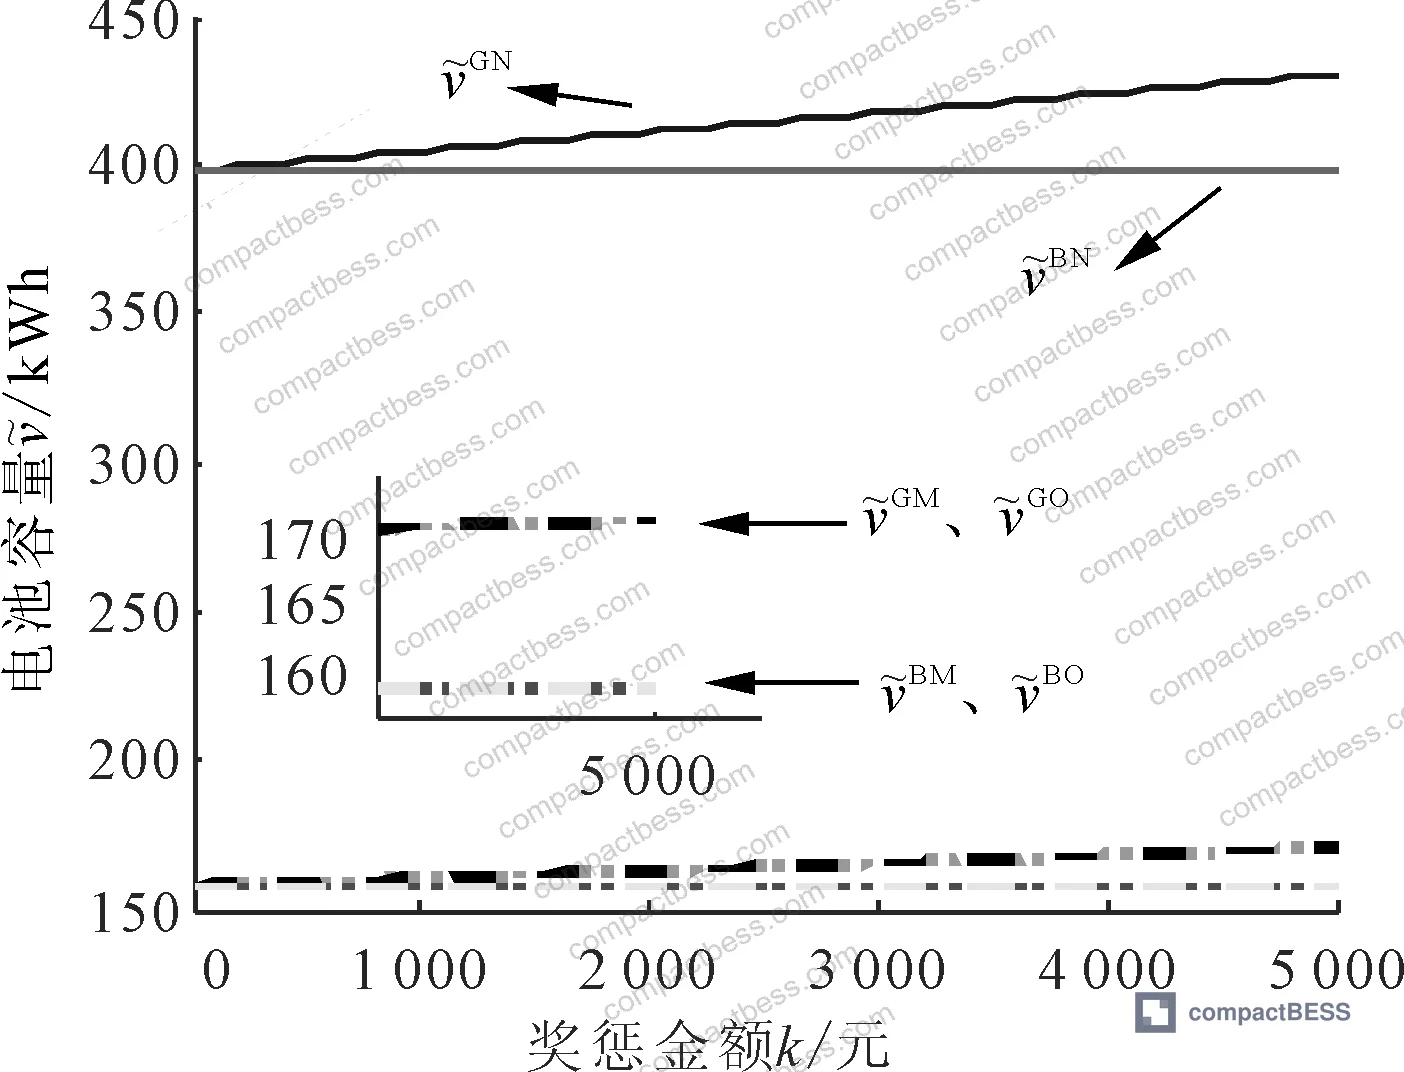
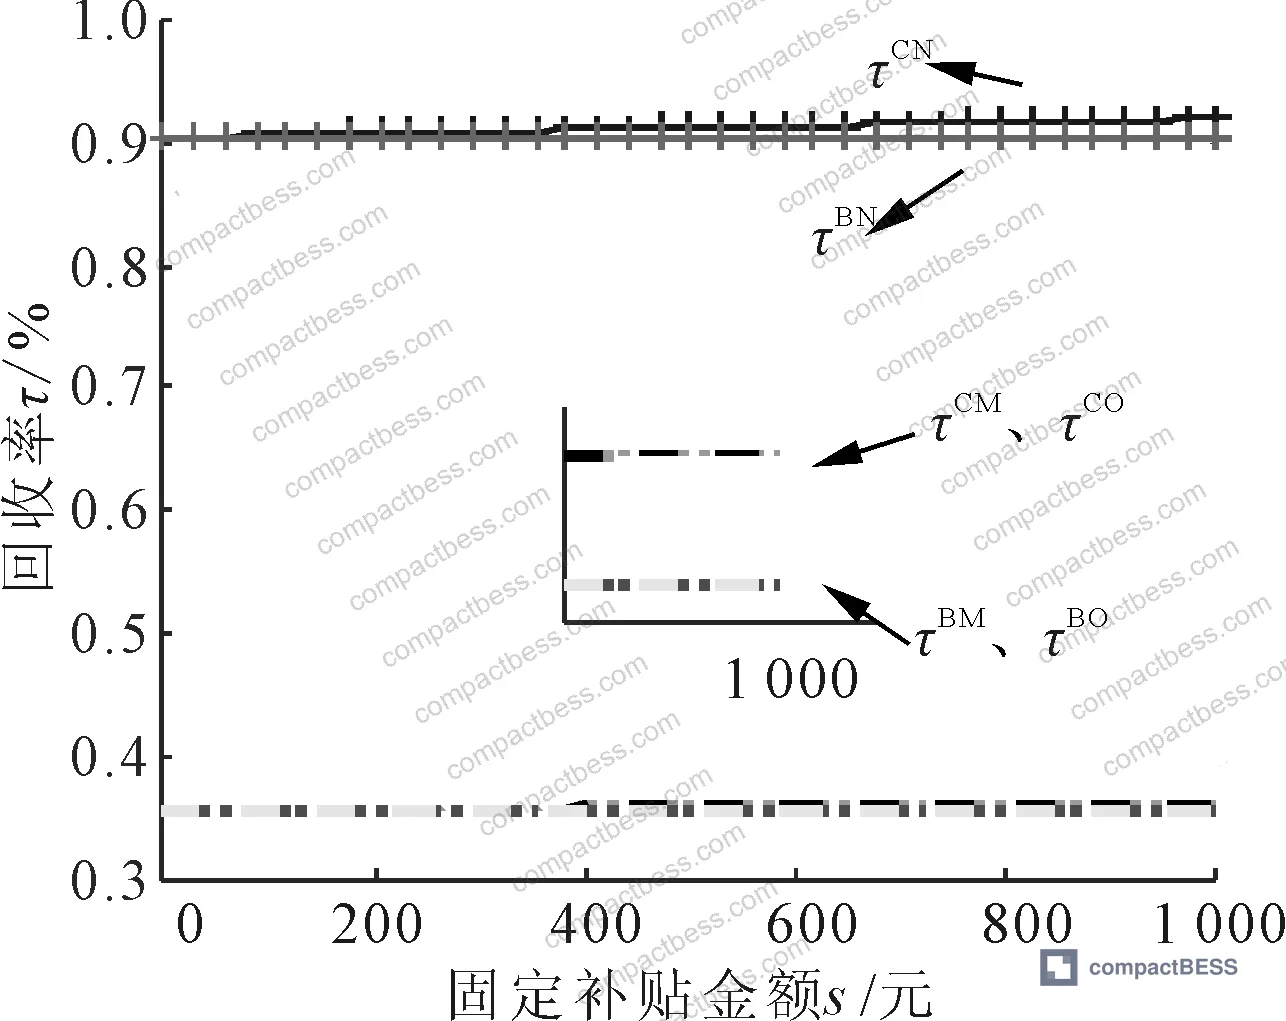
The core finding is quantitatively consistent across all policy conditions: when the battery manufacturer operates its own collection channel (Mode N), battery capacity level v̄ is strictly greater than under Mode M or Mode O for equivalent subsidy and levy amounts. This is not a marginal difference. Under fixed subsidy (C) and reward-penalty (G) policy conditions, the ranking is CN > BN > CM = CO > BM = BO across every metric — capacity, recovery rate, and total supply chain profit.
Why does this happen? When the battery manufacturer controls collection, it internalizes the full value of cascade reuse. The unit profit from cascade reuse is expressed as Δ = γh·v̄ + cm − cn, where γ = 105 (cascade reuse net profit coefficient), h = 0.8 (capacity retention rate), and cm = 61,000 (unit production cost of new battery). As cn approaches zero at scale — which the model confirms — the incentive to design higher-capacity cells and recover more of them becomes self-reinforcing. The manufacturer gets paid twice: once on the forward sale and again on the recovered material.
| Recovery Mode | Battery Capacity (v̄) | Recovery Rate (Q) | Supply Chain Profit |
|---|---|---|---|
| Battery Manufacturer (N) | Highest in all scenarios | Highest in all scenarios | Highest in all scenarios |
| EV Manufacturer (M) | Equal to Mode O | Equal to Mode O | Equal to Mode O |
| Third-Party Recycler (O) | Equal to Mode M | Equal to Mode M | Equal to Mode M |
Mode M and Mode O produce identical outcomes in every metric. That’s a significant result. It means paying a premium for a “branded” OEM take-back program versus a third-party recycler gets you exactly nothing in terms of cell design quality or recovery efficiency — unless the actual battery manufacturer is running the loop themselves.
Honestly, most procurement teams treat end-of-life recovery as a compliance question rather than a design quality signal. That framing is costing them. A battery manufacturer with skin in the recovery game designs cells for disassembly, targets higher initial capacity to maximize cascade reuse value, and maintains tighter capacity retention specifications. Those design choices show up in the cells you receive.
The parameter τ = 0.4 (baseline recovery rate) and Q₀ = 48,800 units (target recovery volume) used in the simulation represent realistic operating conditions. Under no-government-intervention baseline (B), the battery manufacturer recovery mode already outperforms alternatives. Every policy layer adds incrementally — but the structural advantage of Mode N exists independent of subsidy.
Government Policy Effects on Cell Capacity, Recovery Rate, and Supply Chain Profitability #
This is where it gets operationally useful for buyers dealing with Chinese suppliers navigating the domestic regulatory environment — and where many procurement teams don’t realize that the subsidy structure fundamentally changes supplier behavior.
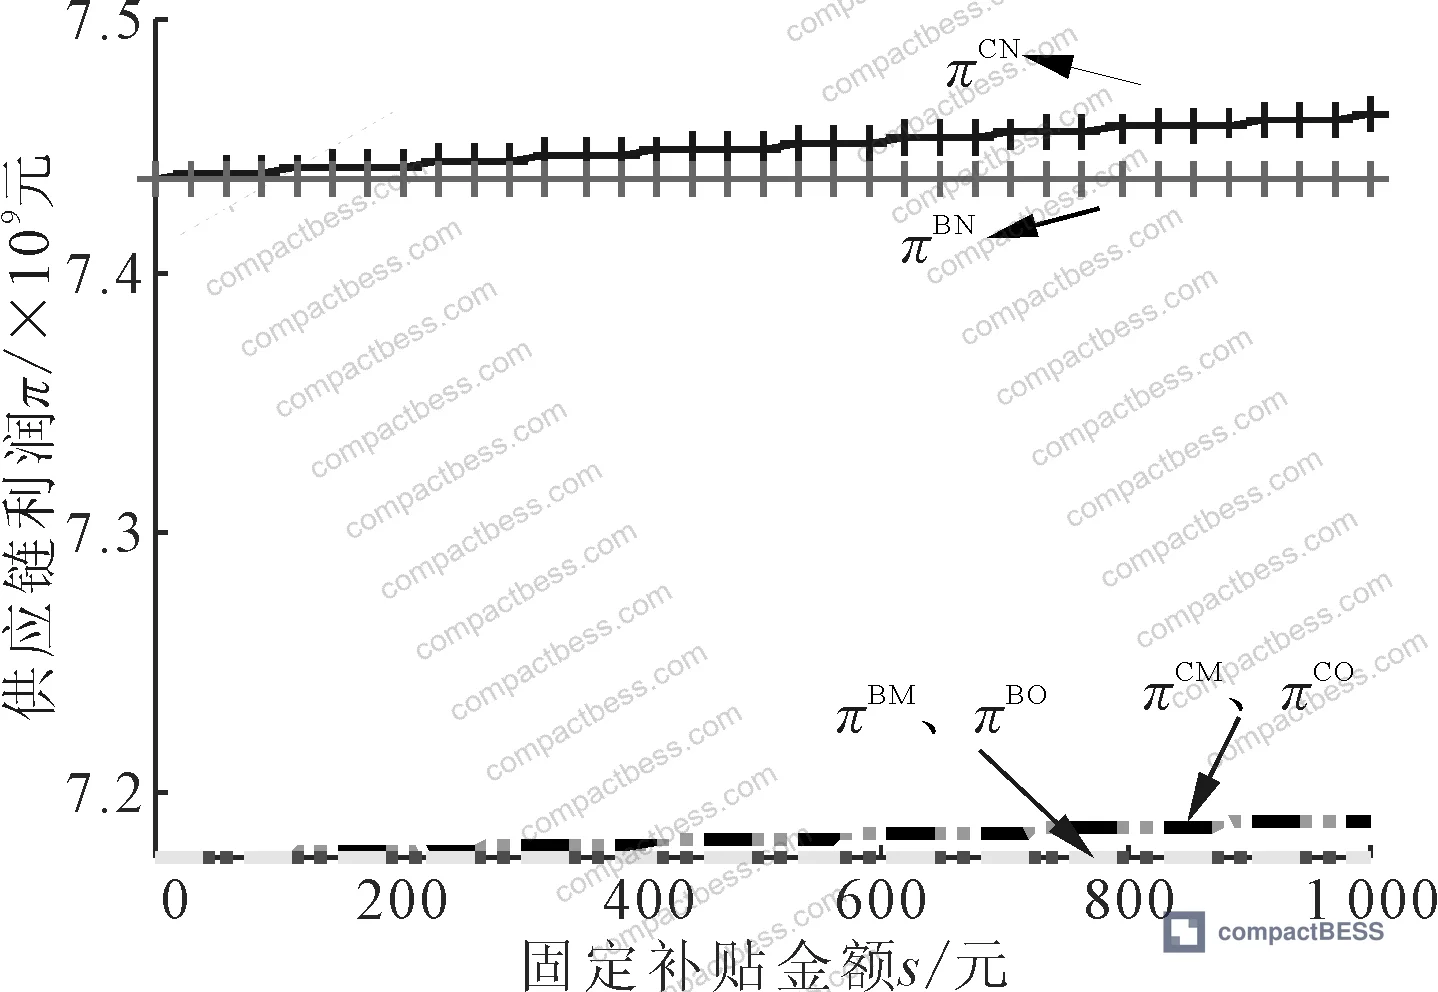
Fixed subsidy (C) and reward-penalty (G) policies both produce the same positive effect on battery capacity: ∂v̄/∂s > 0 and ∂v̄/∂k > 0. Battery capacity, recovery price p₂, and recovery volume Q all increase proportionally with subsidy/penalty amount. Under these policies, the CN model dominates — supply chain profit ranks CN > BN > CM = CO > BM = BO.
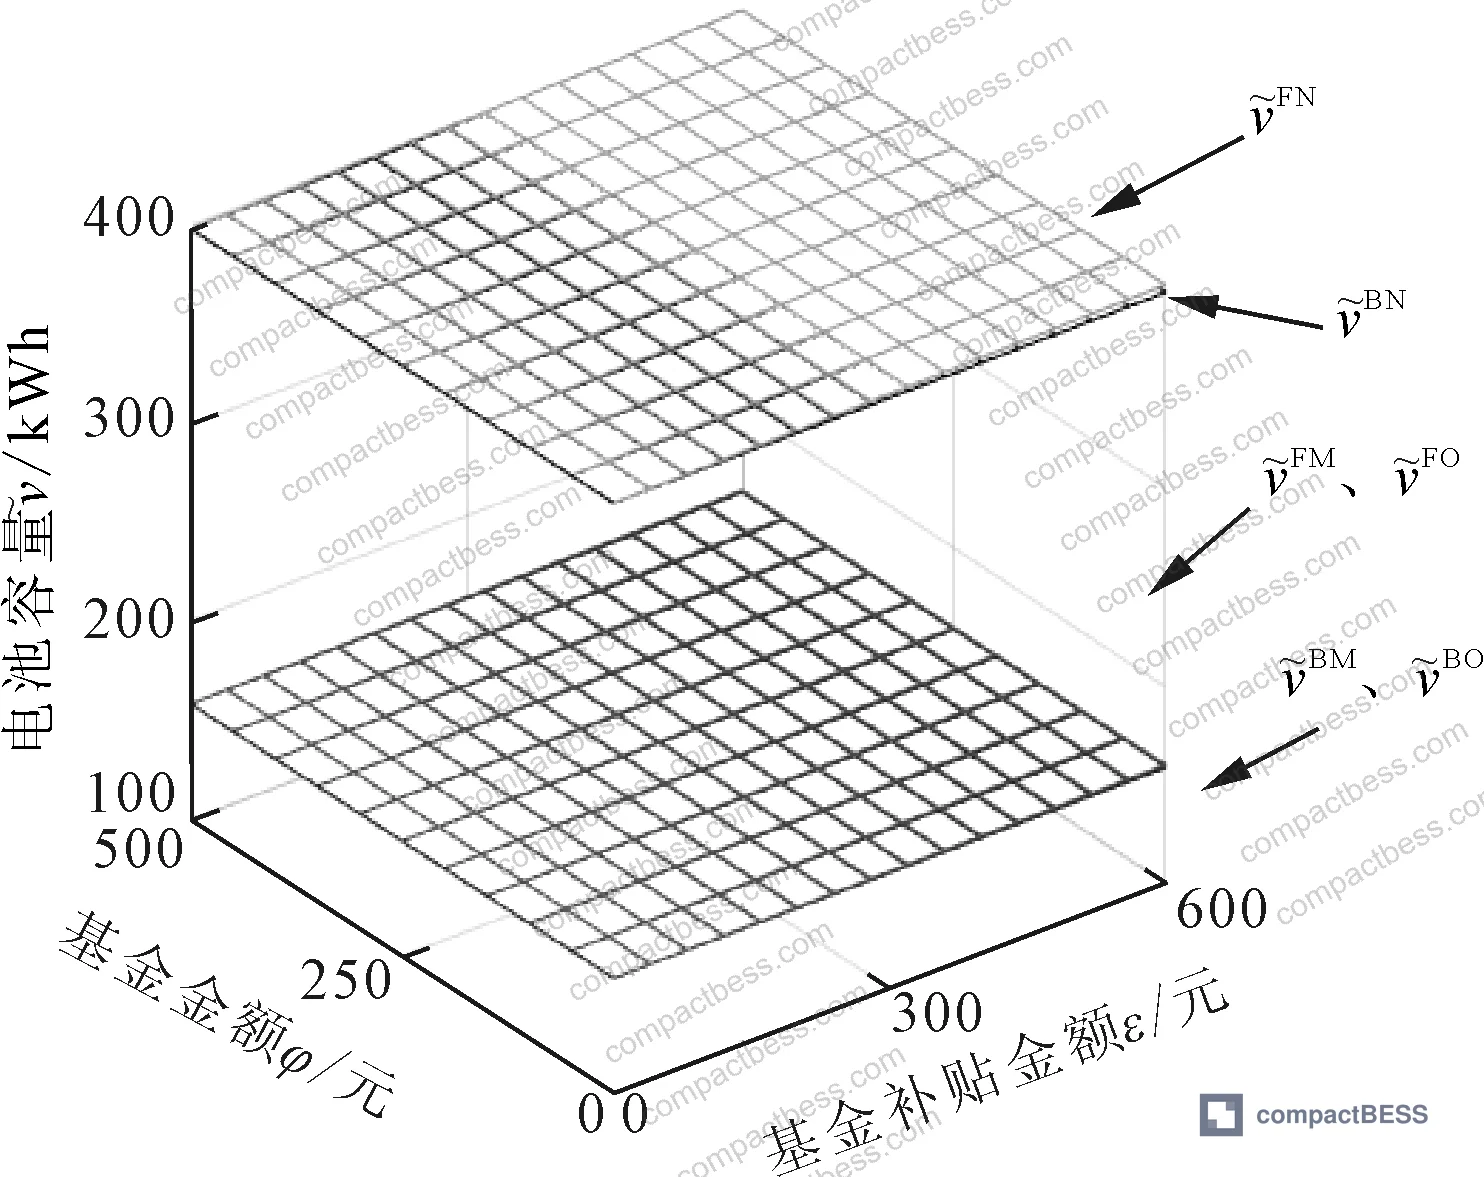
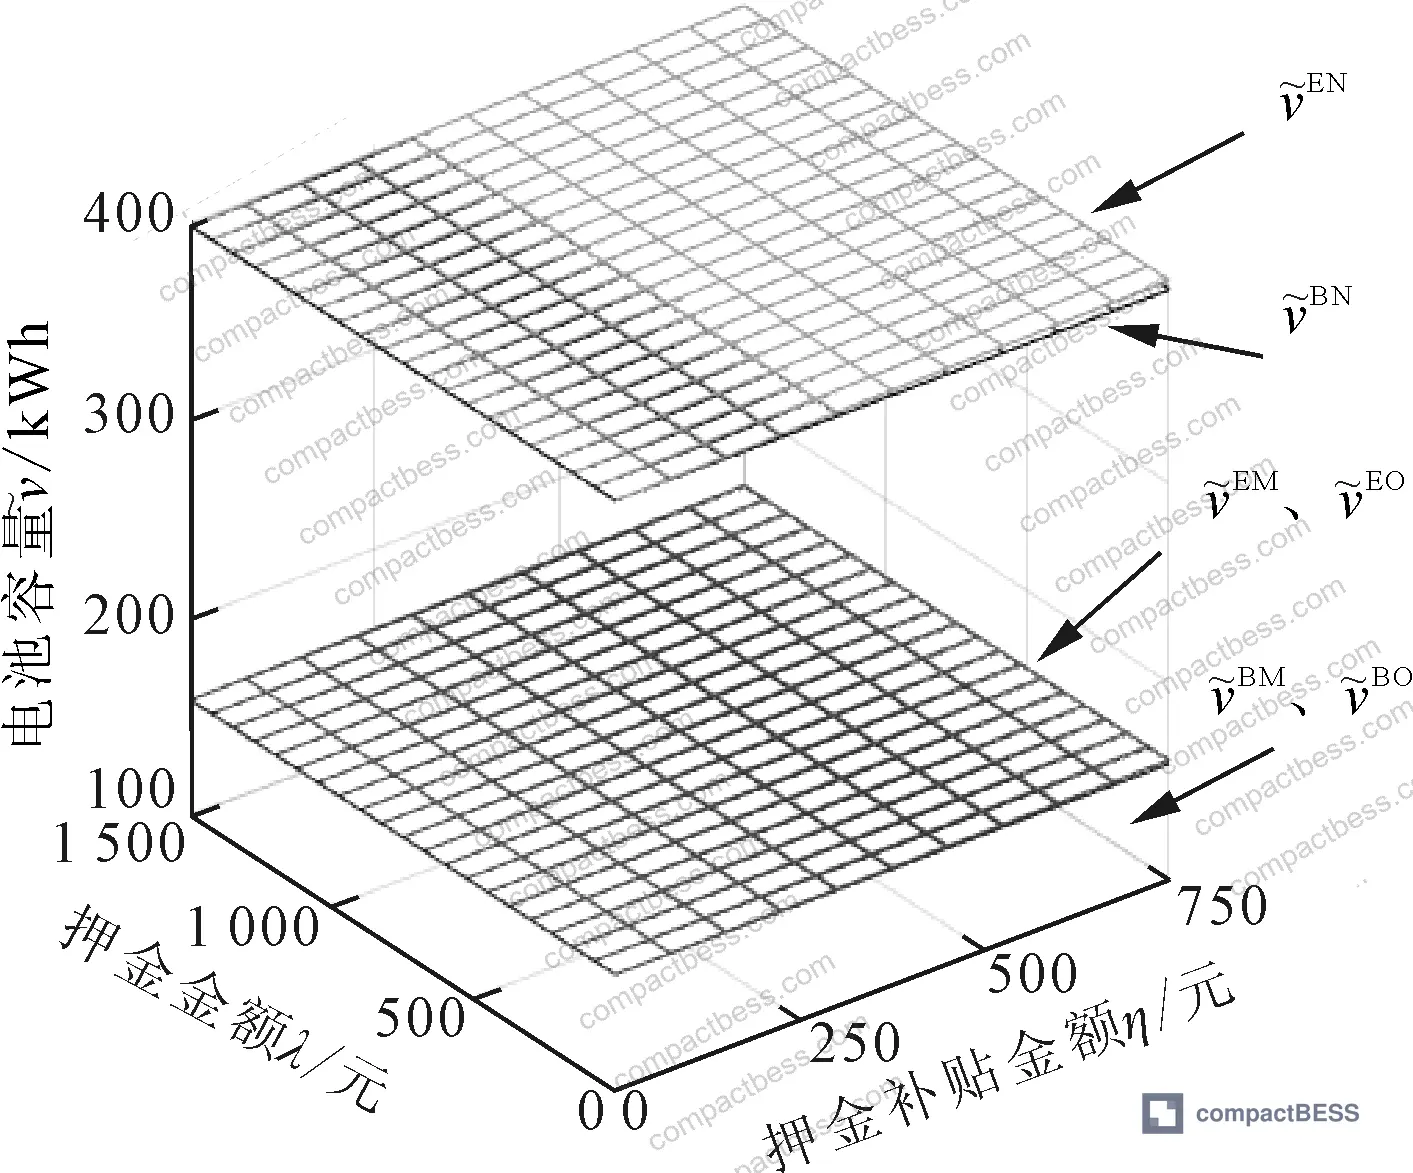
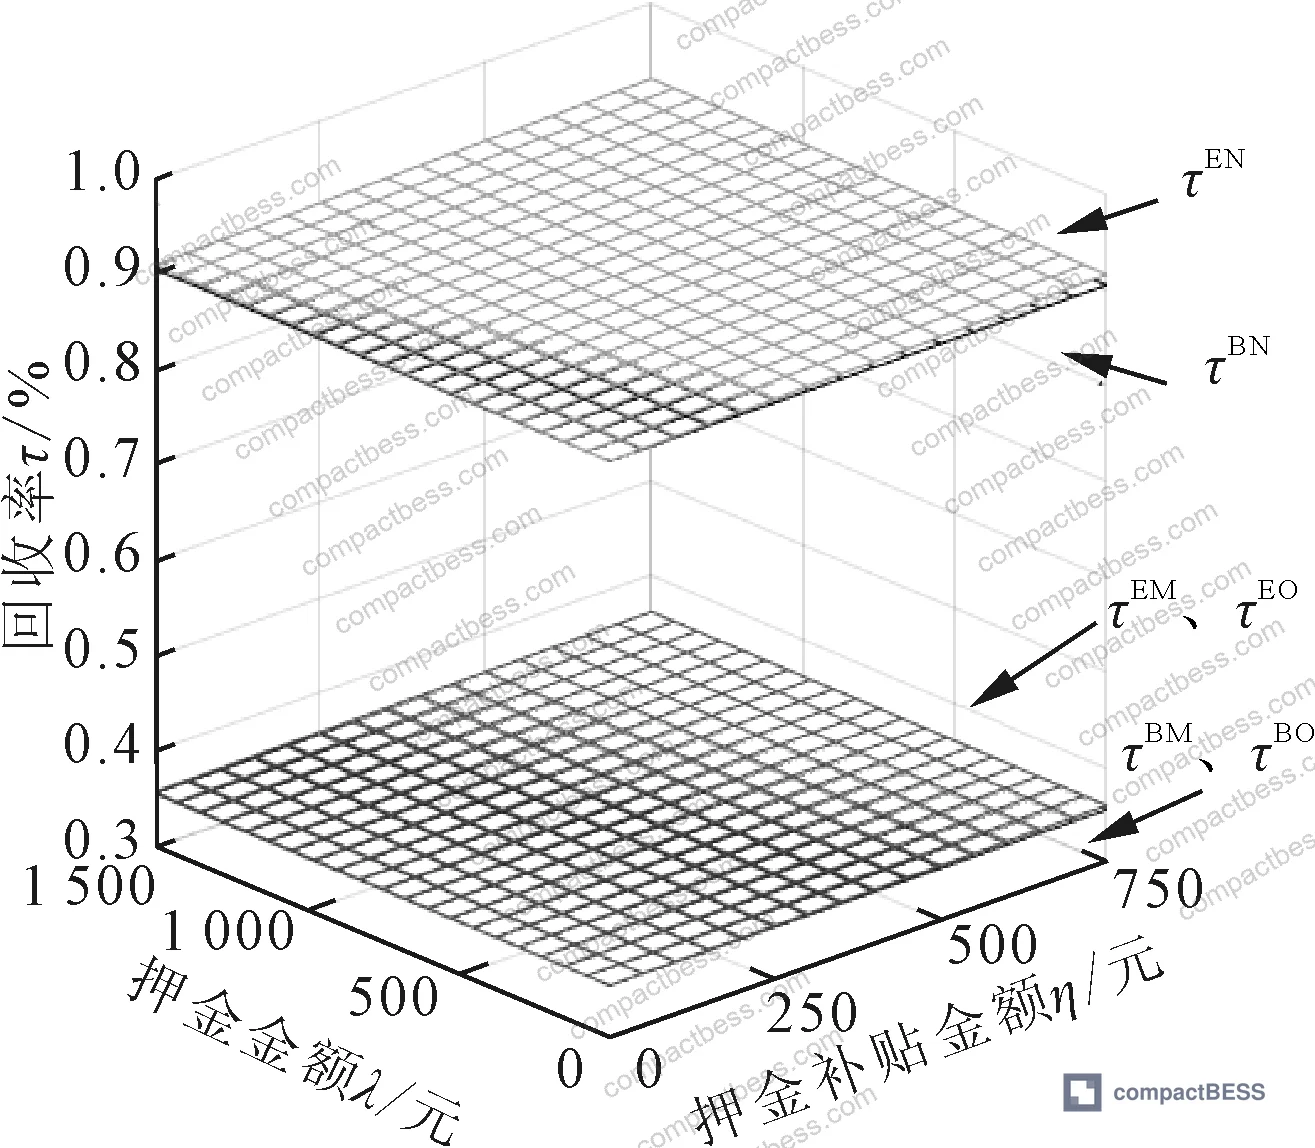
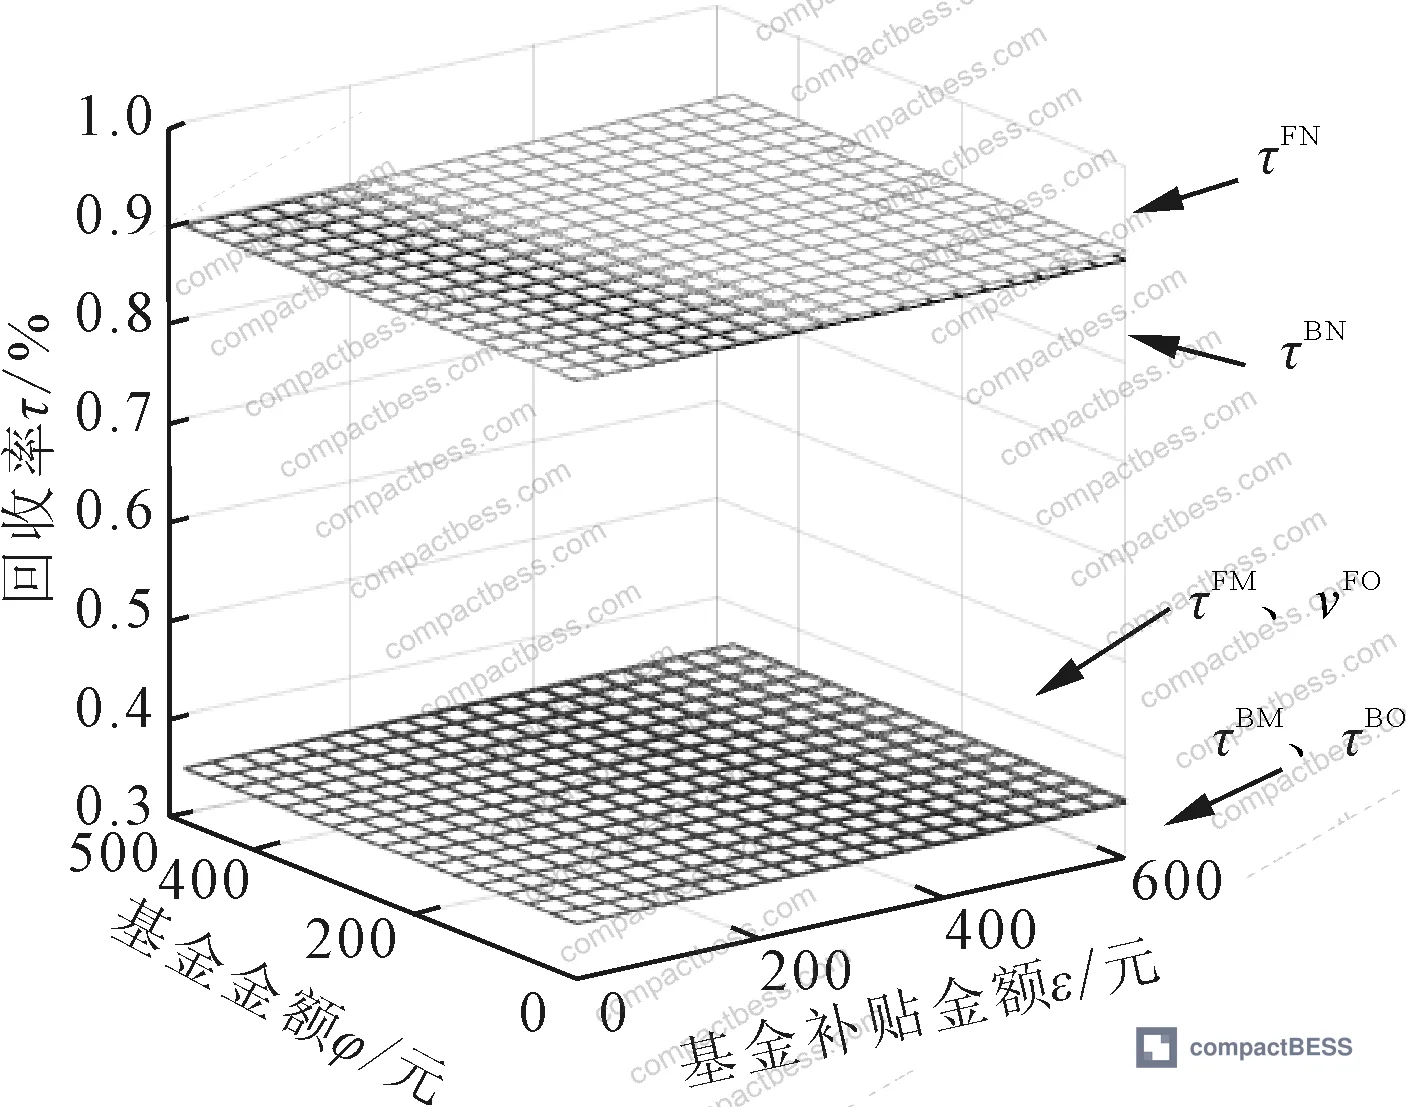
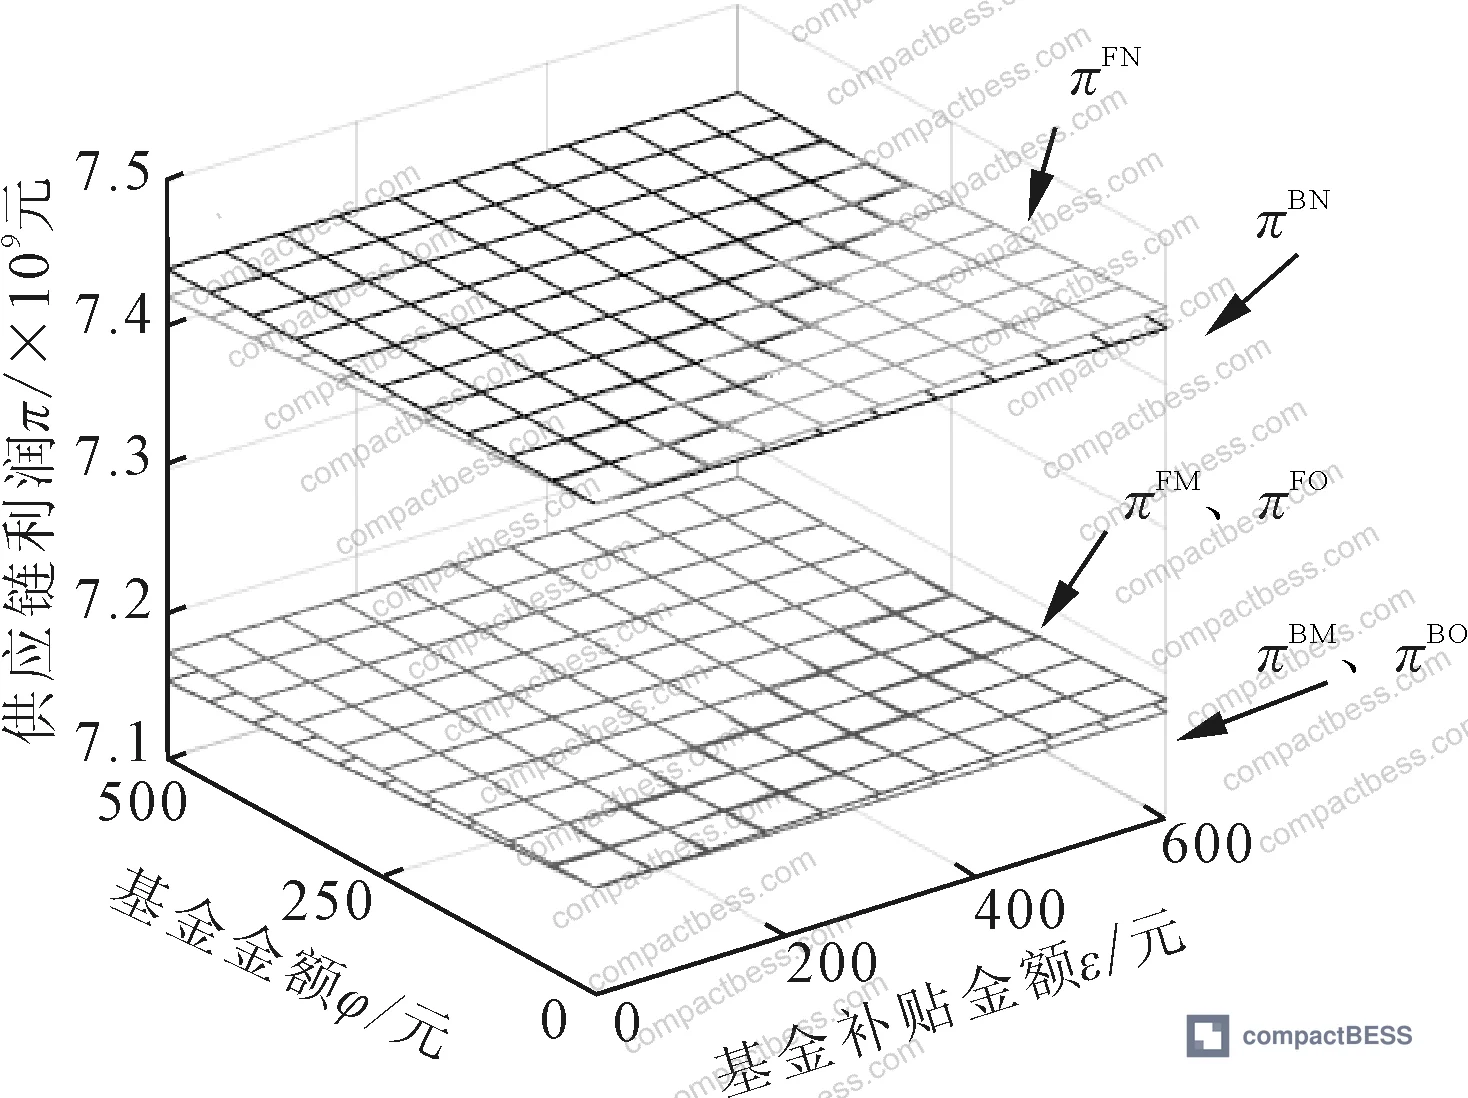
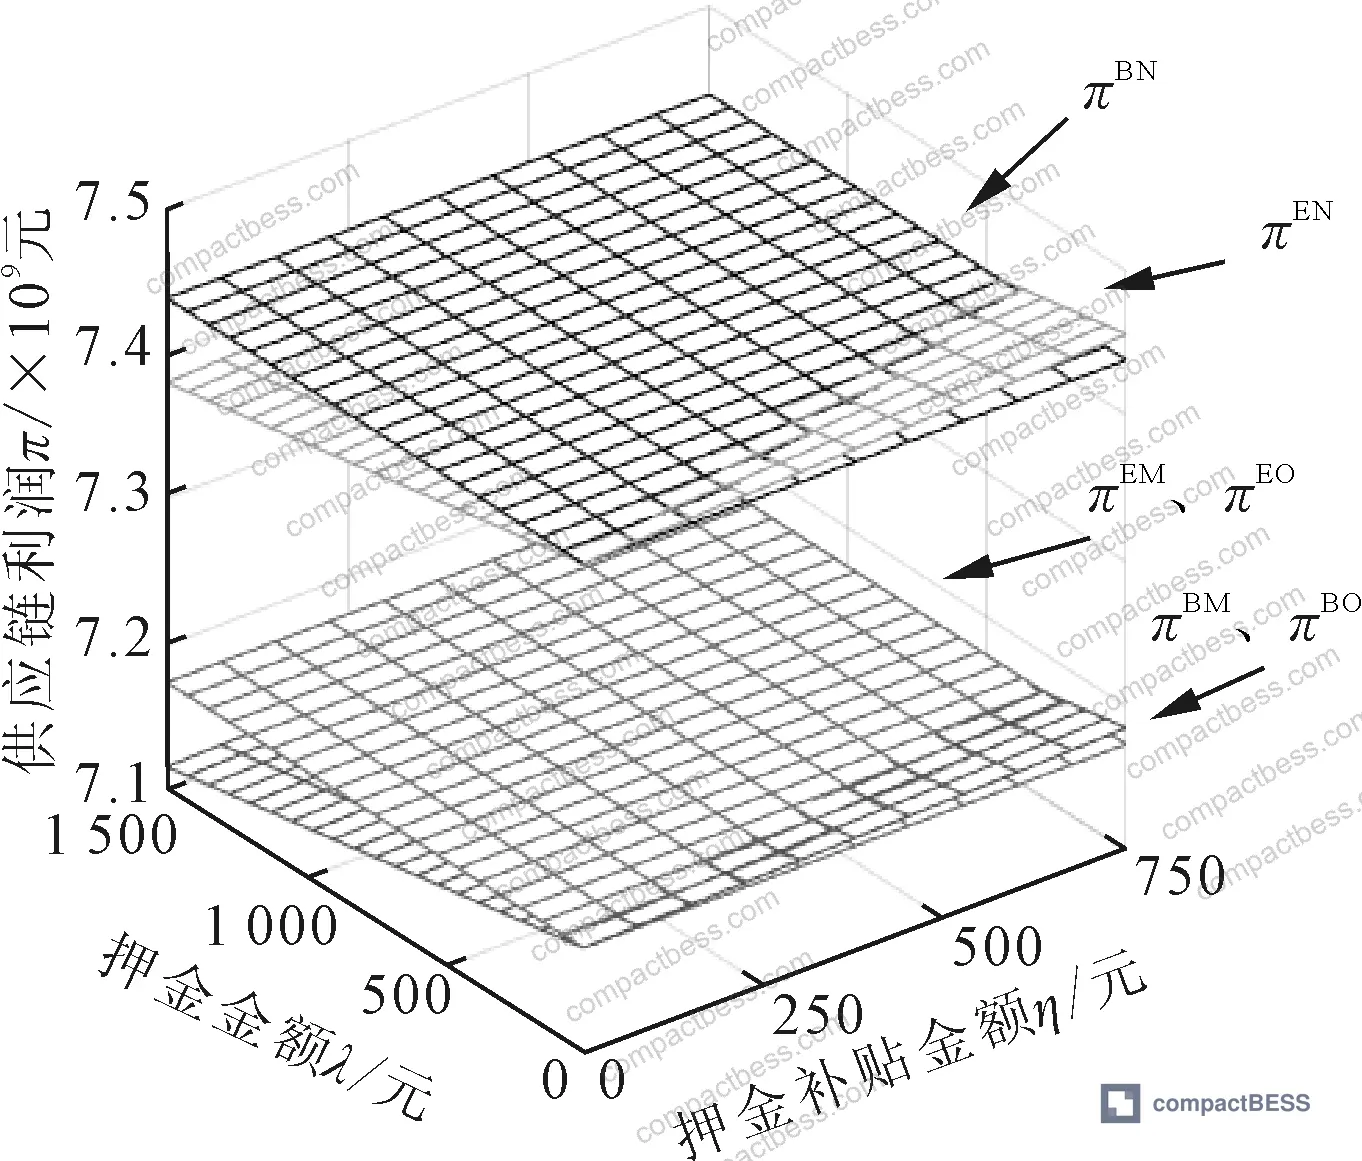
Deposit-refund (E) and fund (F) policies are more complex and frankly more dangerous for supply chain profitability. Both policies work by levying a charge (λ for deposit, φ for fund) on the battery manufacturer at the production stage and returning a subsidy (η or ε) to the collection entity. The model shows ∂w/∂λ > 0 and ∂w/∂φ > 0 — battery wholesale prices rise to offset the levy cost. That increase passes through to EV retail prices, suppressing demand. Battery capacity v̄ decreases with levy amount (∂v̄/∂λ < 0, ∂v̄/∂φ < 0) but increases with subsidy amount (∂v̄/∂η > 0, ∂v̄/∂ε > 0).
Most procurement teams don’t realize that China’s battery fund policies effectively function as a production tax when the levy-to-subsidy ratio is unfavorable. When subsidy amount drops to zero while levy remains high — the deposit/fund policy degenerates into a pure tax — battery capacity falls below the no-intervention baseline and supply chain profit drops significantly. The recovery rate, however, still increases under pure-tax conditions (positive levy, zero subsidy), because the manufacturer’s cost structure pushes them to recover more aggressively to recoup material value.
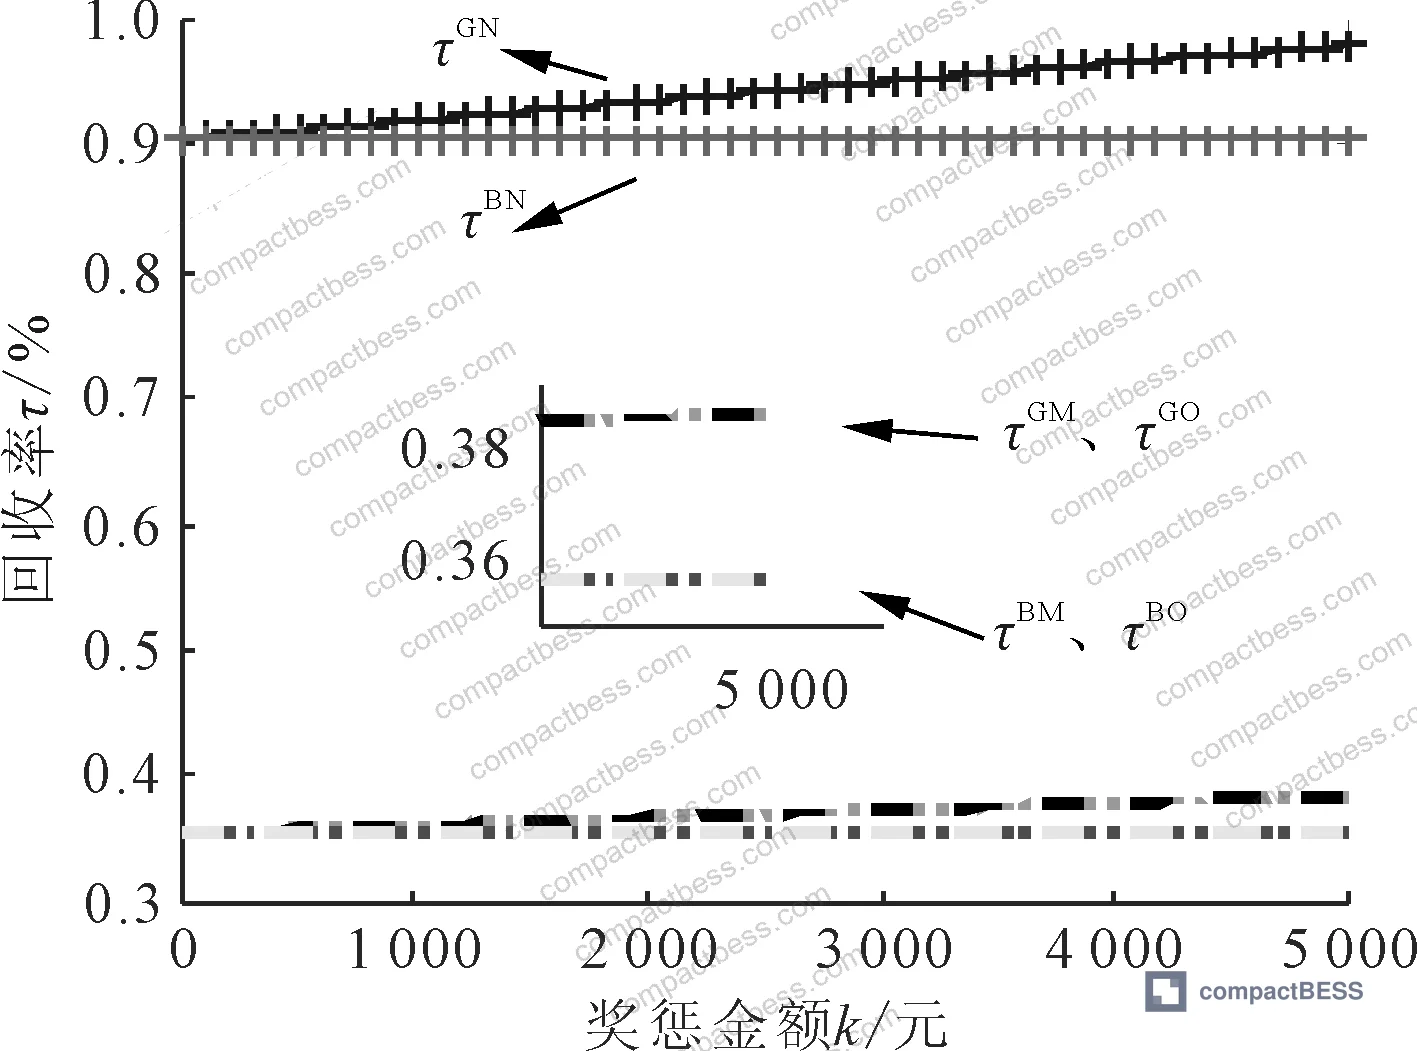
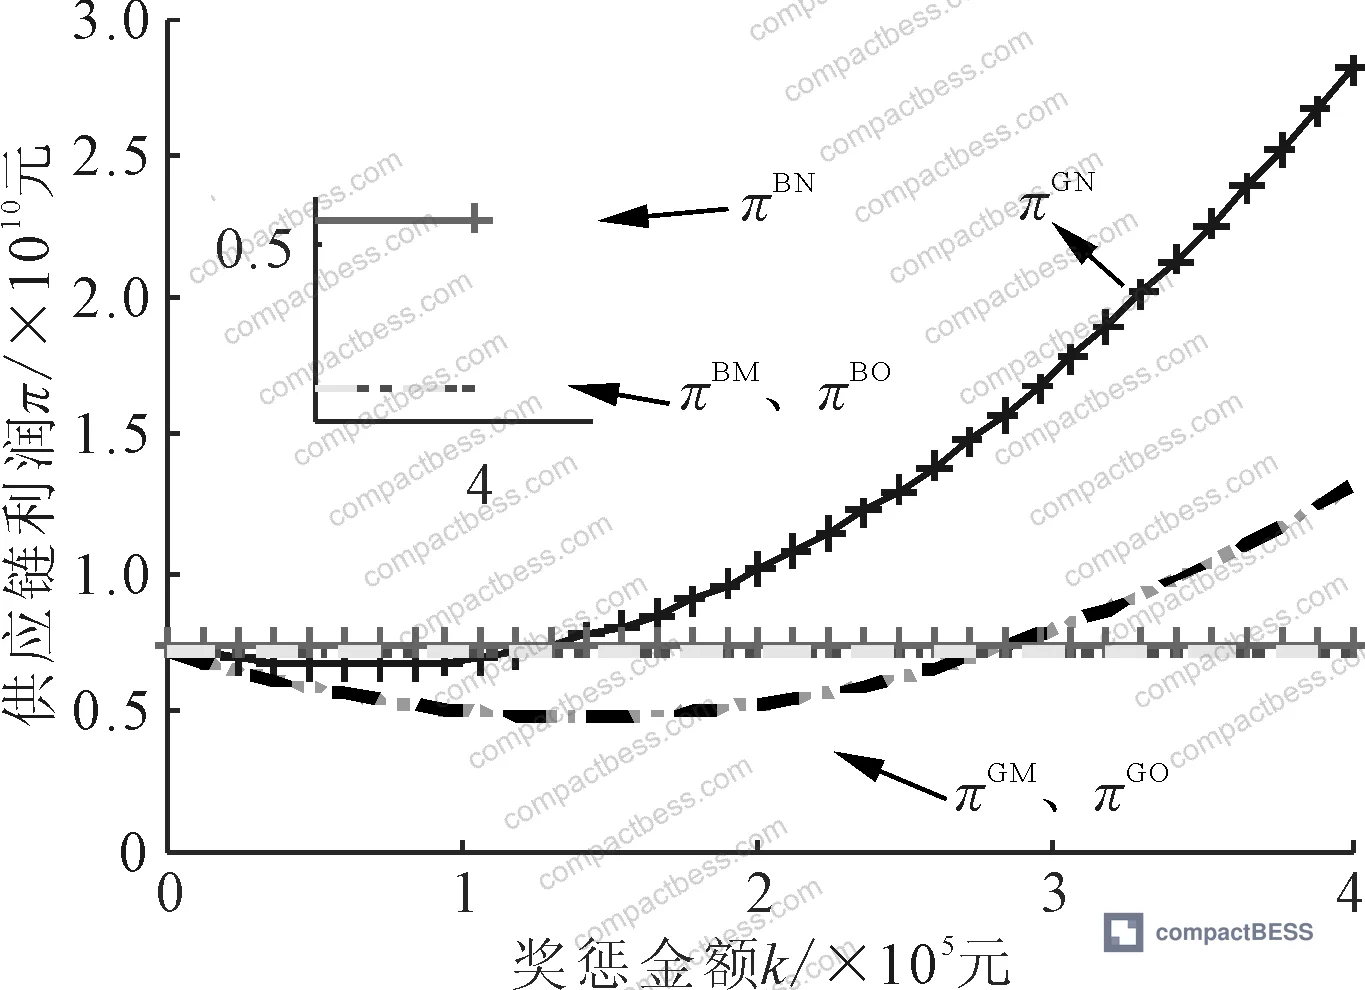
The reward-penalty policy (G) has one noteworthy complication at low penalty amounts. When k is small, companies have insufficient incentive to meet the target recovery volume Q₀ = d₀τ. Under these conditions, the model shows BN > GN — the no-intervention battery manufacturer mode actually outperforms the reward-penalty battery manufacturer mode in supply chain profit. The crossover occurs as k increases; at high penalty intensity, GN > GN > BN > BM = BO.
In supplier qualification, we have seen exactly this pattern play out: manufacturers operating under reward-penalty schemes with low threshold targets submit cells with adequate but uninspired capacity specs, because the penalty cost is lower than the R&D investment needed to push capacity higher. Once the regulatory penalty intensity exceeds a breakeven threshold, their cell design posture shifts completely.
Practical Guidance for Buyers #
When you’re sourcing lithium cells or battery packs from Chinese manufacturers for BESS integration, portable power, or EV support applications, the supplier’s position in the recovery ecosystem is a legitimate technical qualification criterion — not just ESG optics.
Specifically: a supplier who operates their own battery collection and cascade reuse program is structurally incentivized to design higher initial capacity cells (the model confirms v̄ is strictly higher under Mode N), offer higher recovery prices (p₂ is highest under Mode N), and maintain better capacity retention specifications (h ≥ 0.8 is the modeled threshold for viable cascade reuse). These design incentives flow directly into the product quality you receive on forward sale.
Ask prospective suppliers whether they are the battery manufacturer, EV assembler, or a third-party in their recovery chain. Mode M and Mode O produce identical, inferior outcomes in both cell design quality and recovery economics. A third-party recycler running the loop does nothing to improve the cells you buy — only manufacturer-led collection does.
Under current deposit-refund and fund policy conditions in China, battery wholesale prices are being pushed upward by levy costs. Expect this to affect quoted pricing. A supplier absorbing a fund levy φ at the production stage will pass that through to wholesale price w. Model the true cost accordingly, and don’t accept premium pricing without verifying the actual subsidy offset (ε or η) the supplier receives on recovered units.
For guidance on cell consistency and matching parameters relevant to second-life and cascade reuse applications, see Cell Consistency & Matching. For cycle life implications of capacity retention design decisions, see Cycle Life & Degradation.
CompactBESS connects global OEM buyers and energy storage integrators with verified Chinese cell and pack manufacturers — including suppliers with documented closed-loop recovery programs. If you’re qualifying suppliers for applications where cascade reuse compatibility or second-life battery capacity matters, our sourcing team can filter by recovery model type.
Need help identifying qualified suppliers for battery manufacturer-led collection and cascade reuse programs? Talk to our sourcing team →
Supplier Qualification Questions #
- Can you confirm whether your company directly operates battery collection and cascade reuse activities, or do you transfer recovered batteries to a third party? Specifically, does your recovery model correspond to Mode N (manufacturer-led) in your supply chain structure, and can you provide documentation of your collection volumes relative to your sales volume target recovery rate of τ ≥ 0.4?
- What is your current battery capacity retention rate (h) specification for cells entering the cascade reuse stage, and can you provide test data showing h ≥ 0.8 at the point of secondary application handoff — consistent with the 20%–80% residual capacity threshold for cascade reuse eligibility?
- What is your unit cascade reuse net profit coefficient (γ) per kWh of recovered capacity, and how does your recovery pricing model (p₂) change as your recycled material processing cost (c_n) approaches zero at scale?
- Under the current government fund or deposit-refund policy applicable to your production facility, what is the levy amount (λ or φ) charged per unit battery produced, what subsidy (η or ε) do you receive per unit recovered, and what is your net cost impact on wholesale pricing?
- Under your current reward-penalty program — if applicable — what is the target recovery volume Q₀ and the penalty/reward intensity k per unit deviation from target? At what penalty level does your company’s recovery behavior shift from baseline to incentivized mode, and what documentation supports that threshold?
Sourcing Checklist #
- ☐ Supplier operates a manufacturer-led (Mode N) battery collection program, not solely through third-party or EV OEM channels — confirmed by documented supply chain recovery flow diagram
- ☐ Battery capacity retention rate h ≥ 0.8 at point of cascade reuse handoff, verified by cycle test data or capacity measurement report
- ☐ Supplier’s battery cells meet baseline capacity specifications consistent with ≥75 kWh-equivalent energy density design targets (or proportional per-cell equivalent), with supporting design documentation
- ☐ Supplier can provide cascade reuse unit profit coefficient (γ) and recovery cost (c_n) data confirming that material recovery reduces net production cost toward zero at stated production volumes
- ☐ Cells comply with IEC 62619:2022 Safety requirements for secondary lithium cells and batteries — confirm certificate scope includes cells intended for second-life or cascade reuse applications
- ☐ Supplier discloses applicable government policy conditions (fixed subsidy s, fund levy φ, deposit λ) and can demonstrate wholesale price w is not inflated beyond documented levy offset
- ☐ Recovery rate documentation shows actual Q ≥ Q₀ = d₀τ where τ ≥ 0.4, or supplier provides explanation of policy compliance mechanism under reward-penalty (G) scheme
- ☐ Cell design documentation confirms capacity research and development cost coefficient ξ = 5,000 (or equivalent) with no unexplained reductions that would indicate downgraded R&D investment in battery capacity optimization
Key Specifications Table #
| Parameter | Recommended Value | Verification Method |
|---|---|---|
| Battery capacity retention rate (h) at cascade reuse threshold | ≥ 0.8 (residual capacity 20%–80% of rated) | Cycle capacity test per IEC 61960-3 Secondary lithium cells and batteries for portable applications; measure discharge capacity at stated cycle count |
| Baseline recovery rate (τ) relative to sales volume | ≥ 0.4 (40% of sold units recovered) | Supplier’s annual collection records vs. total units placed on market; cross-reference against regulatory filing under GB/T 36276-2018 |
| Unit cascade reuse net profit coefficient (γ) | ≥ 105 CNY/unit (model-validated threshold for positive recovery economics) | Request supplier’s cascade reuse revenue documentation or secondary market pricing data for recovered cell lots |
| Battery capacity R&D cost coefficient (ξ) | ≤ 5,000 (cost coefficient per kWh² capacity increment) | Review supplier’s annual R&D expenditure vs. capacity improvement data; higher ξ values indicate diminishing returns on capacity investment |
| Target recovery volume (Q₀) under reward-penalty policy | ≥ d₀ × τ = 48,800 units (model reference value) | Government-mandated recovery target documentation; verify supplier’s actual Q vs. Q₀ in compliance filings |
| Penalty/reward intensity (k) crossover threshold | k sufficient to produce GN > BN in supply chain profit | Ask supplier at what k value their recovery posture changes; request internal policy sensitivity analysis |
Can’t find a supplier meeting these specs? Submit your requirements and we’ll match you within 48 hours.
References #
Data source: Closed-Loop Supply Chain Recovery Mode Selection for End-of-Life Power Batteries Considering Cascade Reuse under Government Policy Scenarios, N.-R. Cao et al., Energy Storage Materials, 2023
Frequently Asked Questions #
Why does the battery manufacturer-led recovery model produce better cell quality than third-party or OEM-led models?
When the battery manufacturer controls its own collection channel, it internalizes the full value of cascade reuse — meaning higher initial cell capacity directly increases recovery profits through the term γh·v̄. This creates a self-reinforcing design incentive that neither EV OEM-led nor third-party recovery models can replicate, because those actors don’t capture the same upstream material cost savings (cm − cn) from recovered cells.
What is cascade reuse and why does it matter for buyers sourcing cells for BESS applications?
Cascade reuse refers to the secondary deployment of batteries with residual capacity between 20% and 80% of their original rated capacity — after they are no longer suitable for primary EV propulsion but still viable for stationary storage. For BESS integrators, understanding whether the cells you buy were designed with cascade reuse in mind tells you a great deal about their cycle life engineering and capacity retention specifications.
How do China’s deposit-refund and fund policies affect battery wholesale pricing for overseas buyers?
Both policies levy a charge (λ or φ) on battery manufacturers at the production stage. The model confirms ∂w/∂λ > 0 and ∂w/∂φ > 0 — wholesale prices rise to offset these costs. Overseas buyers should expect Chinese suppliers operating under these policy regimes to quote higher base prices, and should verify the subsidy offset amount (η or ε) the supplier receives on recovered units before accepting pricing at face value.
Does a higher government subsidy always improve battery capacity and recovery rates?
Under fixed subsidy (C) and reward-penalty (G) policies, yes — battery capacity and recovery rate both increase monotonically with subsidy/penalty amount, with ∂v̄/∂s > 0 and ∂Q/∂s > 0. Under deposit-refund and fund policies, the answer depends on the levy-to-subsidy ratio: when the levy dominates (subsidy approaches zero), battery capacity actually falls below the no-intervention baseline, while recovery rate may still increase modestly.
What recovery rate baseline should buyers use when qualifying suppliers under current Chinese regulatory conditions?
The model uses τ = 0.4 as the baseline recovery rate, with a target volume Q₀ = 48,800 units representing a realistic current-market expectation. Suppliers operating under reward-penalty schemes should be targeting actual Q ≥ Q₀; those falling short are likely operating under a low-k (low penalty intensity) regime where the cost of non-compliance is cheaper than the investment needed to meet targets. For UN38.3 Transport Certification and cross-border shipment compliance, also verify that recovered cells being repackaged for secondary markets carry appropriate re-certification documentation per UL 9540A Test Method for Evaluating Thermal Runaway Fire Propagation in Battery Energy Storage Systems.
Published by compactbess.com Technical Team | Request a sourcing quote


