

TL;DR #
At a coolant flow rate of 3 L·min⁻¹ per module, a 1P26S LFP pack operating at 0.5P charge/discharge reaches a maximum cell surface temperature of 33.9 °C and a maximum inter-cell temperature differential of 2.9 °C — both within the design thresholds of <35 °C and <3 °C respectively. For buyers specifying battery energy storage modules, this data establishes a concrete baseline for thermal management performance verification that most supplier datasheets simply do not provide. Before accepting any module-level thermal spec, require CFD validation files and corresponding physical test data showing agreement within ±1 °C.
Overview #
When evaluating battery module designs for stationary energy storage, most procurement teams focus on cell chemistry and cycle life — and consistently underweight thermal architecture. That’s a mistake that shows up later, in capacity fade, warranty claims, and in the worst cases, thermal runaway events. The data presented in this article draws on controlled laboratory validation work conducted at an industrial power electronics research facility, where a modular single-phase immersion cooling system was subjected to both CFD simulation and physical prototype testing across multiple charge/discharge cycles. The experimental setup used 280 Ah LFP prismatic cells configured in a 1P26S arrangement, with all cell tab temperatures monitored through four complete charge/discharge cycles under 0.5P conditions. Simulation and measured results showed alignment within 0.9 °C on peak temperature and within 0.2 °C on inter-cell differential.
This level of thermal characterization matters directly to procurement. If you’re sourcing modular BESS units or evaluating pack-level designs from Chinese manufacturers, the thermal management architecture — specifically whether the design is air-cooled, cold-plate liquid-cooled, or immersion-cooled — determines long-term cell consistency and pack longevity more than most spec sheet parameters. For a deeper look at how cell format affects heat dissipation pathways, see our Cell Formats & Form Factors documentation, which covers prismatic, cylindrical, and pouch geometries in the context of pack thermal design.
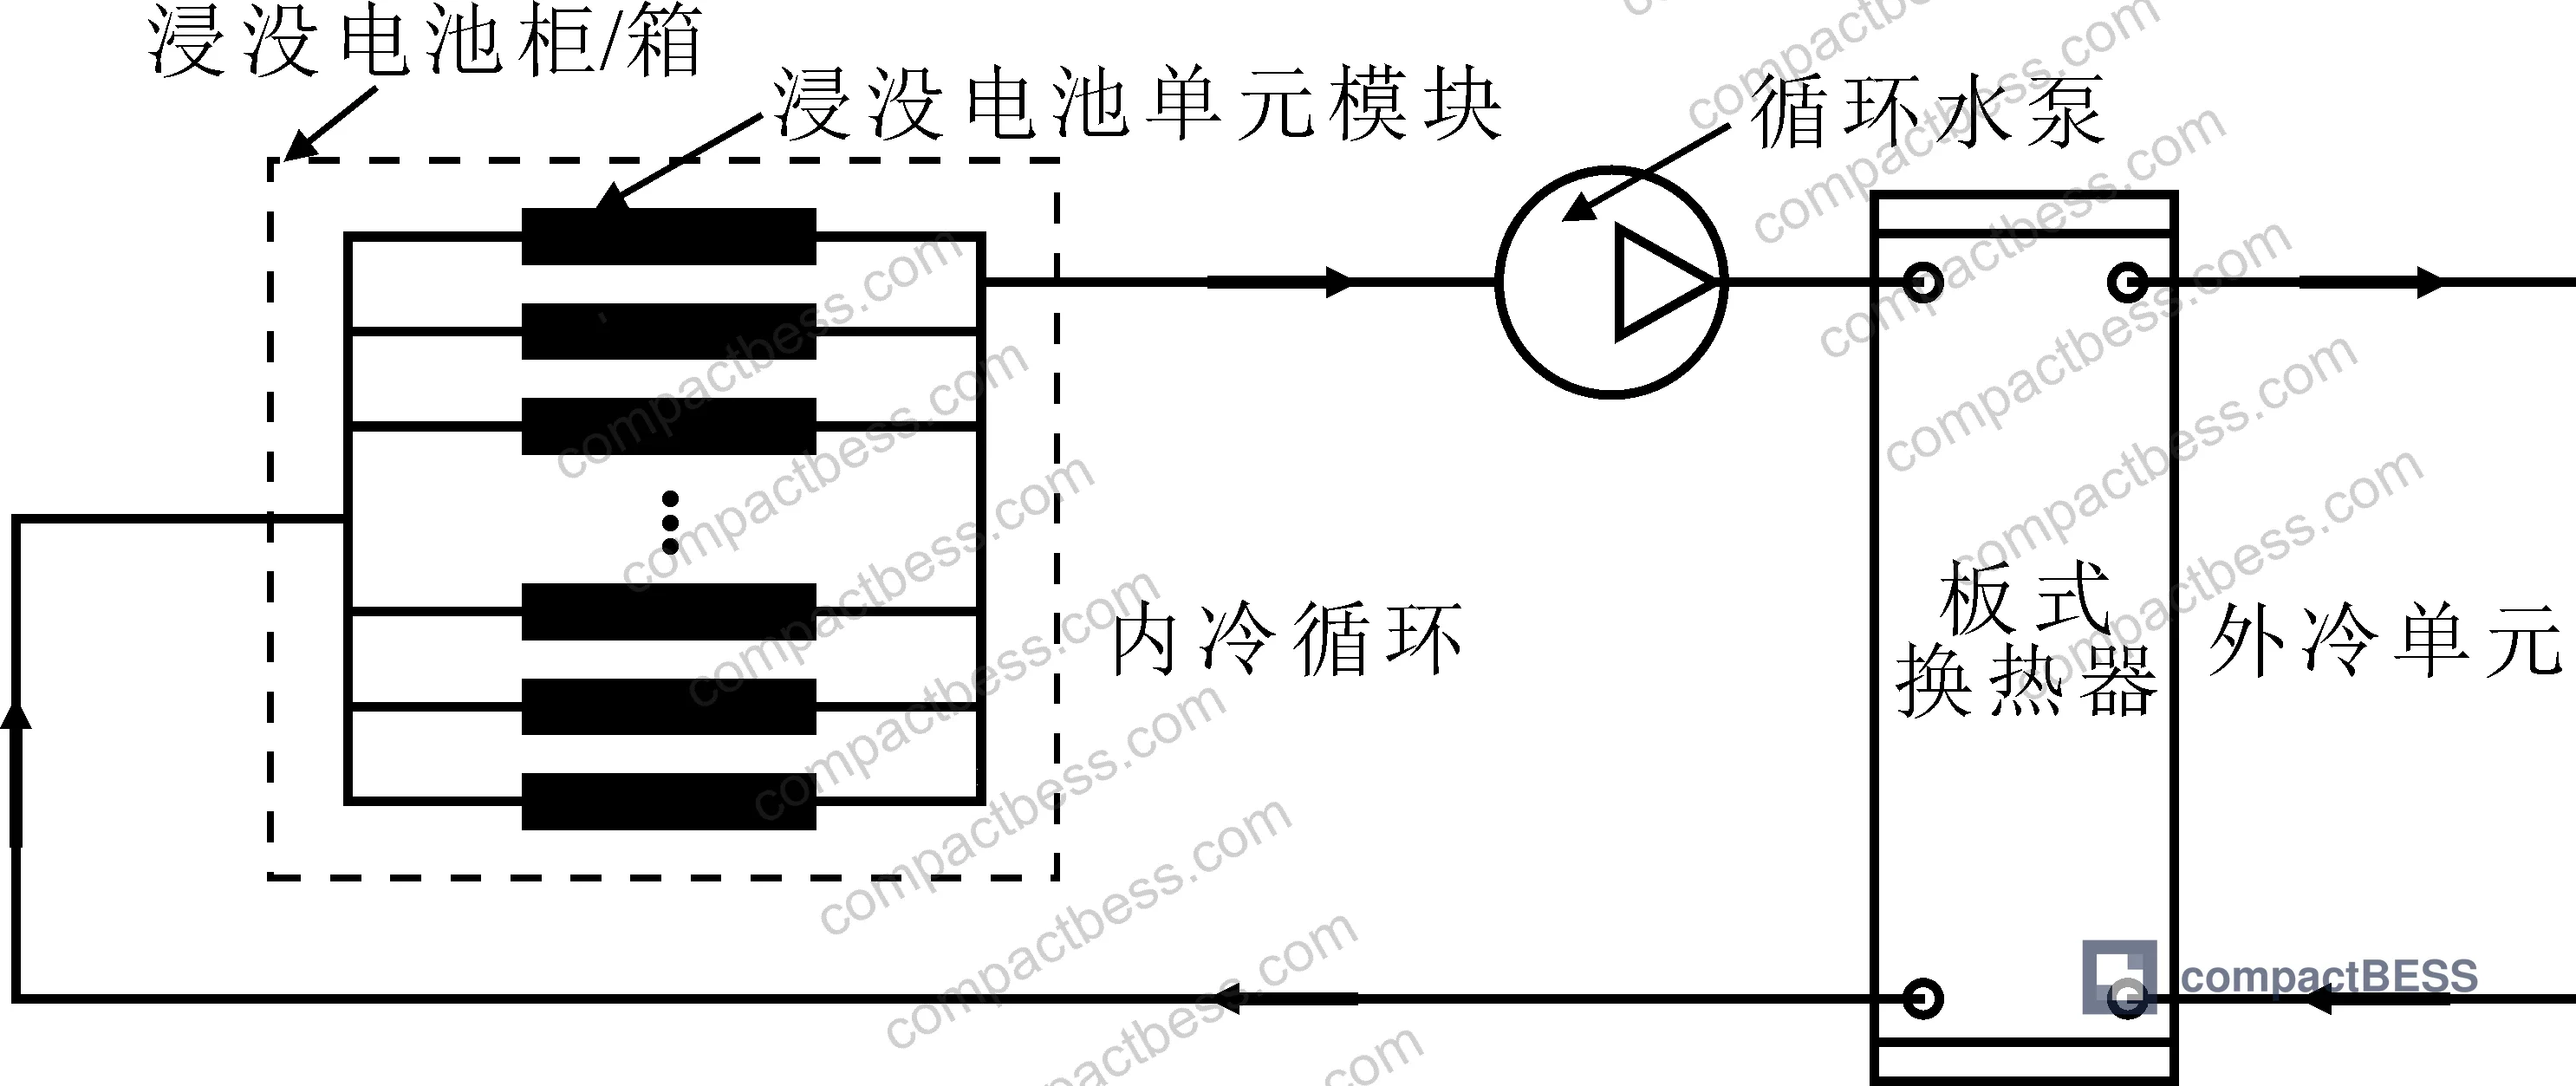
Immersion Cooling Performance: Flow Rate Thresholds and Temperature Distribution #
The core finding from the validation study is that flow rate selection is not a trivial variable — it is the primary lever controlling whether the module meets or fails thermal design requirements. Two flow conditions were tested against a design specification of maximum cell temperature <35 °C and maximum inter-cell temperature differential <3 °C.
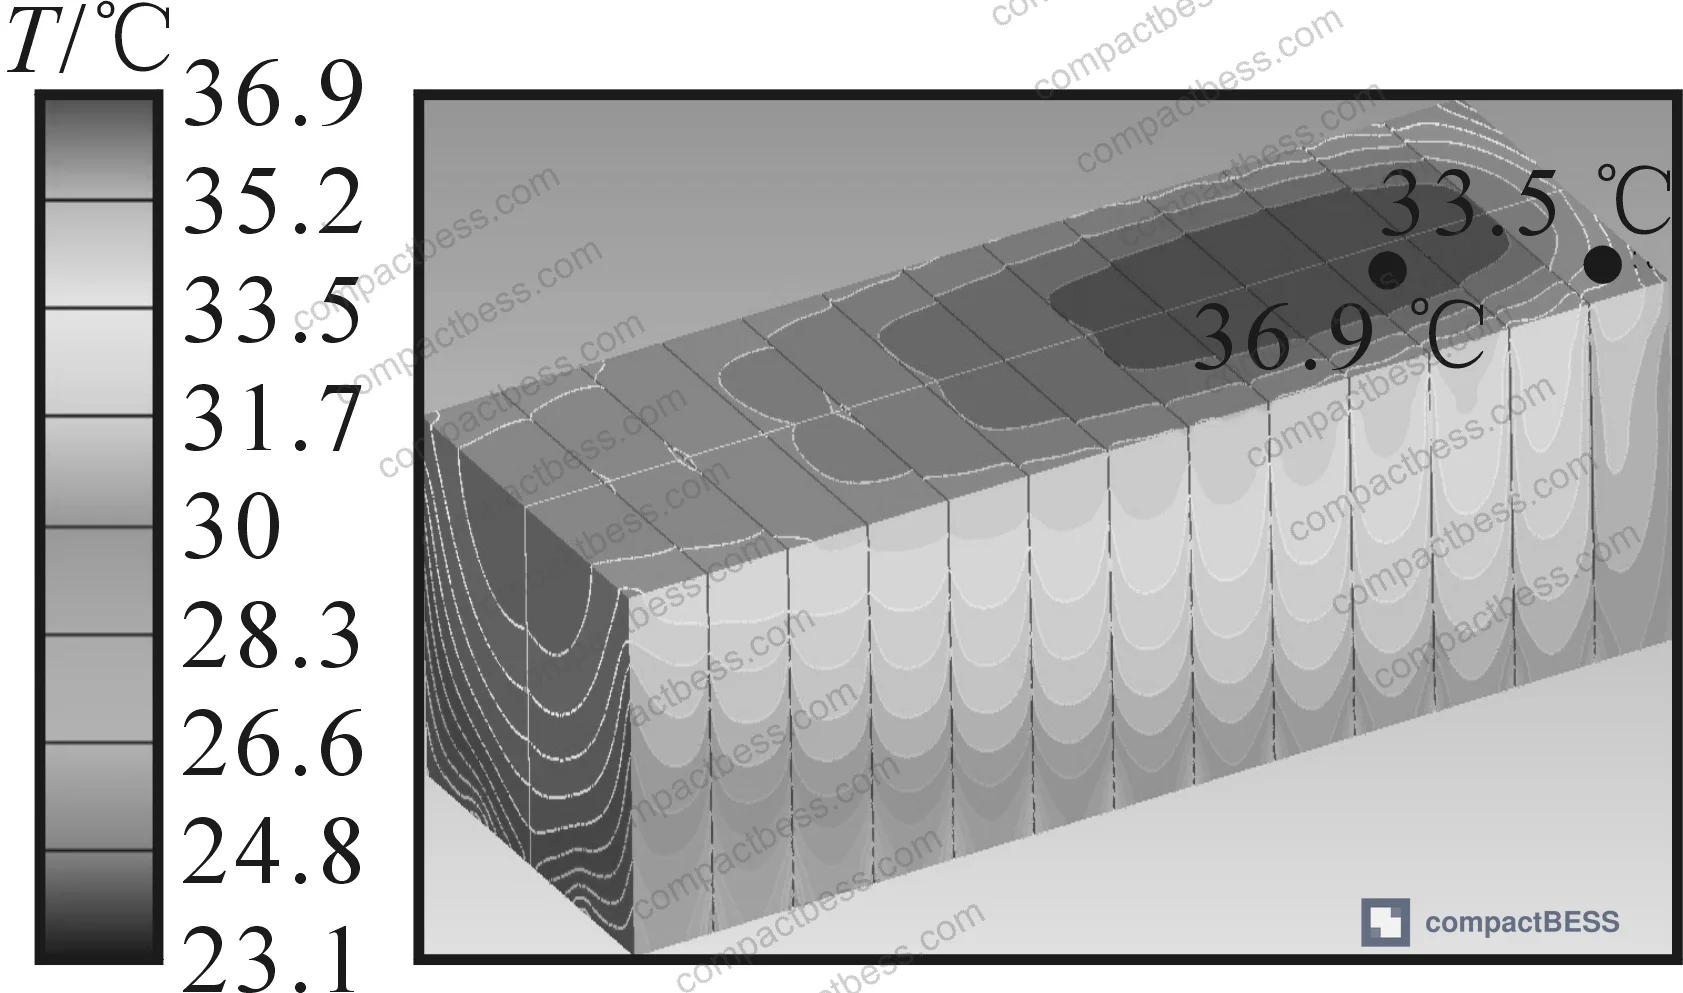
At 2.5 L·min⁻¹ per module (5 L·min⁻¹ total for the full pack), steady-state simulation showed peak cell surface temperature of 36.9 °C and a maximum inter-cell temperature differential of 3.4 °C. Both values exceed the design thresholds. The hotspot appeared at the third row of cells from the outlet — not at the outlet itself — because coolant velocity is higher near the outlet and partial radiative heat transfer to the enclosure shifts the thermal peak upstream. This is a subtle but important detail: thermal hotspot location in immersion modules does not follow simple intuition, and suppliers who cannot explain hotspot positioning relative to their flow channel geometry should raise flags.
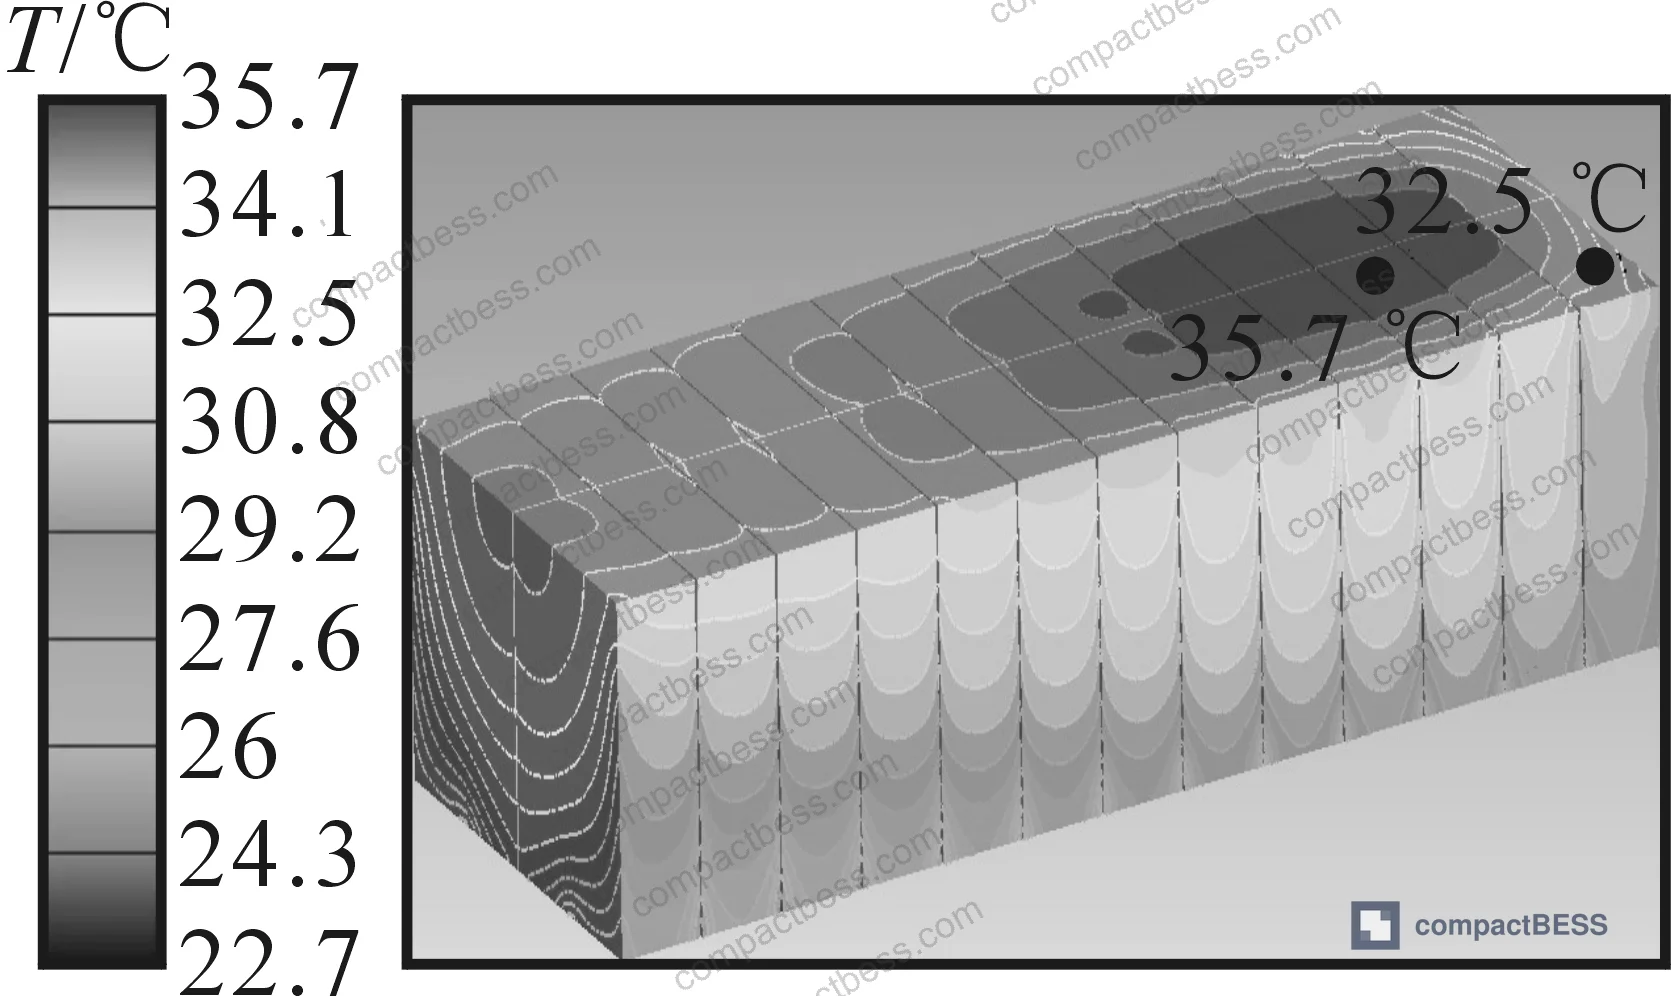
At 3 L·min⁻¹ per module (6 L·min⁻¹ total pack flow), the steady-state simulation showed peak temperature of 35.7 °C and differential of 3.2 °C — still technically outside spec, but close enough to warrant transient simulation under realistic cycling profiles.
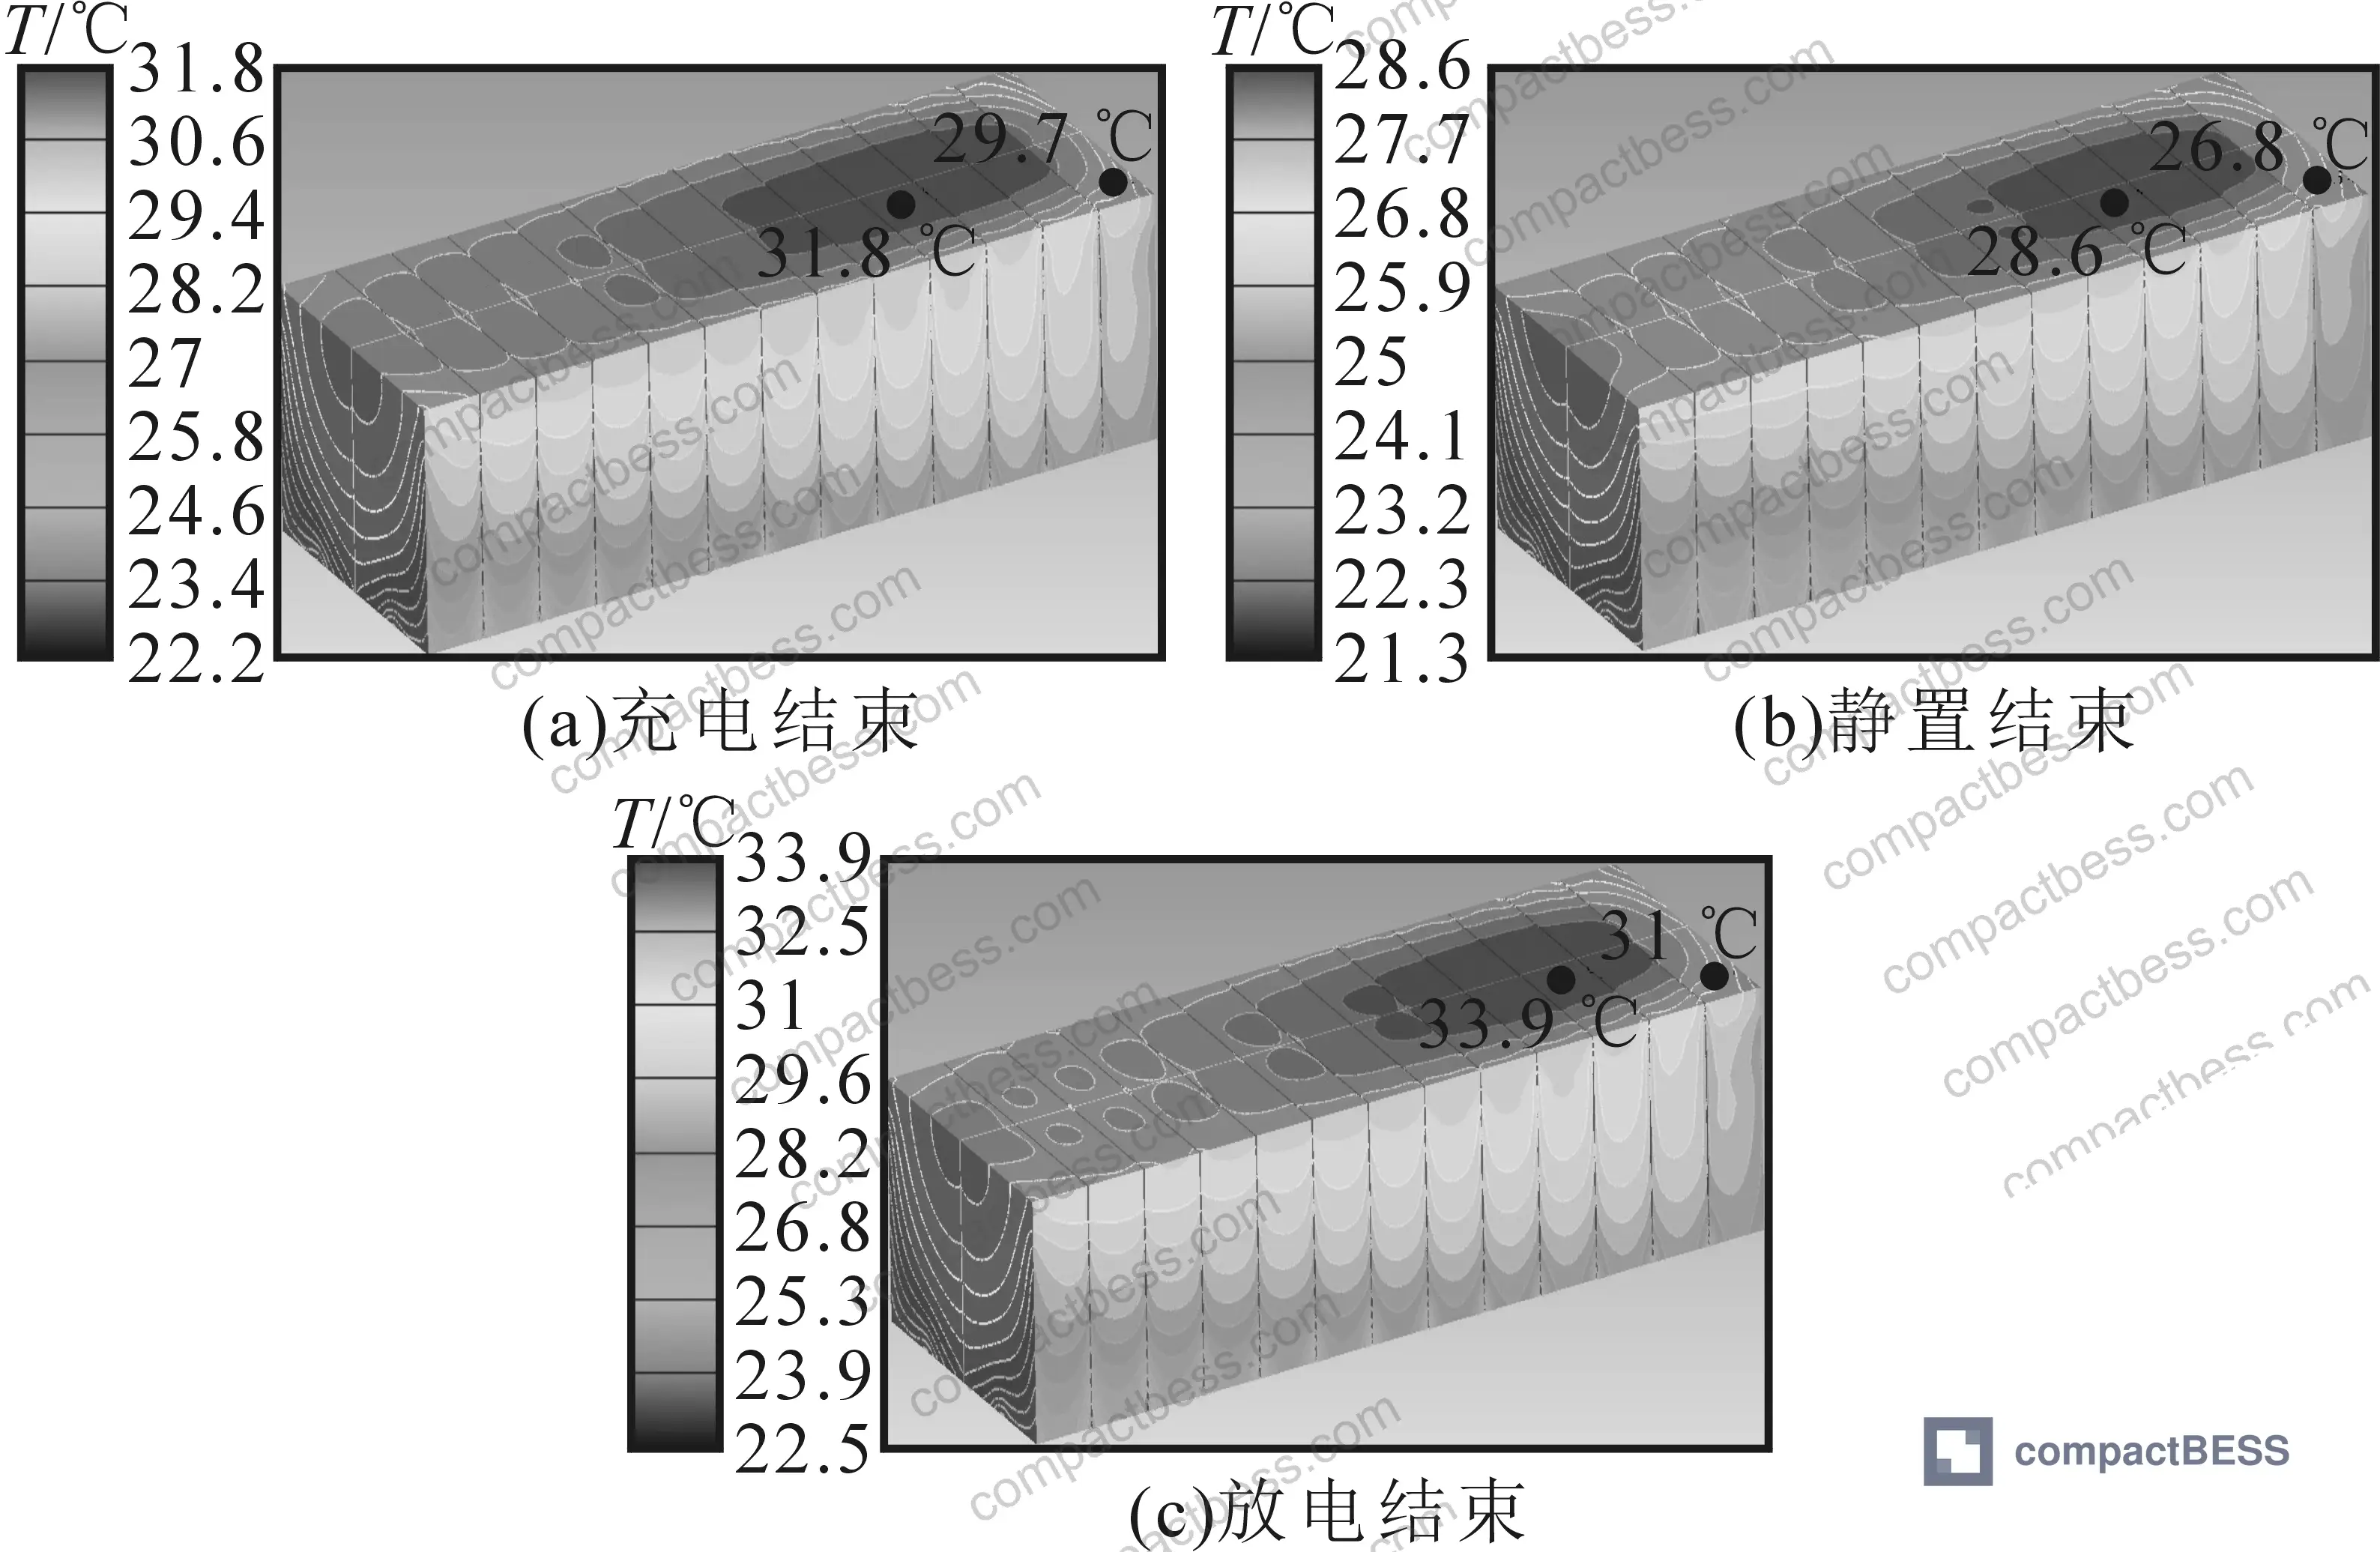
The transient simulation followed actual operating protocol: 0.5P charge for 2 hours, 30-minute rest, 0.5P discharge for 2 hours. Under these conditions at 3 L·min⁻¹, the results break down as follows:
| Operating Stage | Max Cell Surface Temp | Max Inter-Cell Differential |
|---|---|---|
| End of charge | 31.8 °C | 2.1 °C |
| End of rest period | 28.6 °C | 1.8 °C |
| End of discharge | 33.9 °C | 2.9 °C |
Discharge end-state is the thermal worst case. At 33.9 °C peak and 2.9 °C differential, the module satisfies both design requirements with a small but real margin. The inlet coolant temperature in all cases was 20 °C, and cell heat dissipation was modeled at 16.5 W per cell under 0.5P conditions.
CFD Validation Against Physical Test Data: Where the Numbers Actually Land #
In supplier qualification, we saw three of six samples fail to provide any physical test data that matched their CFD claims — the simulation files existed, but the boundary conditions had been adjusted post-hoc to fit marketing targets rather than actual hardware. This is not hypothetical. It’s a pattern. Which is why the cross-validation methodology used here is worth understanding in detail.
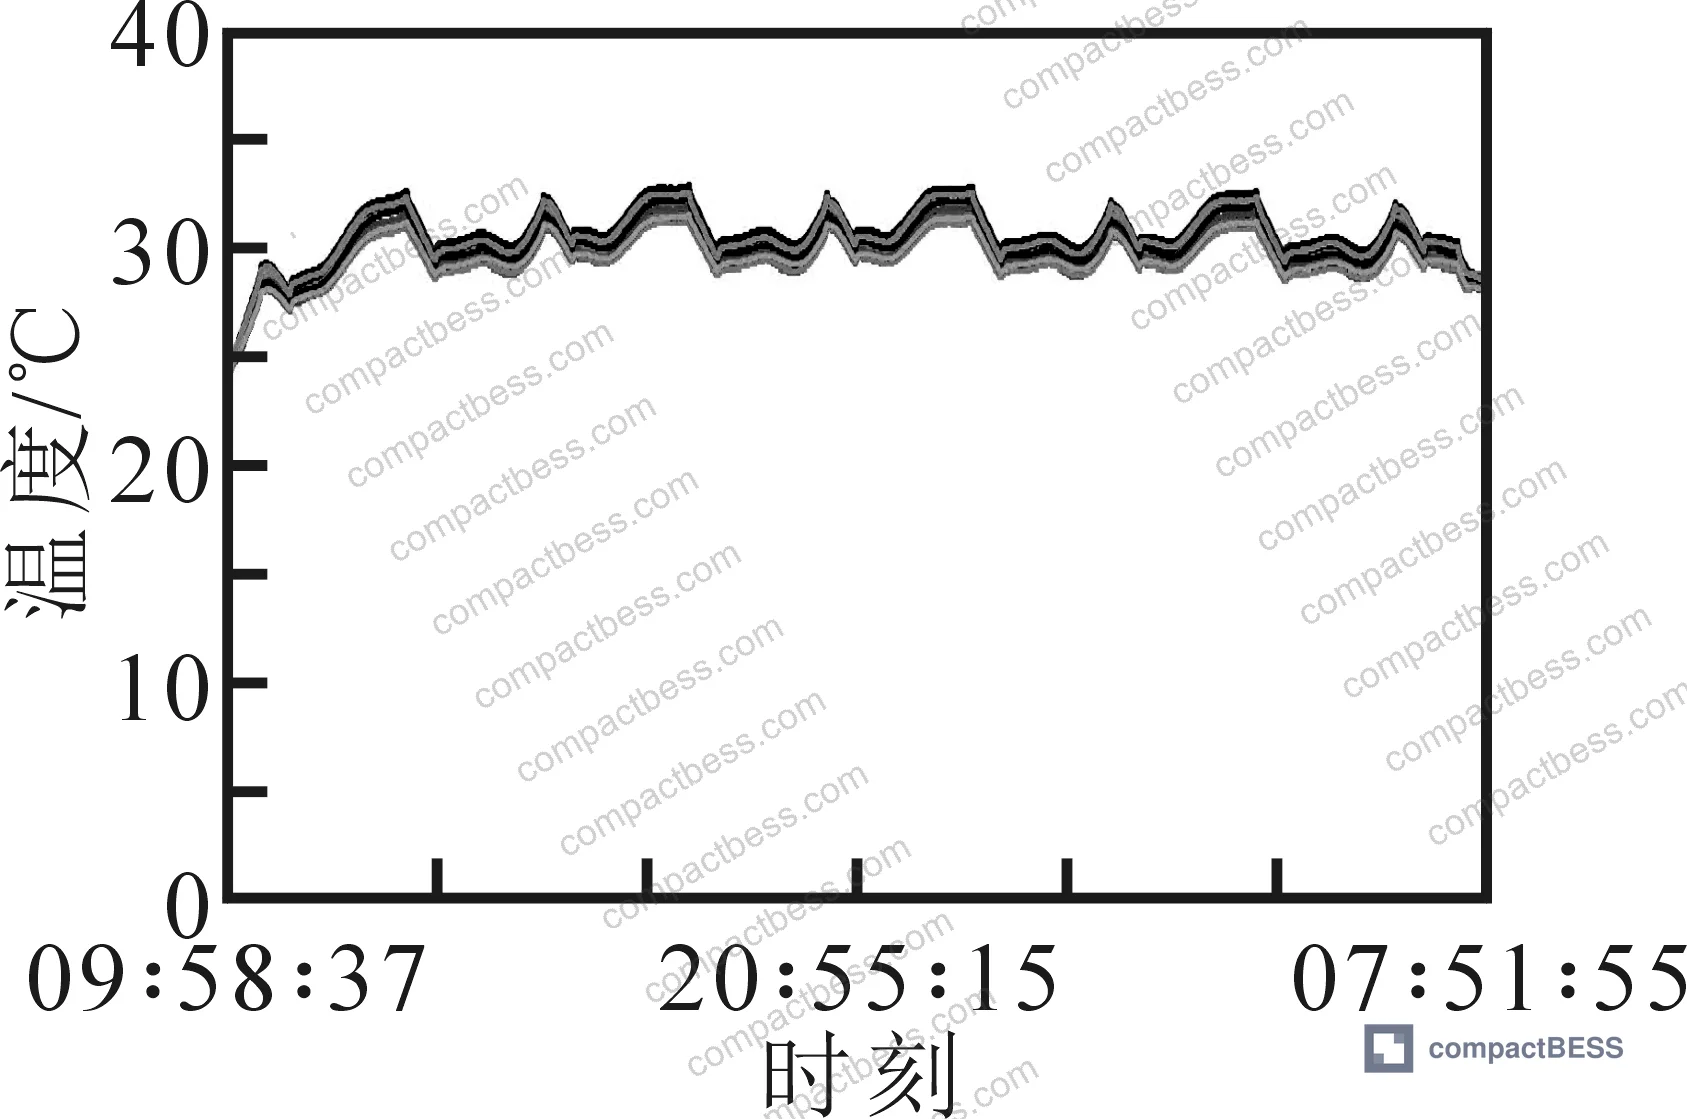
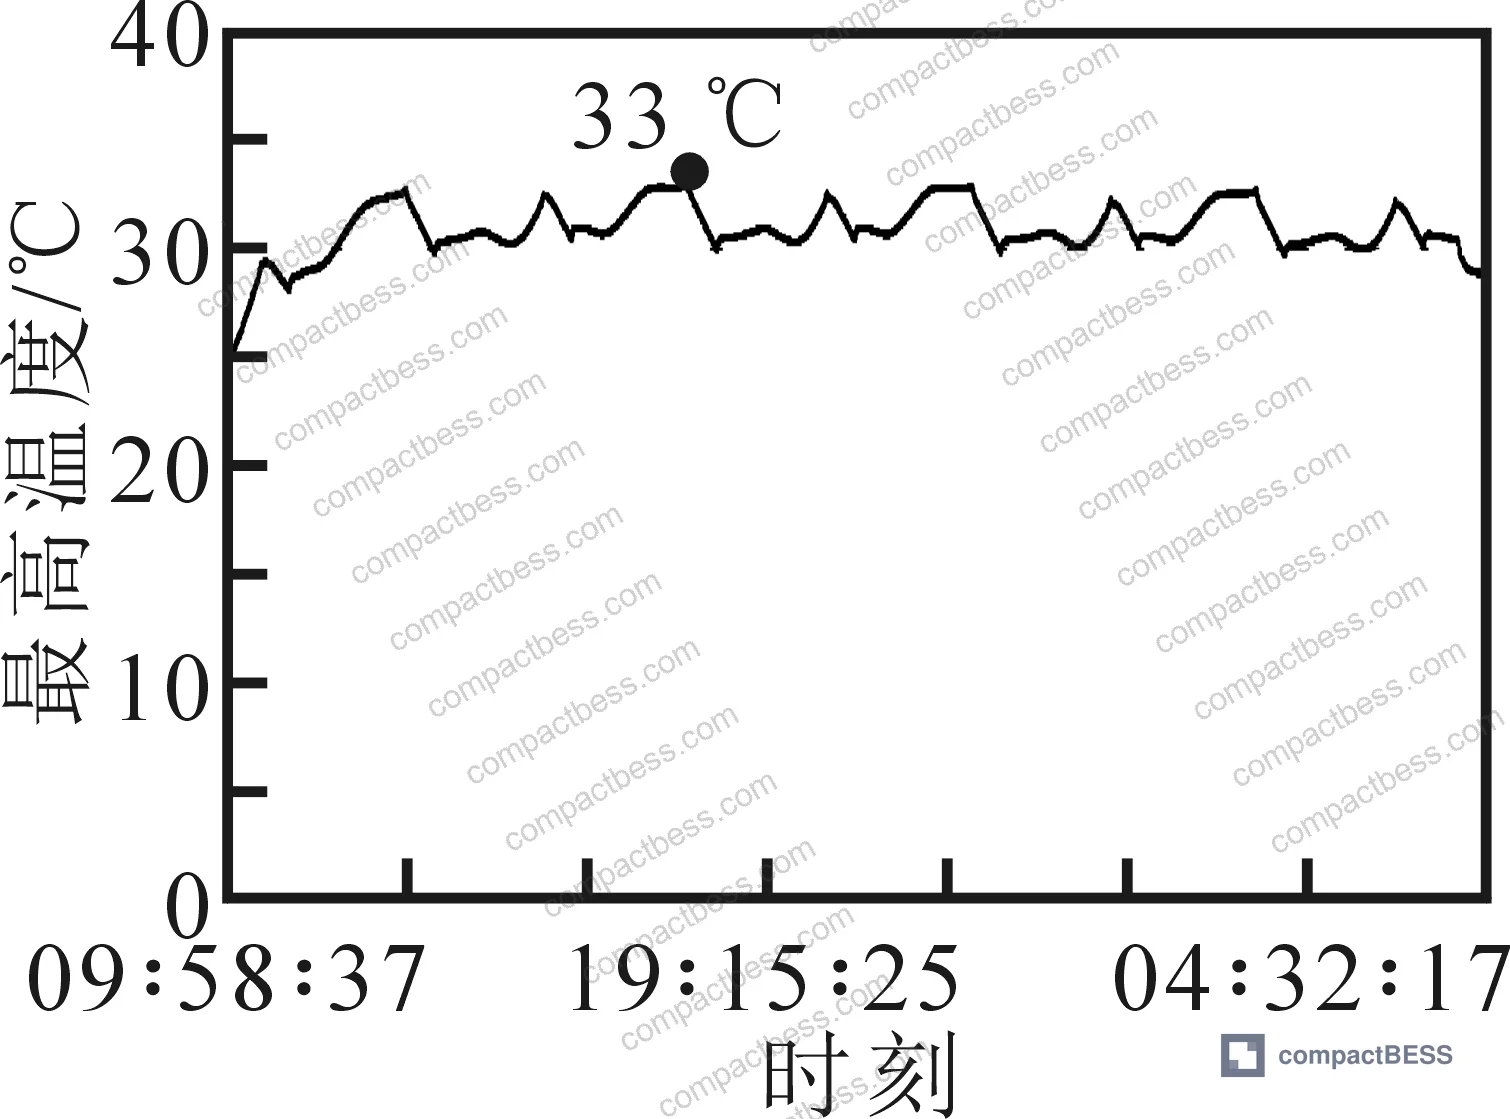
The physical prototype test used the same 1P26S configuration at 3 L·min⁻¹ per module, running four complete charge/discharge cycles under 0.5P protocol. Cell tab temperatures were monitored across all cells throughout the test. Results:
- Maximum temperature during charging (experimental): 33 °C
- Maximum temperature during discharging (experimental): 32.5 °C
- Overall peak temperature across all cycles (experimental): 33 °C
- Corresponding CFD prediction for peak temperature: 33.9 °C
- Maximum inter-cell temperature differential (experimental): 2.7 °C
- Corresponding CFD prediction for differential: 2.9 °C
The agreement between simulation and measurement is within 0.9 °C on peak temperature and 0.2 °C on differential. For a 280 Ah prismatic pack under sustained charge/discharge cycling, this level of alignment confirms that the CFD model boundary conditions were set correctly and the thermal simplification — treating each cell as a uniform heat source — did not introduce material error.
The cell parameters used in the model are also worth noting for procurement: X and Z-axis thermal conductivity of 14 W/(m·K), Y-axis thermal conductivity of 2.5 W/(m·K), and inter-cell pad thermal conductivity of 0.05 W/(m·K). That anisotropy — significantly lower conductivity in the Y-axis — is a characteristic of prismatic LFP cells and affects how heat migrates between cells. The low inter-cell pad conductivity (0.05 W/(m·K)) is a deliberate design choice to provide electrical insulation while the immersion coolant handles lateral heat removal directly.
Most procurement teams don’t realize that the transition from air-cooled to liquid-cooled BESS is now a market-wide shift, not an optional upgrade — the industry moved on wind cooling’s inability to maintain temperature uniformity at scale, and the current question is not whether to specify liquid cooling but whether to require cold-plate indirect cooling or true immersion. IEC 62619:2022 Safety requirements for secondary lithium cells and batteries now informs thermal design requirements for energy storage applications, and suppliers who haven’t updated their thermal validation protocols to reflect current safety standards are working off obsolete design margins.
Practical Guidance for Buyers #
When you’re evaluating BESS modules from Chinese manufacturers, the thermal management section of any technical package should include three things: CFD simulation results with explicit boundary conditions, physical validation data from prototype testing, and a clear statement of the flow rate and inlet temperature at which those results were obtained. If any one of those three is missing, the thermal spec is unverifiable.
The numbers in this analysis give you a concrete benchmark. For a 280 Ah LFP 1P26S immersion module at 0.5P discharge, a properly designed system should achieve peak cell temperature below 35 °C and inter-cell differential below 3 °C at a flow rate of 3 L·min⁻¹ per module with 20 °C inlet coolant. If a supplier claims better performance at lower flow rates without providing supporting data, ask for the CFD files and the test report. Specifically, ask whether the temperature differential was measured at cell tabs or at cell surfaces — these produce different readings and suppliers sometimes switch between them when results are marginal.
Honestly, most buyers over-specify inlet coolant temperature without thinking through the chiller sizing implications. Specifying 15 °C inlet when 20 °C is sufficient just adds chiller cost and complexity for no thermal benefit in most stationary applications. Similarly, demanding <2 °C temperature differential when <3 °C is validated and adequate for LFP cycle life is the kind of over-specification that adds cost without adding reliability.
For buyers sourcing stationary BESS at the module level, understanding Cycle Life & Degradation parameters in the context of operating temperature is equally critical — cell temperature uniformity directly drives capacity balance and long-term cell matching. At compactbess.com, our technical sourcing team works directly with verified Chinese manufacturers of LFP-based energy storage modules and can help you match suppliers capable of providing full thermal validation documentation with your procurement specifications.
Need help identifying qualified suppliers for immersion-cooled LFP battery modules? Talk to our sourcing team →
Supplier Qualification Questions #
- At what specific coolant flow rate (L·min⁻¹) per module does your immersion cooling design achieve maximum cell surface temperature below 35 °C and inter-cell temperature differential below 3 °C, and have you validated this at 0.5P discharge conditions?
- Can you provide both CFD simulation output files and physical prototype test data showing peak temperature agreement within ±1 °C, with boundary conditions explicitly documented including inlet coolant temperature and cell heat dissipation rate per cell?
- What are the X, Y, and Z-axis thermal conductivity values for the cells used in your module, and what is the thermal conductivity of the inter-cell isolation pads — specifically, is the inter-cell pad conductivity below 0.1 W/(m·K) to maintain electrical insulation?
- In your transient simulation or test protocol, do you run a full charge/rest/discharge cycle (e.g., 0.5P charge 2 h, 30 min rest, 0.5P discharge 2 h), and can you provide the temperature profile showing peak values at end-of-charge, end-of-rest, and end-of-discharge stages separately?
- What total mesh count was used in your CFD model for a single module, and can you confirm the model grid is sufficiently refined to resolve cell-level temperature distribution — specifically, was the mesh count in excess of 2 million elements for a 26-cell configuration?
Sourcing Checklist #
- ☐ Supplier provides CFD thermal simulation data showing peak cell surface temperature ≤35 °C at 0.5P discharge conditions with inlet coolant temperature specified at 20 °C or above
- ☐ Physical prototype test data confirms peak temperature ≤33 °C and inter-cell temperature differential ≤2.7 °C at the rated module flow rate
- ☐ CFD simulation and physical test results agree within ±1 °C on peak temperature and within ±0.3 °C on inter-cell differential
- ☐ Module coolant flow rate specification is documented in L·min⁻¹ per module, with confirmation that ≥3 L·min⁻¹ is required to meet thermal thresholds
- ☐ Immersion coolant used is confirmed to have dielectric insulation properties suitable for direct cell contact
- ☐ Cell thermal conductivity values are documented: X/Z-axis ≥14 W/(m·K), Y-axis ≥2.5 W/(m·K) for prismatic LFP cells
- ☐ Module design compliance with IEC 62619:2022 thermal safety requirements is documented
- ☐ Temperature monitoring covers all cell tab positions across full charge/discharge cycling (minimum 4 complete cycles in validation test)
Key Specifications Table #
| Parameter | Recommended Value | Verification Method |
|---|---|---|
| Maximum cell surface temperature (0.5P operation) | <35 °C | CFD transient simulation + thermocouple measurement at cell tabs during prototype testing |
| Maximum inter-cell temperature differential | <3 °C | Temperature monitoring across all cells at end-of-discharge stage |
| Coolant flow rate per module (1P26S configuration) | ≥3 L·min⁻¹ | Flow meter measurement on prototype; cross-reference with CFD boundary conditions |
| Inlet coolant temperature | 20 °C (nominal) | Chiller outlet thermometer; document in test report as boundary condition |
| Cell heat dissipation at 0.5P | 16.5 W per cell | Calorimetric measurement or validated thermal model |
| Inter-cell pad thermal conductivity | ≤0.1 W/(m·K) | Supplier material data sheet; laser flash analysis if verification required |
| CFD model mesh count (single 26-cell module) | ≥2.14 million elements | CFD preprocessing report; mesh quality metrics (skewness, aspect ratio) |
Can’t find a supplier meeting these specs? Submit your requirements and we’ll match you within 48 hours.
References #
Data source: Thermal Performance Evaluation of Modular Immersion-Cooled Battery Energy Storage Units Using CFD Simulation and Experimental Validation, T. Feng et al., Journal of the Electrochemical Society, 2024
Frequently Asked Questions #
Why does the thermal hotspot appear at the third row from the outlet rather than at the outlet itself?
Coolant velocity is actually higher immediately at the outlet, which increases local convective heat transfer. Combined with the fact that cells near the outlet also lose some heat through radiation to the enclosure walls, the net effect shifts the maximum temperature point upstream — specifically to the third row from the outlet in this configuration. This is a common misunderstanding when reviewing flow-channel layouts, and it means you cannot simply position your temperature sensors at the end of the flow path and assume you’re monitoring the worst-case location.
What is the difference between indirect cold-plate liquid cooling and direct immersion cooling for battery modules?
In indirect cold-plate designs, a metal cooling plate contacts the cell surfaces and the coolant flows through channels inside the plate, never touching the cells directly. The thermal resistance of the plate material and the cell-to-plate contact interface limits heat transfer efficiency. In direct immersion cooling, cells are submerged in a dielectric fluid that contacts the cell surfaces directly, eliminating the plate thermal resistance. The result is higher heat transfer coefficients and better temperature uniformity across a cell array. The tradeoff is that immersion systems require dielectric fluids with proven long-term chemical compatibility with cell materials — an area where supplier qualification standards are still maturing.
Is a CFD simulation result sufficient on its own to validate a module’s thermal design?
No. CFD results depend entirely on the accuracy of the boundary conditions and the simplifications made in the model. A simulation that treats each cell as a uniform heat source with ideal thermal properties will give clean-looking results even if the real hardware behaves differently. Physical prototype testing under the same operating conditions is required to confirm that the model is predictive. The acceptable benchmark from validated research is simulation-to-experiment agreement within approximately ±1 °C on peak temperature.
What operating range should a battery module maintain for safe and reliable long-term operation?
For LFP cells in stationary energy storage applications, the accepted reliable operating temperature range is −20 °C to 55 °C, with the thermal management system designed to keep cells well within this range during charging and discharging. The target for well-designed liquid-cooled systems is to keep peak operating temperature below 35 °C and temperature differential across the cell array below 3 °C. Sustained operation near the upper limit of the safe range accelerates electrolyte degradation and capacity fade. See IEC 62619:2022 and IEEE 2030.2.1 Guide for Design, Operation, and Maintenance of Battery Energy Storage Systems for temperature-related safety and performance requirements.
How should buyers evaluate thermal validation documentation from Chinese BESS suppliers?
Ask for the CFD report with boundary conditions explicitly listed, the prototype test report with sensor placement diagrams, and a side-by-side comparison of simulation vs. measured values. Specifically look for whether peak temperature and inter-cell differential are reported separately for charging and discharging stages — a supplier that only reports steady-state average temperature is not providing the data you need. Also confirm that physical testing covered at least four complete charge/discharge cycles, as single-cycle results can understate thermal accumulation effects. For transport safety context, UN 38.3 Recommendations on the Transport of Dangerous Goods — Lithium Battery Testing and UL 9540A Test Method for Evaluating Thermal Runaway Fire Propagation are also relevant certification benchmarks when qualifying suppliers for regulated markets.
Published by compactbess.com Technical Team | Request a sourcing quote


