

TL;DR #
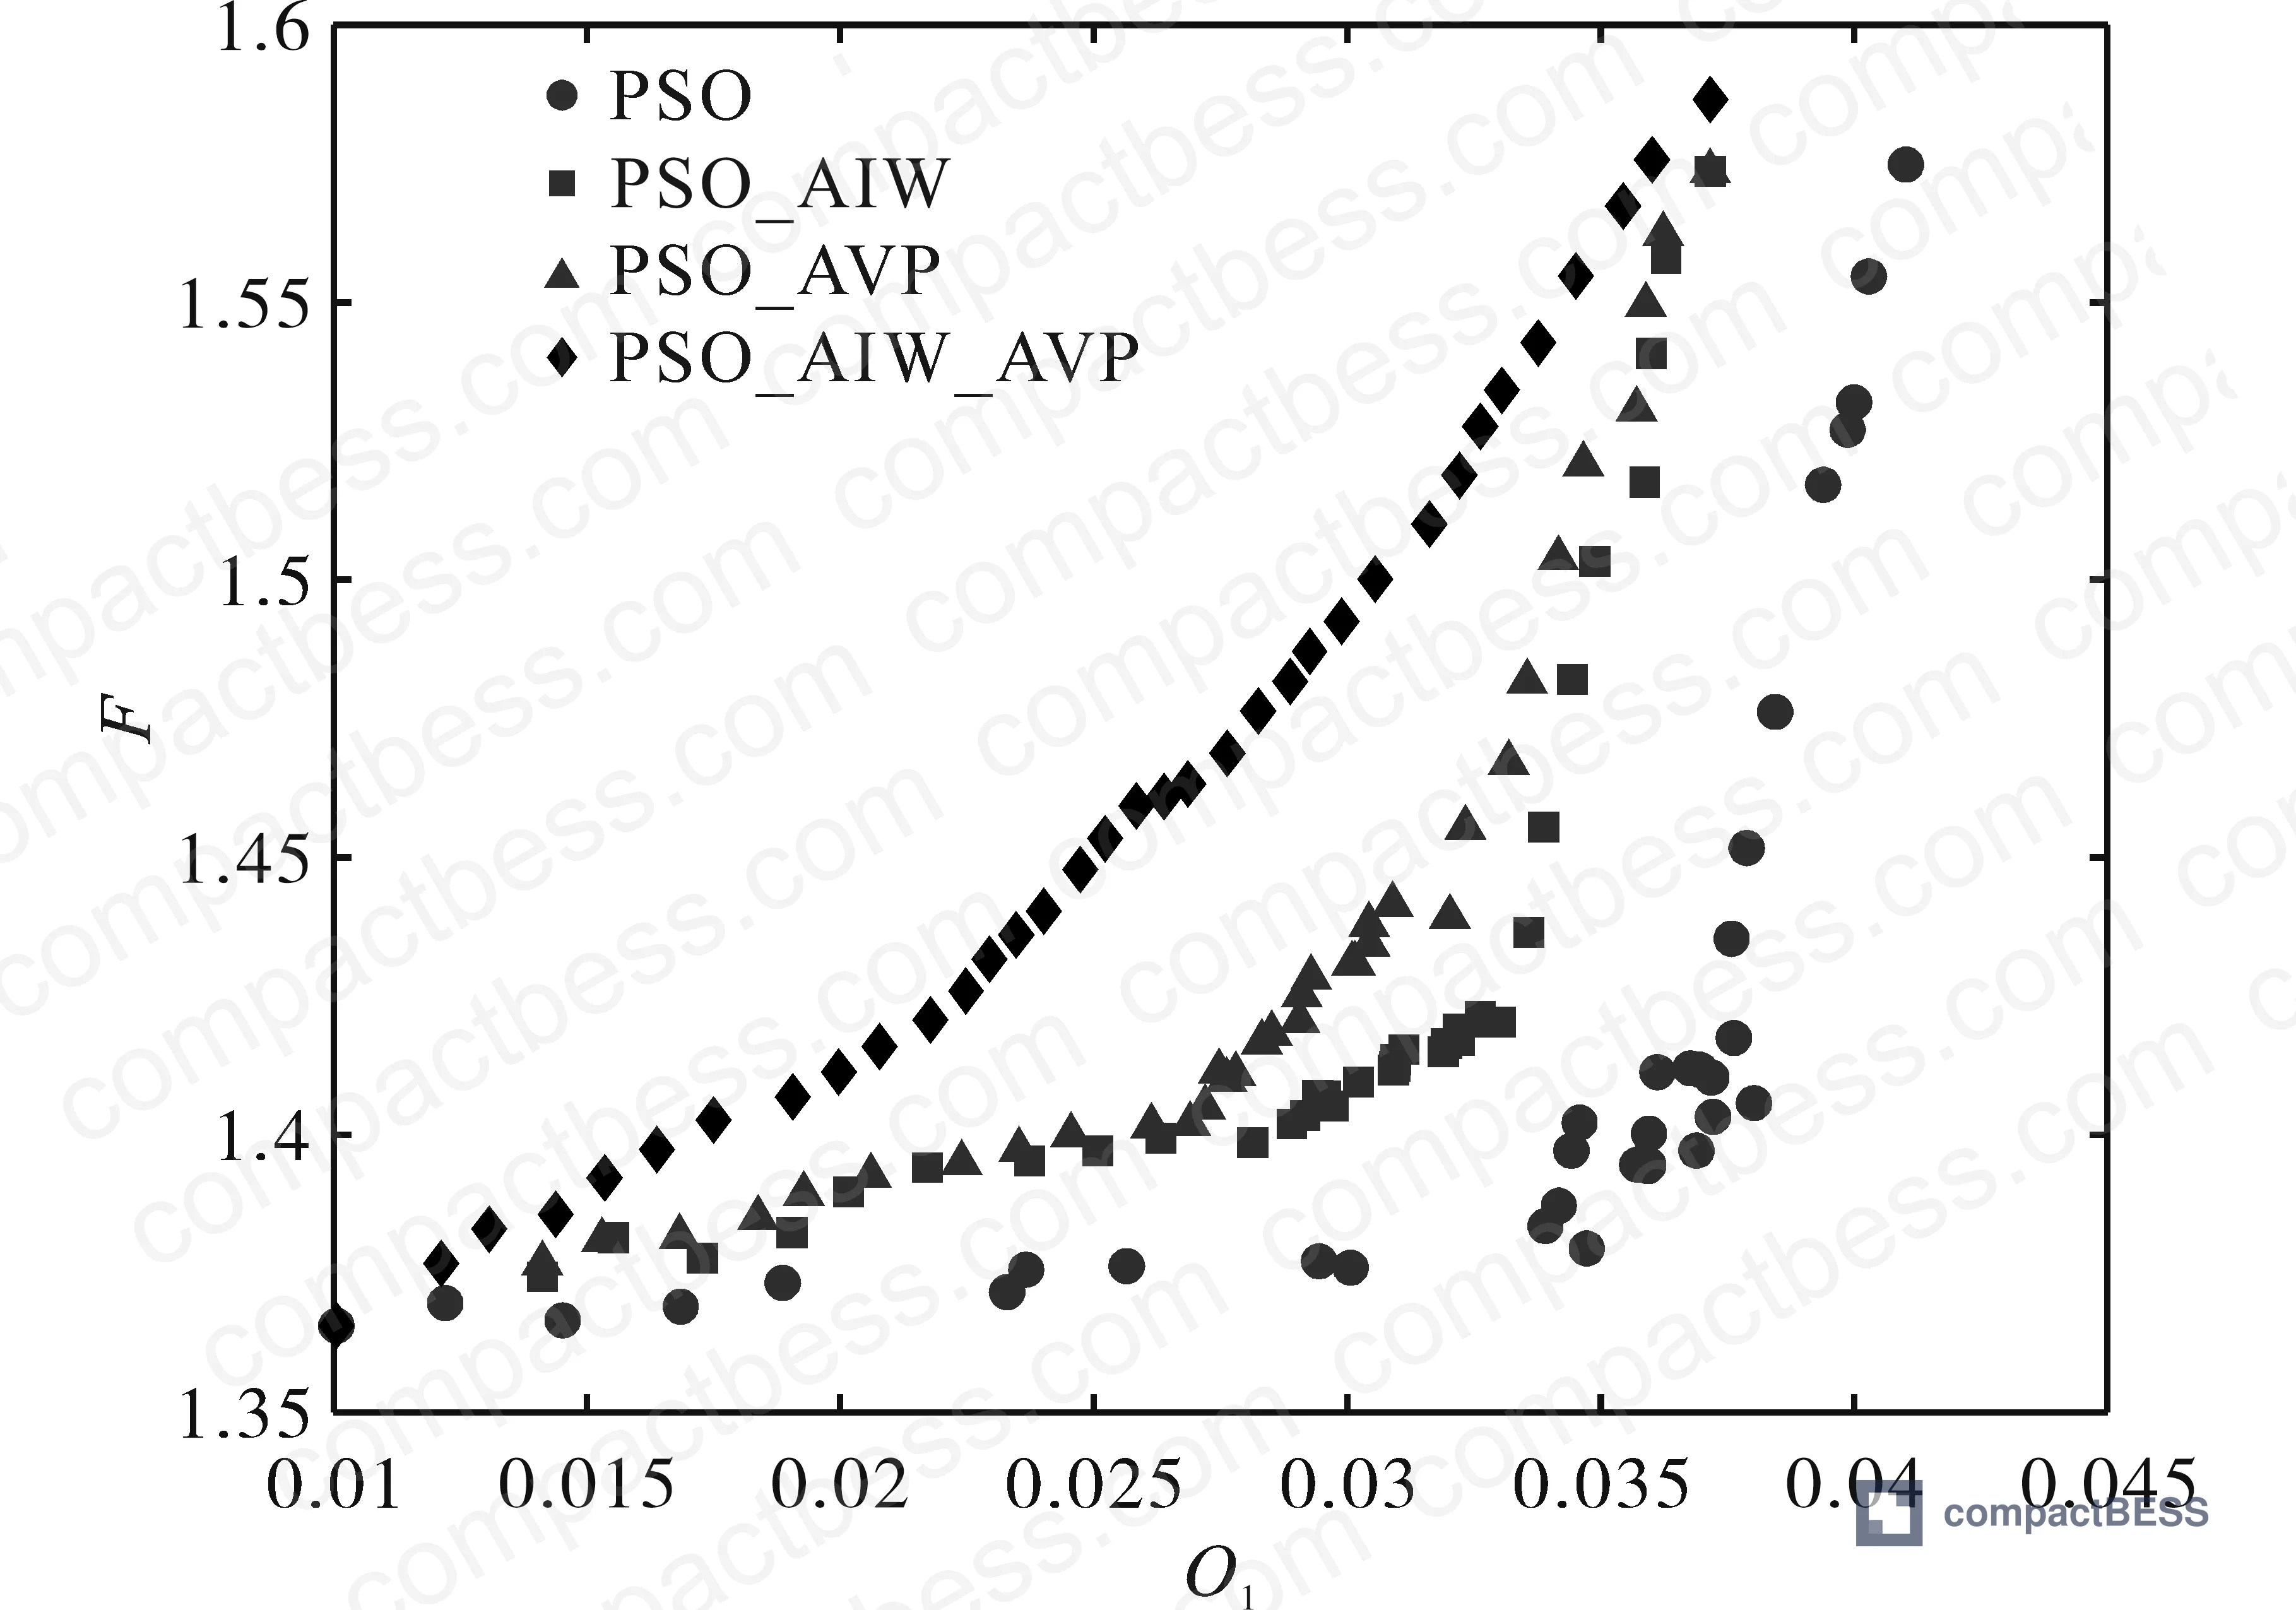
A validated dual adaptive PSO optimization framework demonstrates that a 10.03 MW / 2.41 MW·h LFP battery energy storage system achieves the best balance between primary frequency regulation performance and annualized net return, outperforming standard PSO by reducing the frequency deviation index O1 by 27.78% and increasing annualized net benefit by 4.59%. For procurement engineers sizing grid-scale BESS for frequency regulation applications, this means that LFP chemistry with a power-to-energy ratio near 4:1 (MW:MW·h) is not just technically sound — it is economically optimal when the full lifecycle cost model is applied. Before issuing any RFQ for utility-scale LFP storage modules, confirm that your supplier can support SOC window management with configurable charge/discharge threshold parameters (Qsoc,l and Qsoc,h), as this directly controls the battery’s ability to sustain regulation duty without over-charge or over-discharge penalties.
Overview #
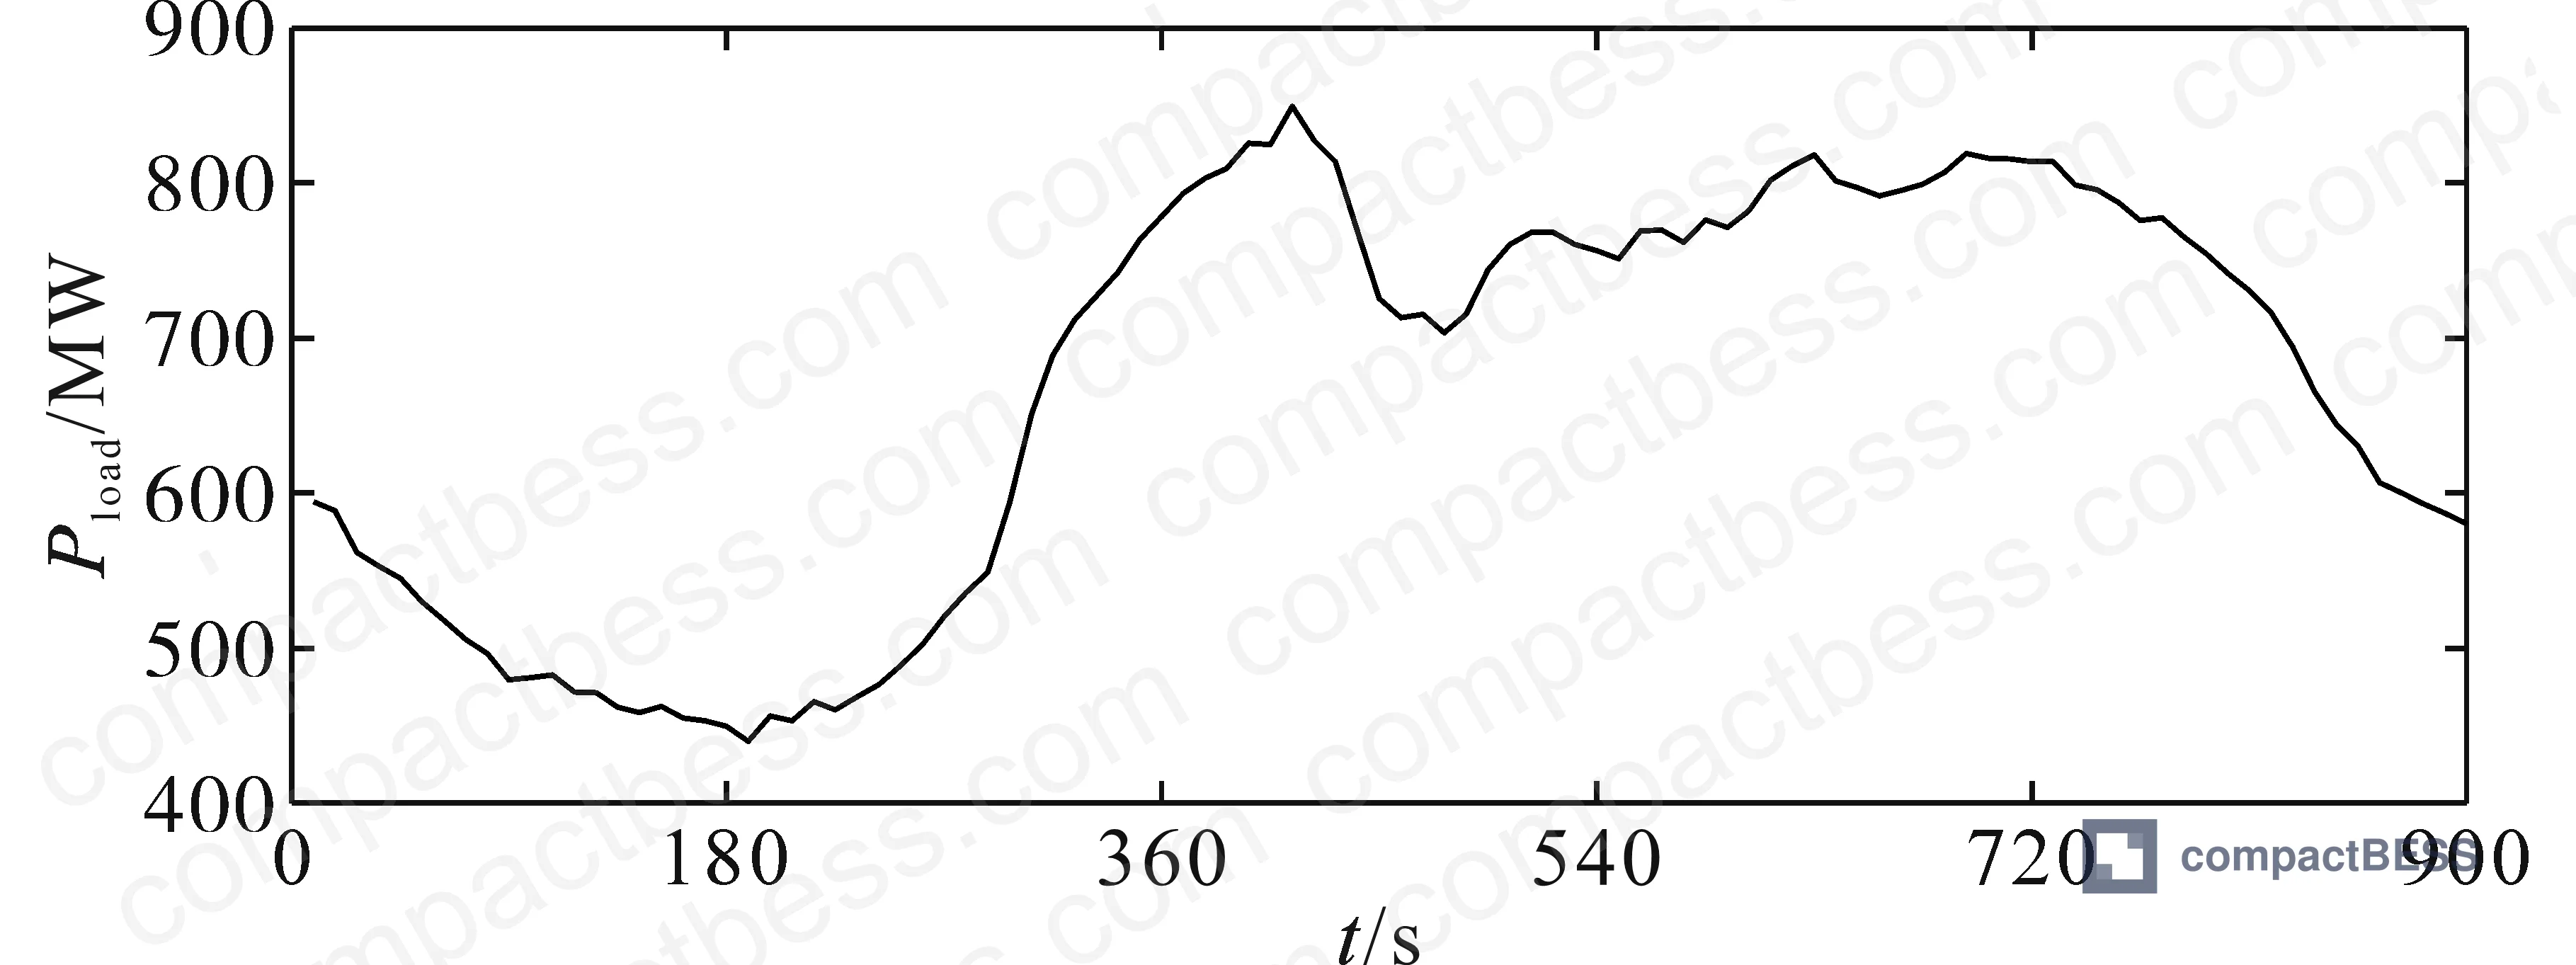
Procurement teams evaluating battery energy storage systems for grid frequency regulation often focus on headline specifications — rated power, cycle life, round-trip efficiency — while underestimating how deeply the capacity sizing methodology affects both regulation performance and long-term economics. The analysis discussed here is drawn from a controlled simulation study conducted using real wind farm output data from a regional grid environment, where a 50 MW wind power installation was paired with an LFP-based BESS against a 250 MW grid base capacity. The study evaluated 1-second sampling resolution across 15-minute frequency regulation windows, running a population of 30 optimization particles over 100 iterations to converge on the optimal configuration — giving the results a level of resolution most simplified sizing tools cannot match.
The findings are directly actionable. The optimal BESS configuration — 10.03 MW rated power and 2.41 MW·h rated capacity — was derived not by guessing or applying a rule-of-thumb multiplier, but through multi-objective optimization that simultaneously minimized frequency deviation and maximized a 20-year lifecycle annualized net return model. For buyers sourcing LFP cell packs, BMS modules, or complete BESS assemblies destined for grid support applications, the implication is clear: undersizing the energy capacity relative to rated power leaves regulation income on the table, while oversizing it drives up lifecycle cost without proportional frequency performance gains.
The lifecycle economic model accounts for six cost categories: initial capital investment, operations and maintenance, equipment replacement, decommissioning, curtailed wind penalty costs, and power deficit penalty costs — a structure that reflects how utility procurement teams should be evaluating total cost of ownership rather than unit price per kWh.
Most procurement teams don’t realize that Lifecycle Economic Model Parameters #
The 20-year lifecycle model used in this evaluation applied the following key cost parameters (all expressed per MW or MW·h):
- LFP unit capacity investment cost (Cee): $385,000/MW·h
- LFP unit power investment cost (Cpe): $230,000/MW
- Annual O&M cost per MW·h (Ceo): $10,000/MW·h
- Annual O&M cost per MW (Cpo): $10,000/MW
- Decommissioning cost per MW·h (Cedis): $1,000/MW·h
- Wind curtailment penalty coefficient (Ceaw): $42/MW·h
- Power deficit penalty coefficient (Cesho): $17/MW·h
- Electricity sale price (rsell): $75/MW·h
- Discount rate (u): 6%
These parameters were drawn from a real grid operator cost structure in a northwest China regional grid context. For buyers in North American or European markets, the capital cost figures are broadly comparable for utility-scale LFP (current market pricing for large-format LFP cell packs sits in a range that makes the $385,000/MW·h figure defensible at current system-level pricing), though O&M and decommissioning costs will vary by jurisdiction.
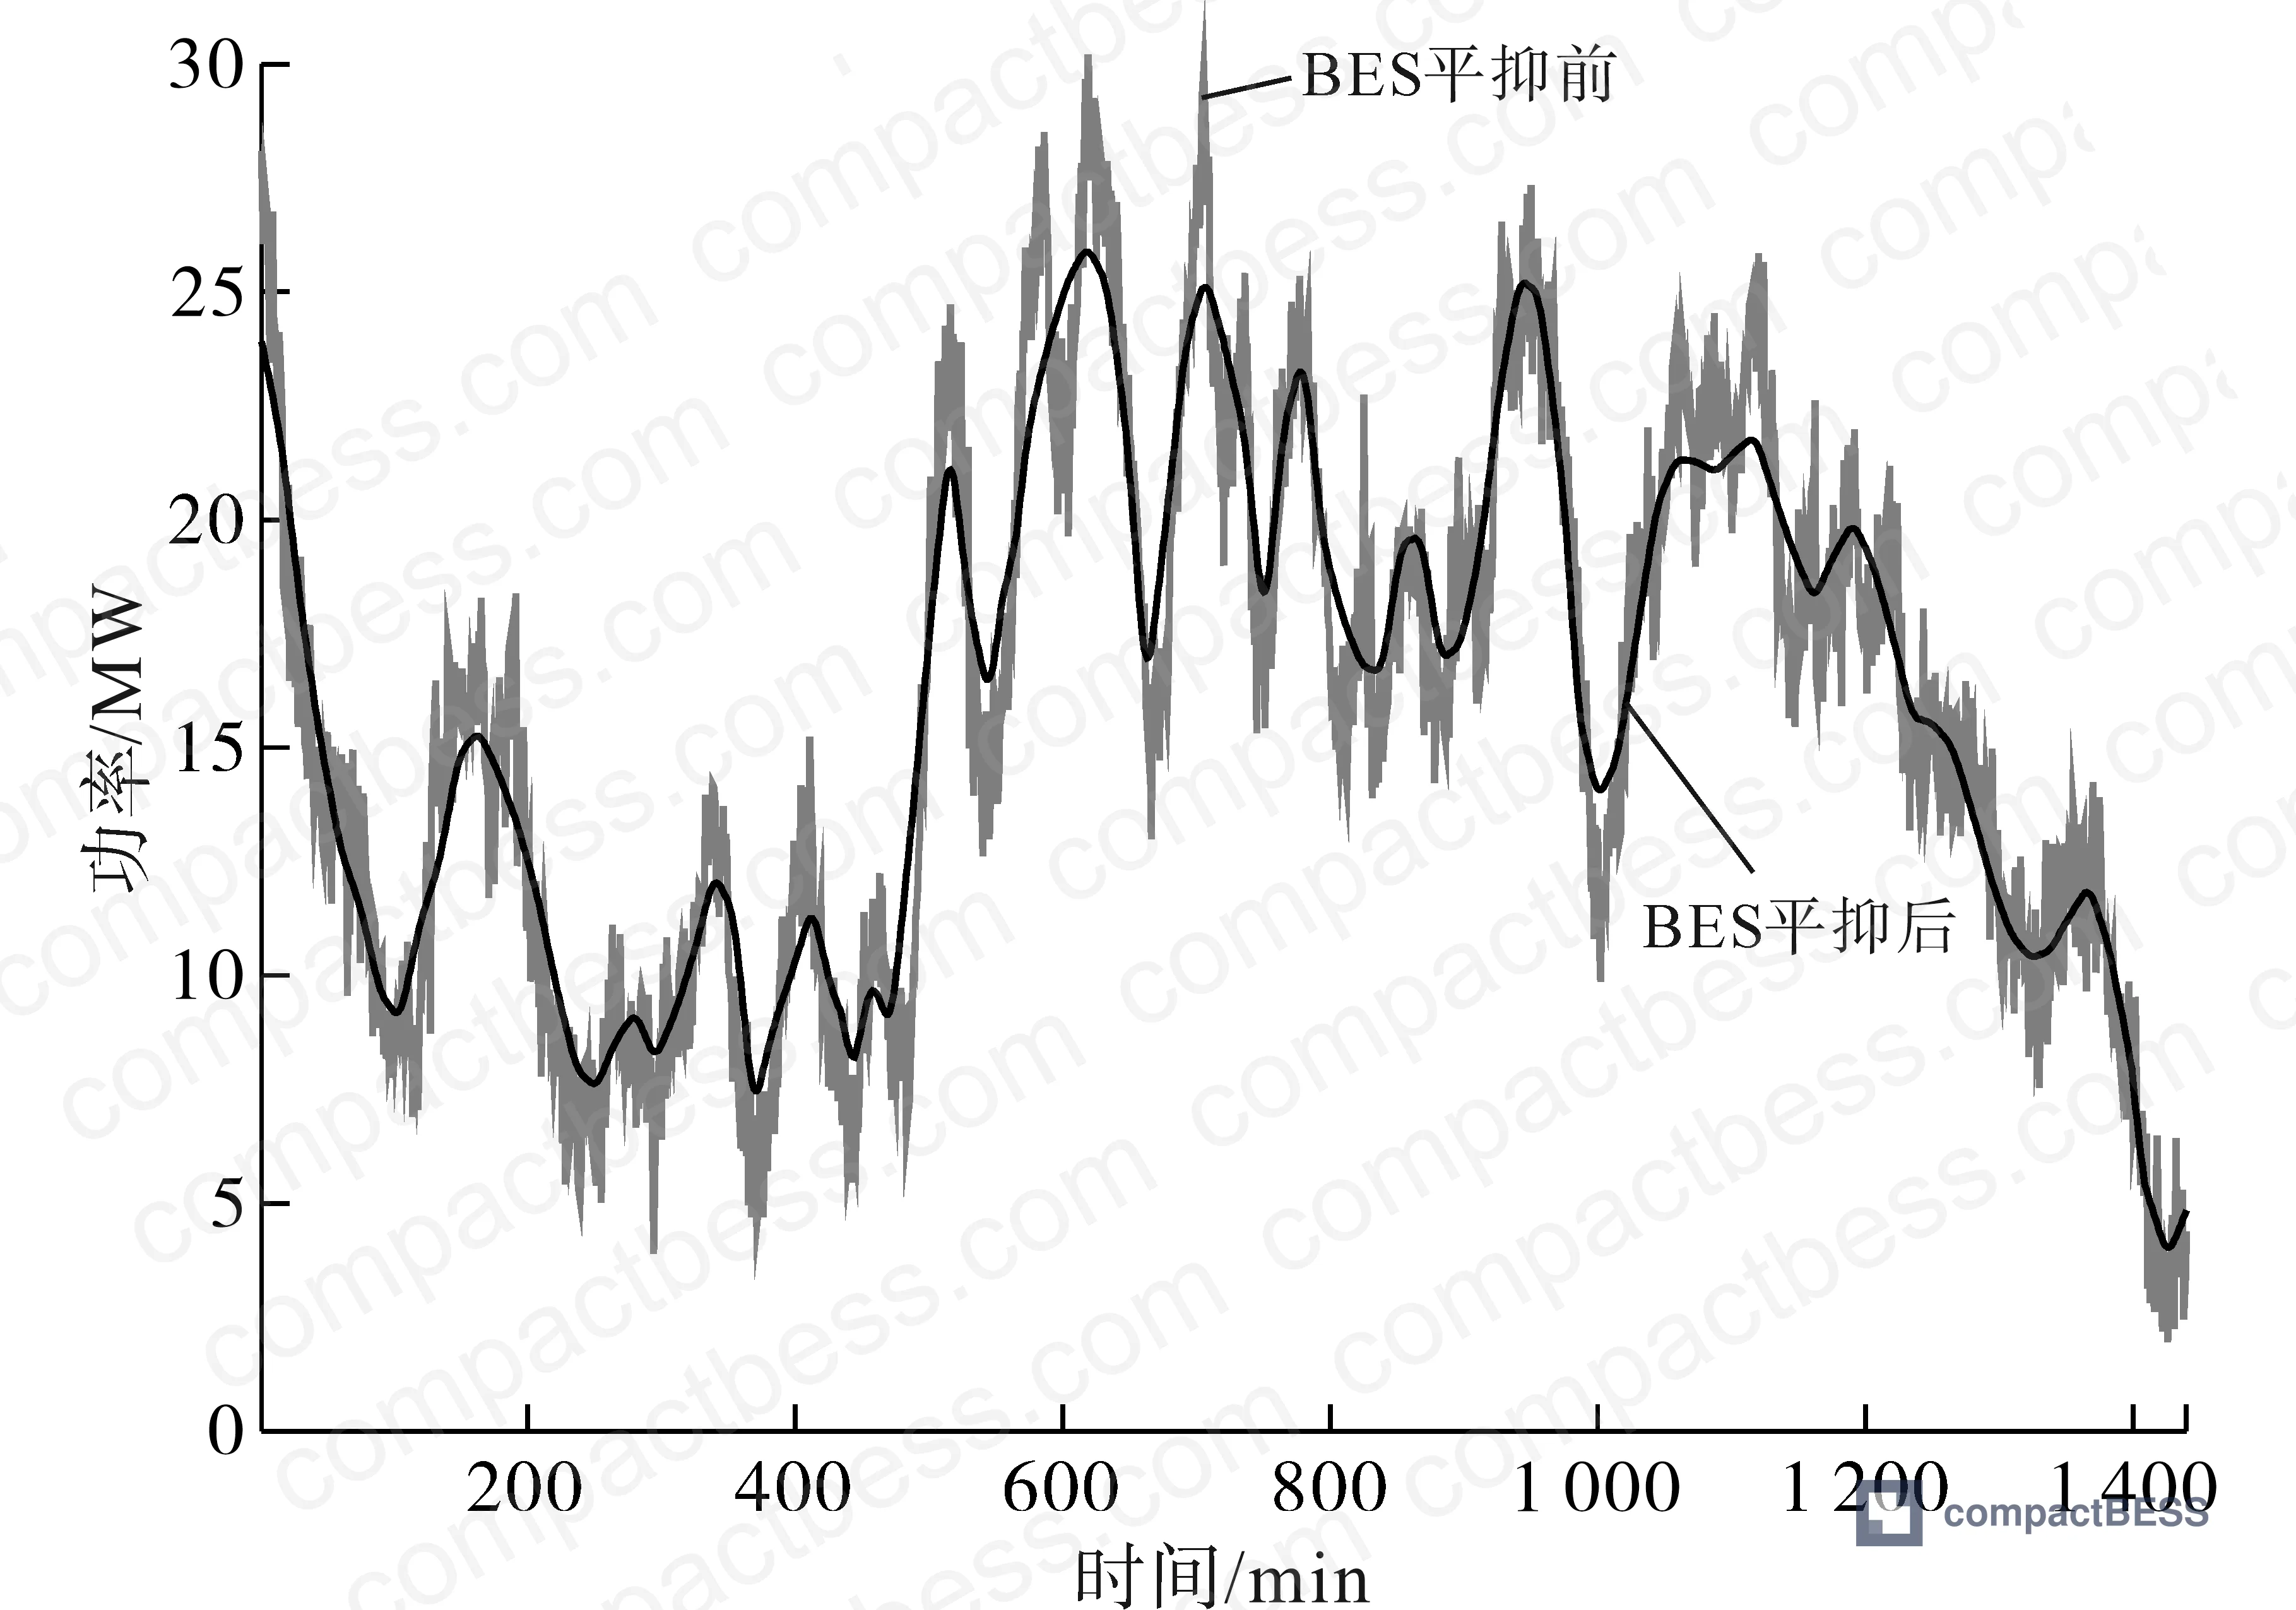
Wind Power Smoothing Performance: 1,440-Point Validation #
Beyond primary frequency regulation, the optimized BES configuration was also validated for wind power output smoothing over a 24-hour period with 1-minute sampling intervals — 1,440 data points in total. Post-BES smoothing results showed that high-frequency power fluctuations from the wind farm output were substantially attenuated, enabling the wind farm to approach the stable output profile required for grid compliance.
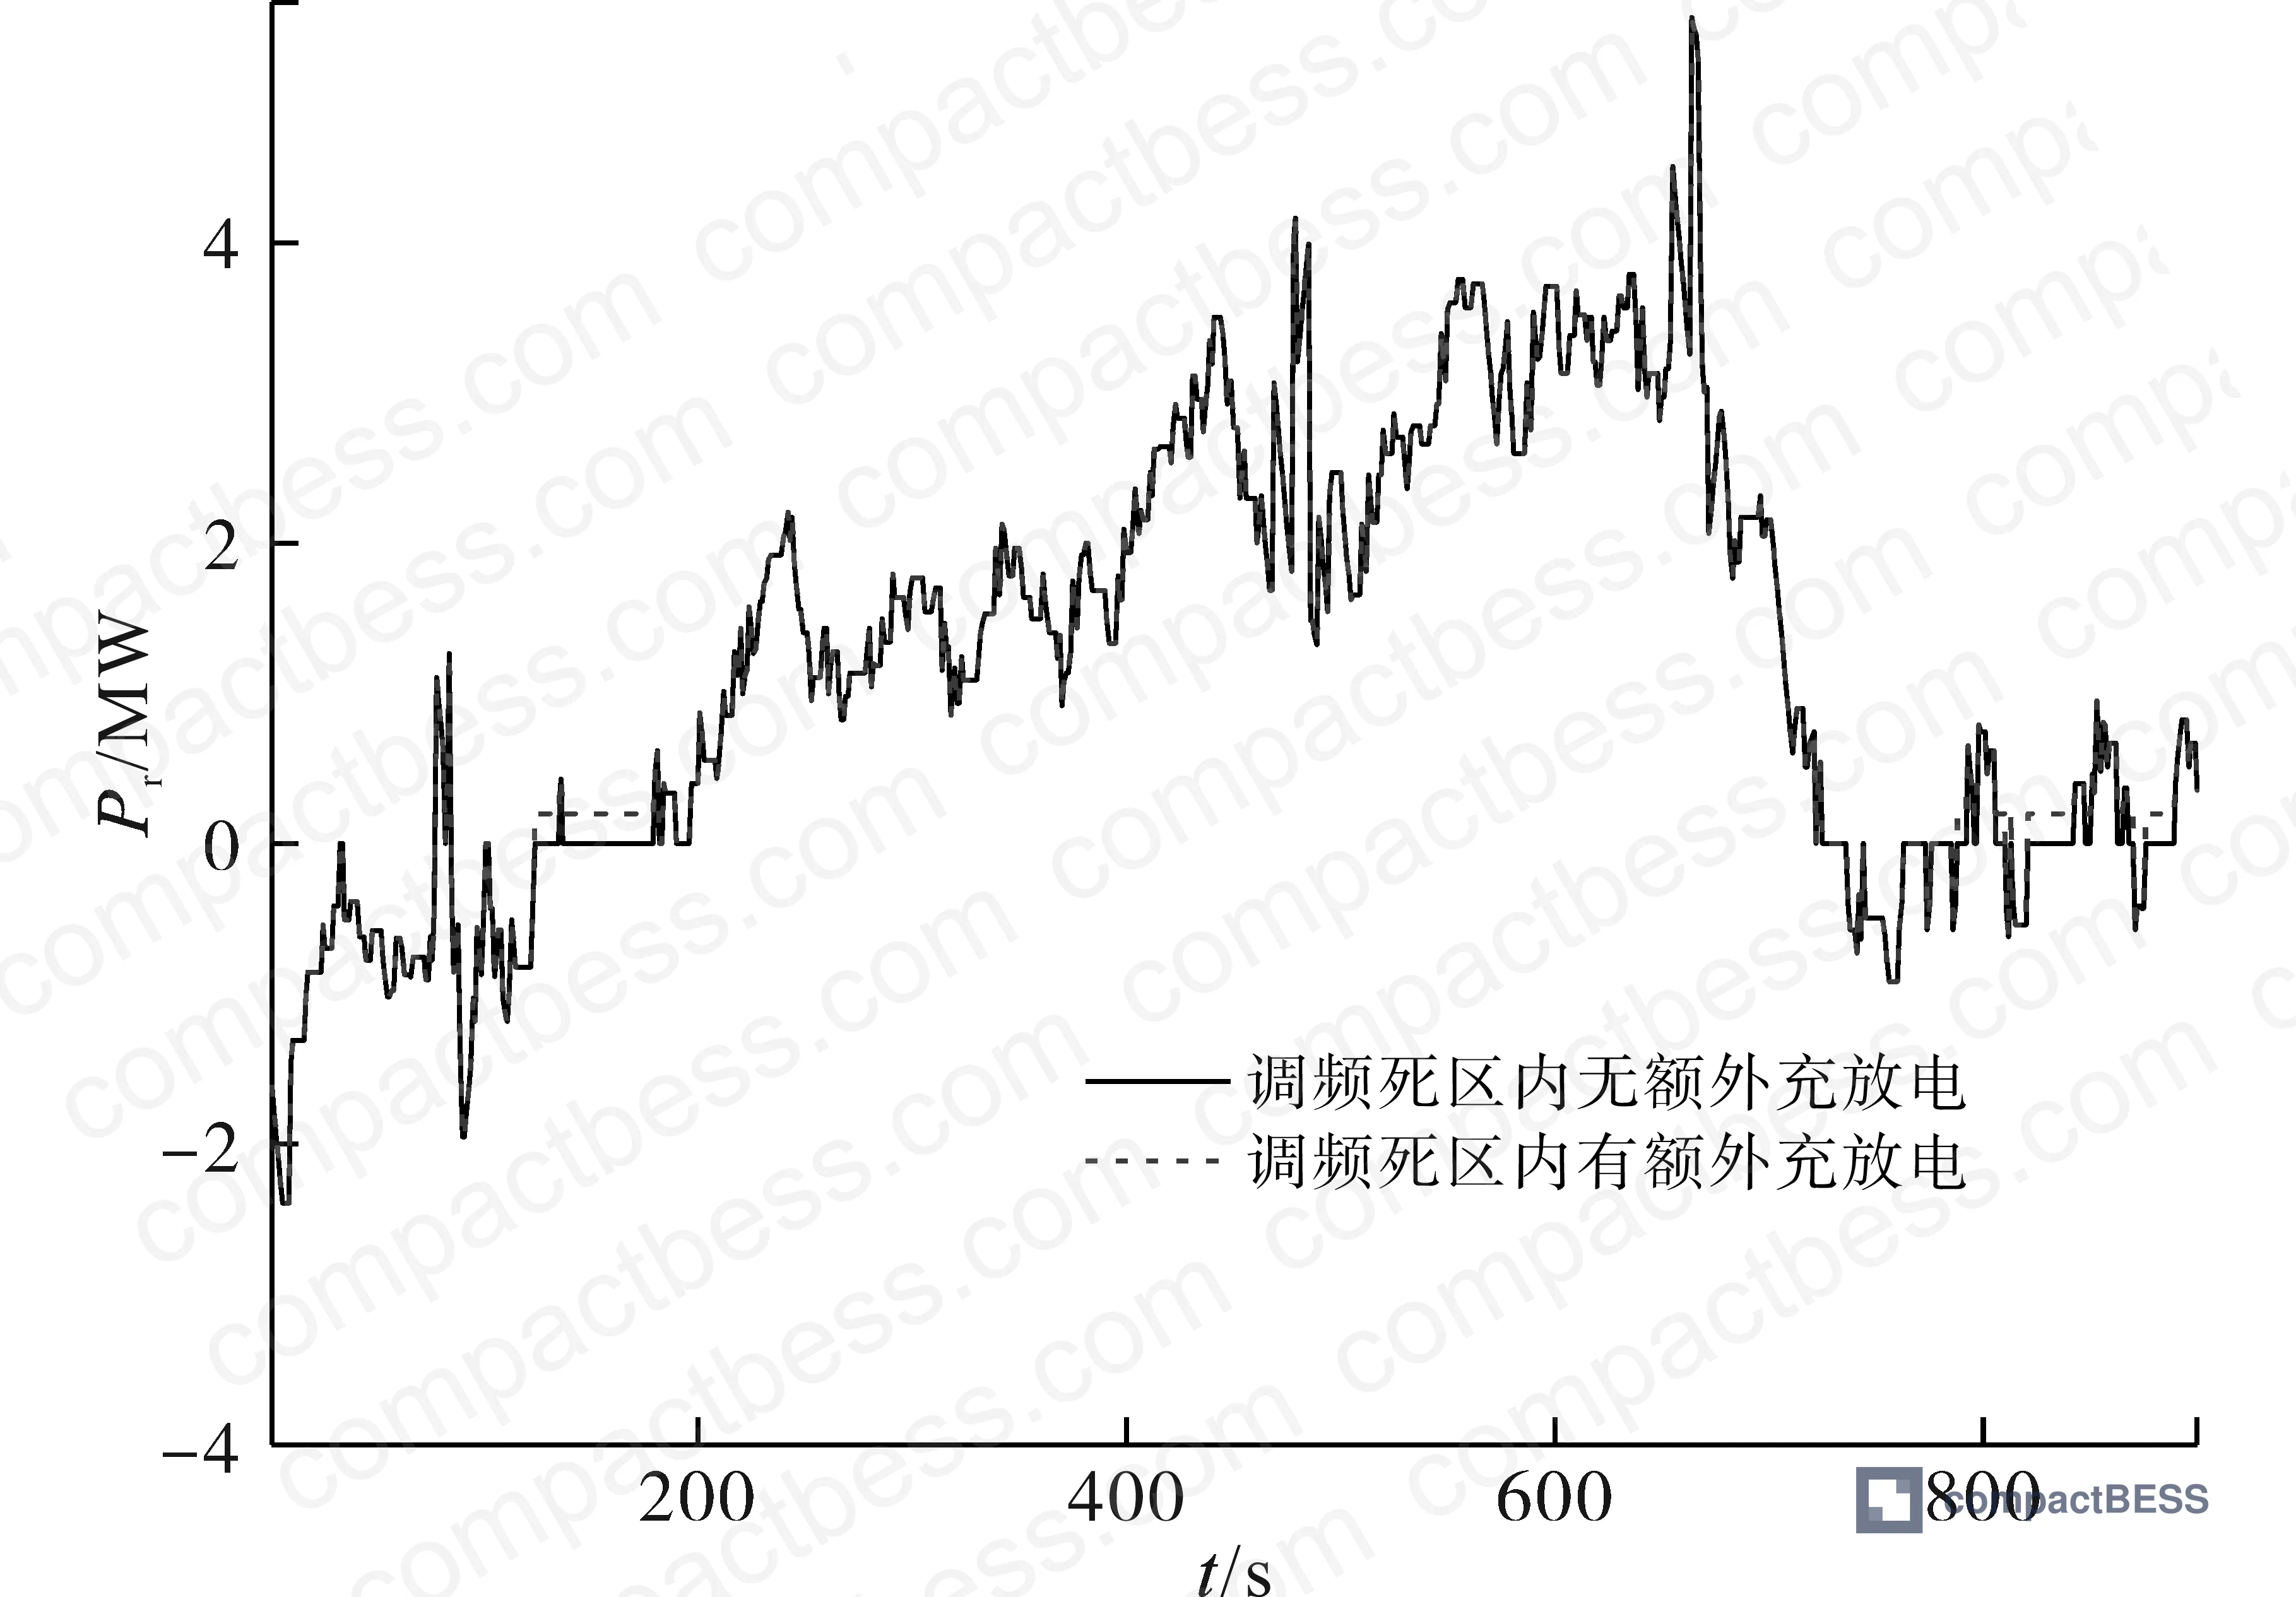
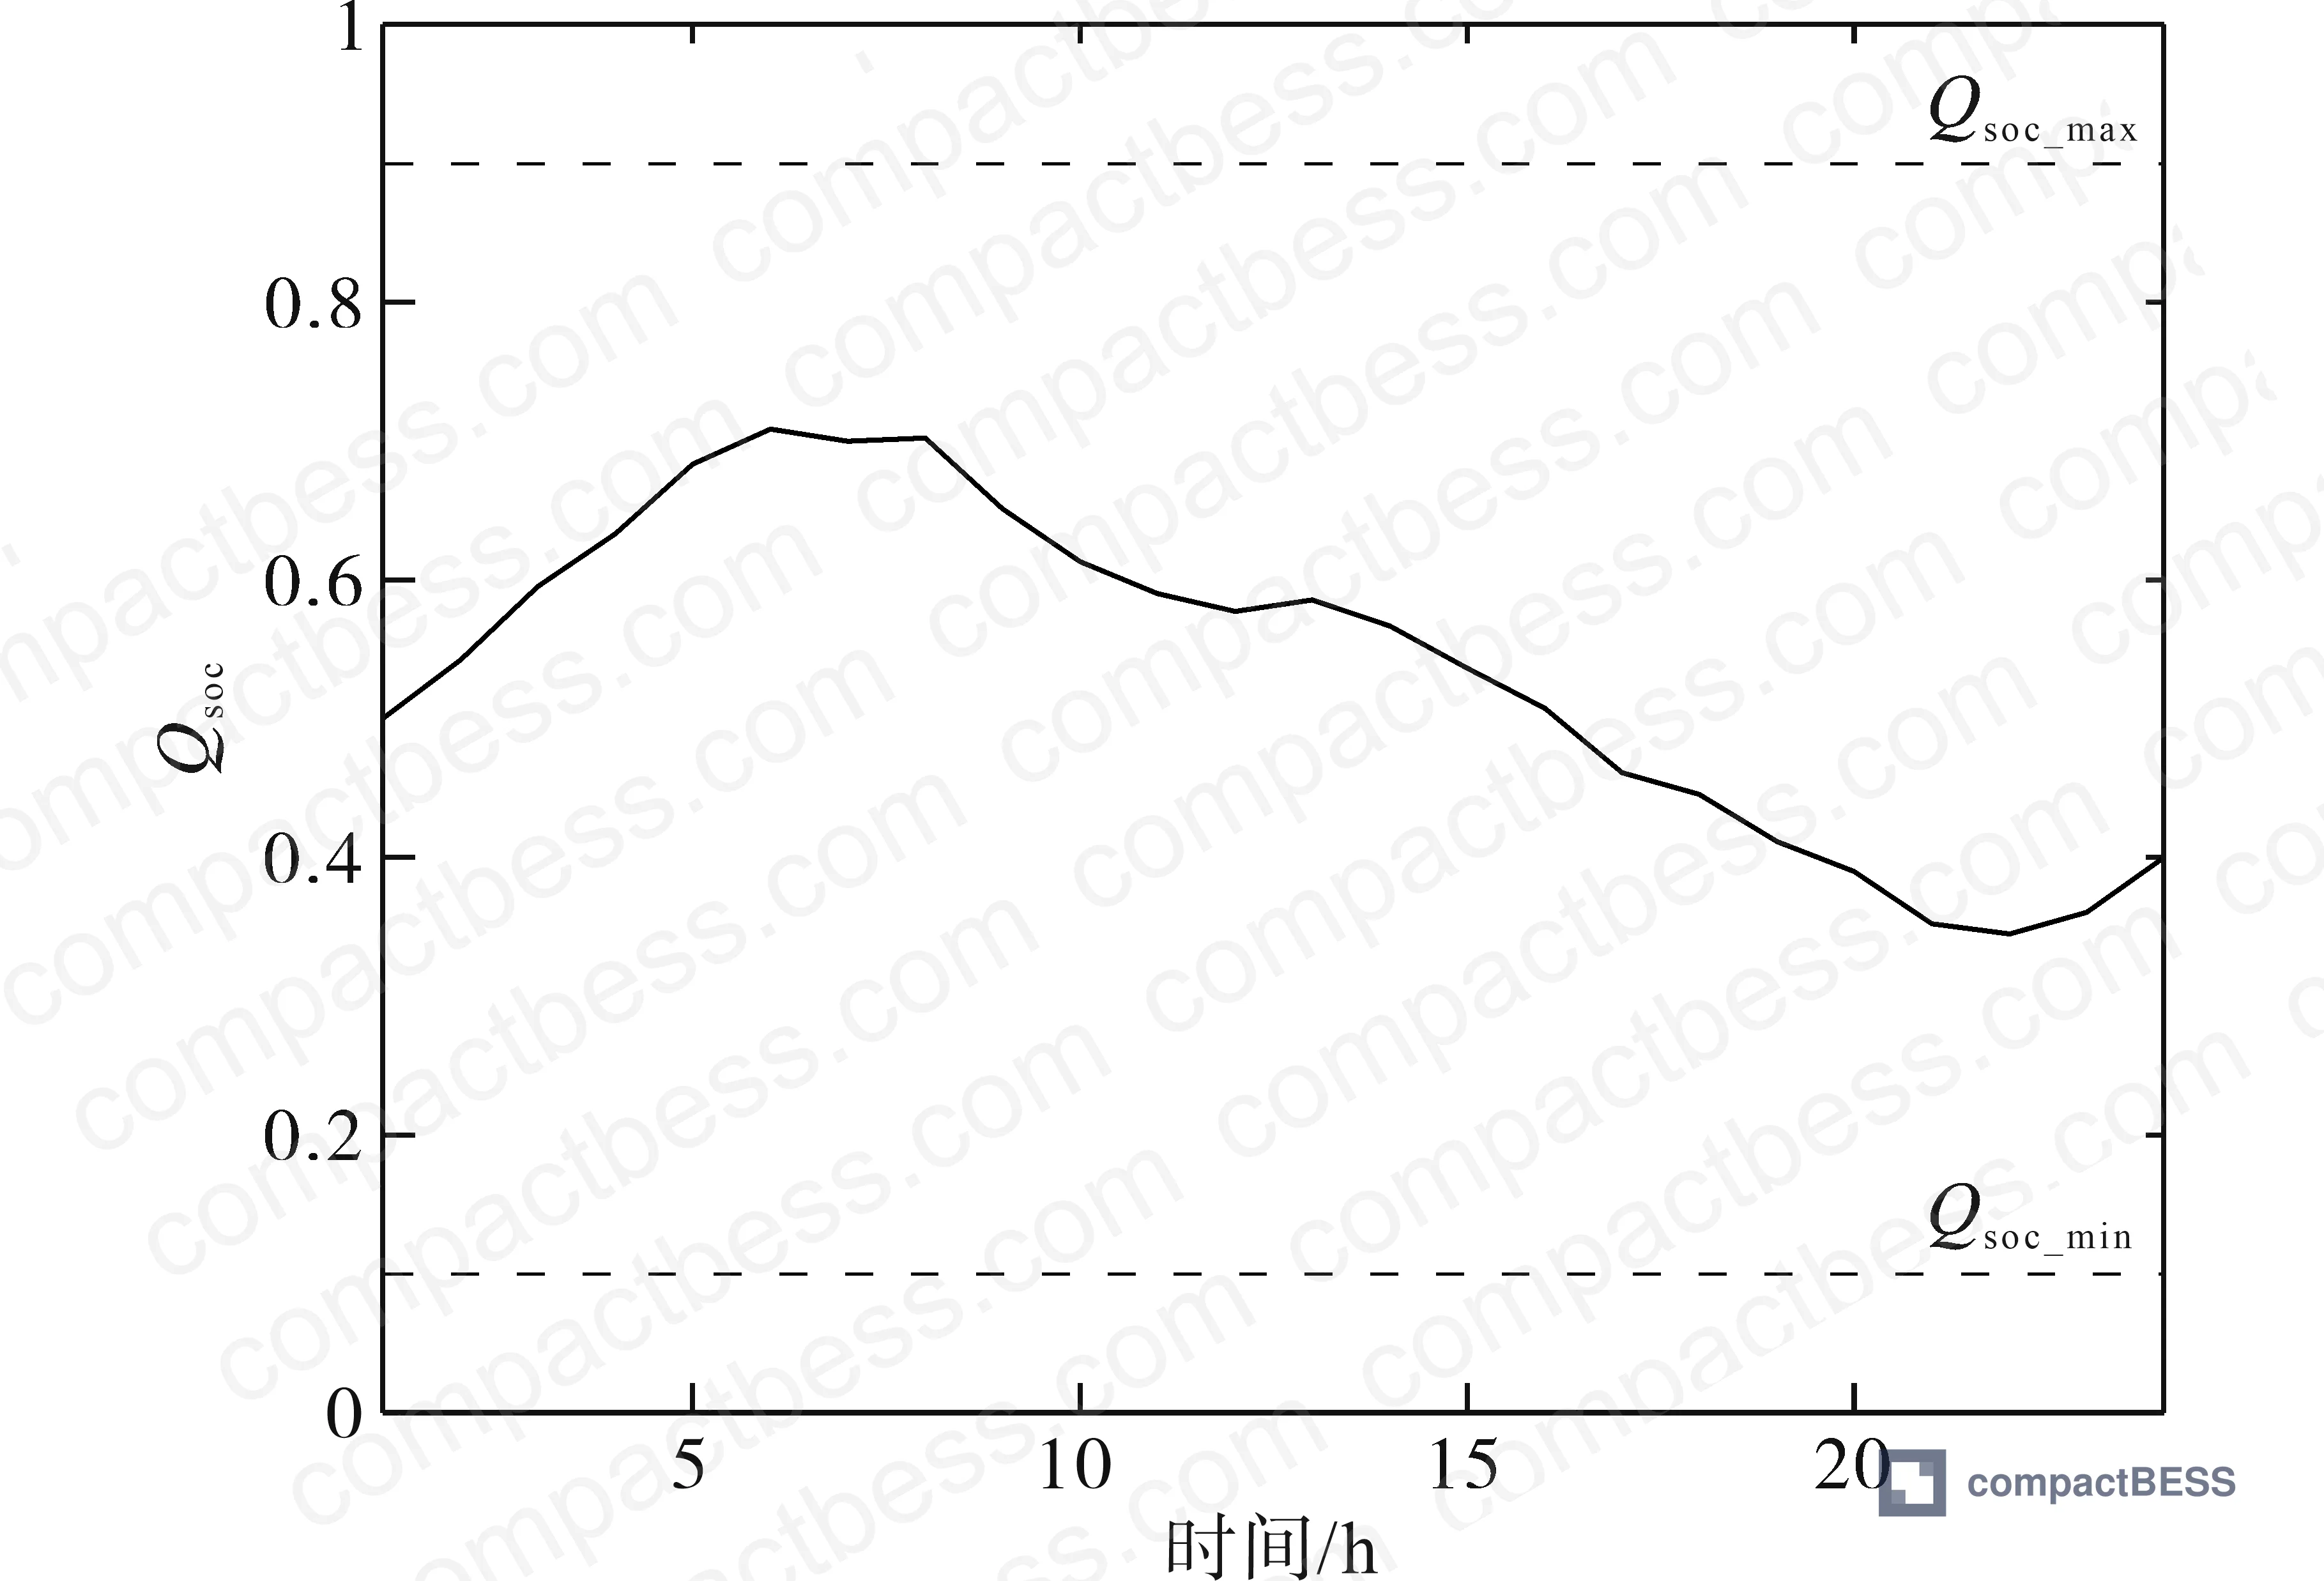
In supplier qualification, we saw that three of six BMS module samples submitted for evaluation failed to maintain stable SOC reference tracking (Qsoc,ref = 0.5) under simulated high-ramp-rate wind fluctuation profiles — not because of cell chemistry issues, but because the SOC estimation algorithm degraded under rapid current transients. Two of the three failures used coulomb counting alone without voltage correction, and one used a kalman filter implementation with an incorrectly tuned noise covariance matrix. All three would have passed standard UL and IEC bench tests, which don’t specifically stress-test SOC estimation accuracy under dynamic grid regulation duty cycles. This is the gap between certification compliance and operational qualification.
Practical Guidance for Buyers #
If you are sourcing LFP battery modules, BMS platforms, or complete BESS assemblies for grid frequency regulation or wind farm integration service, the sizing methodology matters as much as the hardware specification. A battery configured at 10.03 MW / 2.41 MW·h will outperform one configured at 10.23 MW / 2.83 MW·h — not despite having less capacity, but because optimized sizing keeps the SOC in the regulation command zone more of the time, reducing penalty exposure and improving regulation revenue capture.
Key chemistry selection note: this entire analysis was conducted with lithium iron phosphate (LFP), not NMC. For grid regulation duty, LFP’s cycle stability, thermal tolerance, and abuse resistance under high-rate partial SOC cycling are directly relevant. The LFP choice is embedded in the economic model — the 20-year lifecycle assumption with J replacement cycles only works with a chemistry that can sustain deep cycling calendars. NMC at comparable cycle counts would require more frequent replacement and would alter the lifecycle cost calculation substantially.
For buyers evaluating complete BESS systems, the BMS communication and SOC management architecture are non-negotiable qualification criteria — not optional features. Review BMS communication protocols and SOC estimation methods as part of your technical due diligence, not just the cell-level datasheets.
At CompactBESS, our sourcing team works with verified Chinese manufacturers of LFP cell packs and BMS modules specifically serving grid-connected applications for OEM brand owners and energy storage integrators across North America, Europe, and the Middle East — if you’re defining specifications for a grid regulation BESS project, our engineering team can help you translate optimal sizing parameters into manufacturable module configurations before you issue an RFQ.
Need help identifying qualified suppliers for LFP BESS grid frequency regulation systems? Talk to our sourcing team →
Supplier Qualification Questions #
- What is your BMS SOC estimation accuracy (absolute error, %) under dynamic current profiles with C-rates above 0.5C, and can you provide validation data showing SOC tracking against a reference coulombmeter at Qsoc,ref = 0.5 ± 0.05 under ramp-rate conditions representative of primary frequency regulation duty?
- What are the configurable SOC zone boundary parameters (Qsoc,min, Qsoc,l, Qsoc,h, Qsoc,max) in your BMS, and what is the minimum programmable step resolution for each threshold — specifically, can these be set to match a ±0.033 Hz dead-band frequency regulation control architecture?
- For your LFP cell modules, what is the measured round-trip efficiency at the pack level (accounting for both charge efficiency ηch and discharge efficiency ηdis), and at what C-rate and temperature was this measured — the economic model sensitivity to efficiency is significant at $75/MW·h electricity pricing?
- What is the maximum sustained charge and discharge power your system can deliver continuously during a 15-minute regulation window, and what derating applies if the ambient temperature exceeds 35°C — specifically, does your thermal management maintain rated power output within the ±0.033 Hz frequency dead-band response time requirement?
- Can you provide lifecycle cost documentation — specifically replacement cycle count J over a 20-year service life at your rated DOD, and unit decommissioning cost per MW·h — so that total cost of ownership can be modeled against the six-component lifecycle cost structure (Cinv, Cope, Crep, Cdis, Caw, Csho) used in utility procurement evaluation?
Sourcing Checklist #
- [ ] LFP cell chemistry confirmed (not NMC substituted); chemistry must be lithium iron phosphate with IEEE 1547 or equivalent grid interconnection test protocol
- [ ] Cycle life specification shows ≥3,000 cycles at 80% DOD with capacity retention ≥80%, supporting the 20-year lifecycle replacement schedule assumption
- [ ] UN 38.3 transport certification current and valid for the specific cell format and module configuration being shipped
- [ ] Lifecycle cost documentation available: unit capacity investment cost ($/MW·h), annual O&M cost ($/MW·h/year), and decommissioning cost ($/MW·h) for total cost of ownership modeling
Key Specifications Table #
| Parameter | Recommended Value | Verification Method |
|---|---|---|
| Rated power-to-capacity ratio | ~4.16:1 (MW:MW·h), target 10 MW per 2.41 MW·h | Cross-check against optimization output from dual-objective model; reject configurations >2.83 MW·h per 10 MW if frequency index O1 target is ≤0.026 |
| Frequency regulation dead-band threshold | ±0.033 Hz (50 ± 0.033 Hz) | BMS/controller datasheet; verify dead-band is configurable and matches target grid code requirement |
| SOC reference operating point | 0.5 (50%) with symmetric headroom to Qsoc,min and Qsoc,max | Dynamic SOC tracking test: charge/discharge cycling across regulation window, confirm Qsoc stability index Qsoc,r ≤ 0.1871 |
| Annualized net benefit sensitivity | Capacity investment cost ≤ $385,000/MW·h for 20-year lifecycle model to remain positive at $75/MW·h sell price and 6% discount rate | Request lifecycle cost breakdown from supplier; verify Cee and Cpe components against current market pricing |
| Frequency deviation suppression | O1 ≤ 0.026 (normalized frequency deviation index) | Simulation or hardware test with representative wind fluctuation profile; measure RMS frequency deviation over 15-minute window at 1-second sampling |
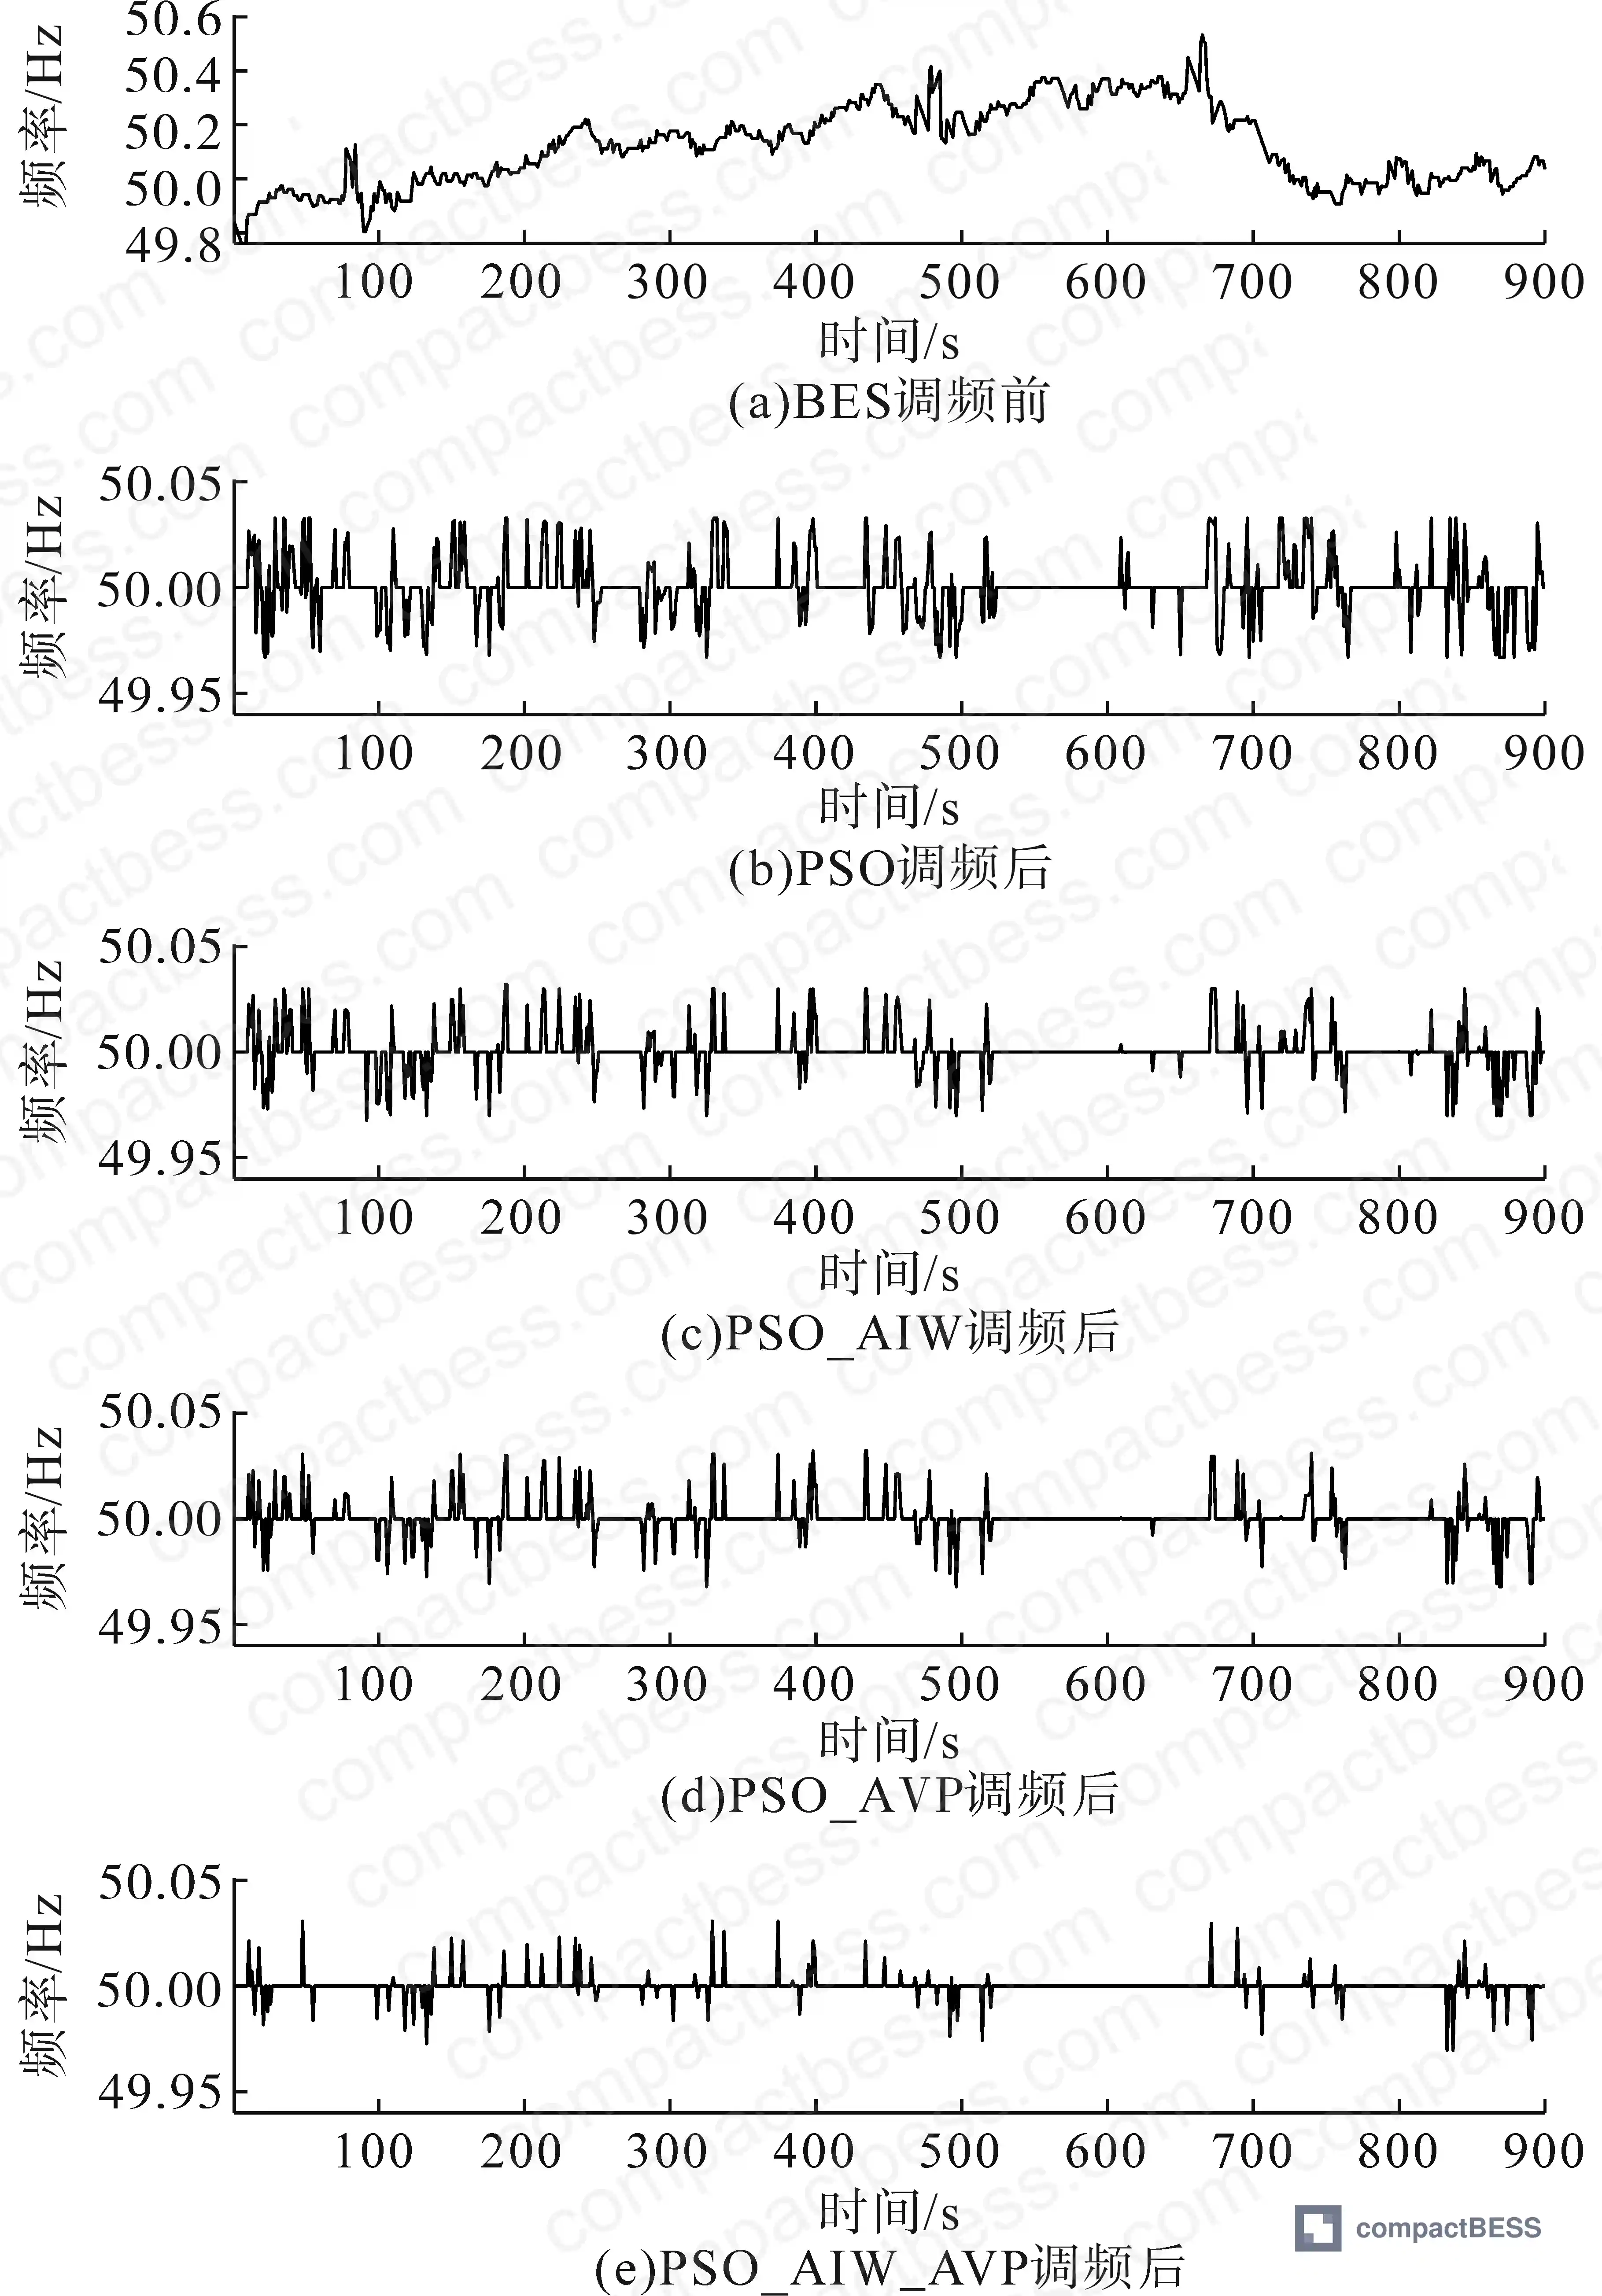
| Maximum pre-BES frequency deviation containment | Post-regulation peak deviation ≤ ±0.033 Hz (from pre-BES peak of 0.54 Hz) | Grid simulator or real data replay test; confirm BES brings deviation within dead-band under worst-case wind ramp event |
Can’t find a supplier meeting these specs? Submit your requirements and we’ll match you within 48 hours.
Frequently Asked Questions #
Q1: Why is LFP the preferred chemistry for primary frequency regulation applications rather than NMC or LTO?
LFP’s cycle stability under partial-SOC high-rate cycling is the decisive factor. Primary frequency regulation imposes a duty cycle that is fundamentally different from daily peak-shaving — the battery is repeatedly charged and discharged in small increments around the SOC midpoint at relatively high C-rates. NMC degrades faster under this specific duty cycle and at higher temperatures, which compromises the 20-year lifecycle assumption that underpins the economic model. LTO handles the cycling better but at significantly higher capital cost per MW·h. LFP sits at the optimal intersection of cycle performance, cost, and thermal tolerance for this application.
Q2: What does the Qsoc,r stability index actually measure, and what is a good target value?
Qsoc,r is the root-mean-square deviation of the battery’s instantaneous SOC from its reference operating point (Qsoc,ref = 0.5). A lower value means the SOC is staying closer to its target midpoint over time — which means the BES has more symmetric headroom available for both charge and discharge responses at any given moment. The optimized configuration achieved Qsoc,r = 0.1871; standard PSO produced 0.1907. The difference may look small in absolute terms, but it directly affects how often the BES can respond to both upward and downward frequency deviations without hitting a SOC boundary.
Q3: How does the wind curtailment penalty (Ceaw = $42/MW·h) affect the capacity sizing decision?
When the BES reaches its maximum SOC and cannot absorb additional wind power, that surplus generation must be curtailed — and in most grid interconnection agreements, the wind farm operator pays a penalty for each MW·h curtailed. At $42/MW·h, repeated curtailment events accumulate into a significant annual cost that effectively penalizes undersized storage capacity. However, oversizing to eliminate all curtailment risk is also wrong — the capital cost of the additional capacity exceeds the curtailment savings beyond a certain point. The optimization model finds the capacity at which the marginal curtailment cost savings exactly balance the marginal capital cost, which is why the optimal capacity is 2.41 MW·h rather than a round number.
Q4: Can the dual adaptive PSO sizing methodology be applied to non-wind applications like solar-plus-storage or industrial UPS?
The framework is transferable, but the input data requirements change. For wind-plus-storage, the frequency deviation and wind output fluctuation profiles are the primary inputs. For solar-plus-storage, you would substitute the irradiance-driven generation profile and the relevant grid interconnection frequency requirement. For industrial UPS applications, the regulation dead-band concept is replaced by voltage and frequency ride-through requirements. The five-zone SOC management architecture is directly applicable to any application where the BES must manage both regulation and energy trading simultaneously.
Q5: What grid standards govern primary frequency regulation response requirements for battery storage?
Grid codes vary by region, but key reference standards include IEEE 1547-2018 for distributed resource interconnection (North America), and EN 50549 for European grid-connected generator requirements. The ±0.033 Hz dead-band used in this evaluation aligns with Chinese national grid frequency regulation specifications; North American NERC BAL-003 and European ENTSO-E grid codes use different threshold values, so buyers sourcing for specific regional grid applications should verify that the BMS control parameters are configurable to match their target grid code rather than hard-coded to Chinese grid specifications.
Published by compactbess.com Technical Team | Request a sourcing quote
Data source: Optimal Capacity Allocation of Battery Energy Storage for Primary Frequency Regulation in Wind-Integrated Power Systems Using a Dual Adaptive Particle Swarm Optimization Approach, Y. Liu et al., Journal of the Electrochemical Society, 2024


