

TL;DR #
In validated CFD simulations of a 52-cell, 280 Ah LiFePO4 module, a combined bottom-and-side-plate liquid cooling structure reduced peak cell temperature by more than 6°C compared to conventional bottom-plate-only cooling under 1C discharge — while cutting temperature standard deviation from 4.65°C down to 2.86°C. For buyers specifying thermal management in rack-scale BESS modules, this gap is the difference between a 10-year cycle-life warranty being credible or not. Before issuing any RFQ for liquid-cooled battery modules, require suppliers to declare their cooling architecture, inlet/outlet diameter, and worst-case temperature uniformity data at 1C.
Overview #
Most procurement teams default to asking for a datasheet temperature range and calling it done. That is a mistake — what matters operationally is not the rated working range (25–45°C for LiFePO4) but how well the thermal management system holds temperature uniformity across all cells in the module under sustained load. A module that runs hot in one corner and cool in another is aging unevenly, whether or not the peak temperature sits within spec.
The findings summarized in this article come from a CFD-validated thermal simulation study conducted by engineers at a major grid-scale energy storage project development firm, using a production-representative 52-cell module with 280 Ah prismatic LiFePO4 cells in series. The research team built and validated physical simulation models against empirical data, then systematically compared three distinct liquid cooling architectures across a matrix of discharge rates (0.5C, 0.75C, 1C), coolant inlet temperatures, and flow velocities. Grid independence was verified across mesh counts ranging from roughly 640,000 to over 9.7 million cells, with maximum temperature deviations well under 5% — confirming the model’s reliability before any conclusions were drawn.
The module enclosure measured 1160 mm (L) × 810 mm (W) × 245 mm (H). Cooling fluid properties: density 1073.35 kg/m³, specific heat 3281 J/(kg·°C), thermal conductivity 3.94 W/(m·K), viscosity 0.38 mPa·s. Cell thermal conductivity was anisotropic — 3.56 W/(m·K) in the x-direction, 9.04 W/(m·K) in the y-direction, and 11.0 W/(m·K) in the z-direction — which is exactly the kind of detail that separates a credible thermal simulation from a marketing slide.
Liquid Cooling Architecture Comparison: Bottom-Plate vs. Side-Plate vs. Combined Structures #
Three cooling architectures were evaluated head-to-head: the conventional bottom-plate liquid cooling (baseline), a new side-plate liquid cooling design, and a combined bottom-plus-side-plate (“dual”) structure. All three used 4 inlet and 4 outlet sub-channels with a single inlet and outlet port each. The bottom-plate design used sub-channel width of 33 mm and channel height of 3.5 mm; the side-plate design used 4.5 mm sub-channel width and 7 mm channel height.
The results across all three discharge rates are unambiguous:
| Cooling Structure | Peak Temp @ 1C (°C) | Peak Temp @ 0.75C (°C) | Peak Temp @ 0.5C (°C) | Temp Std. Dev. @ 1C (°C) |
|---|---|---|---|---|
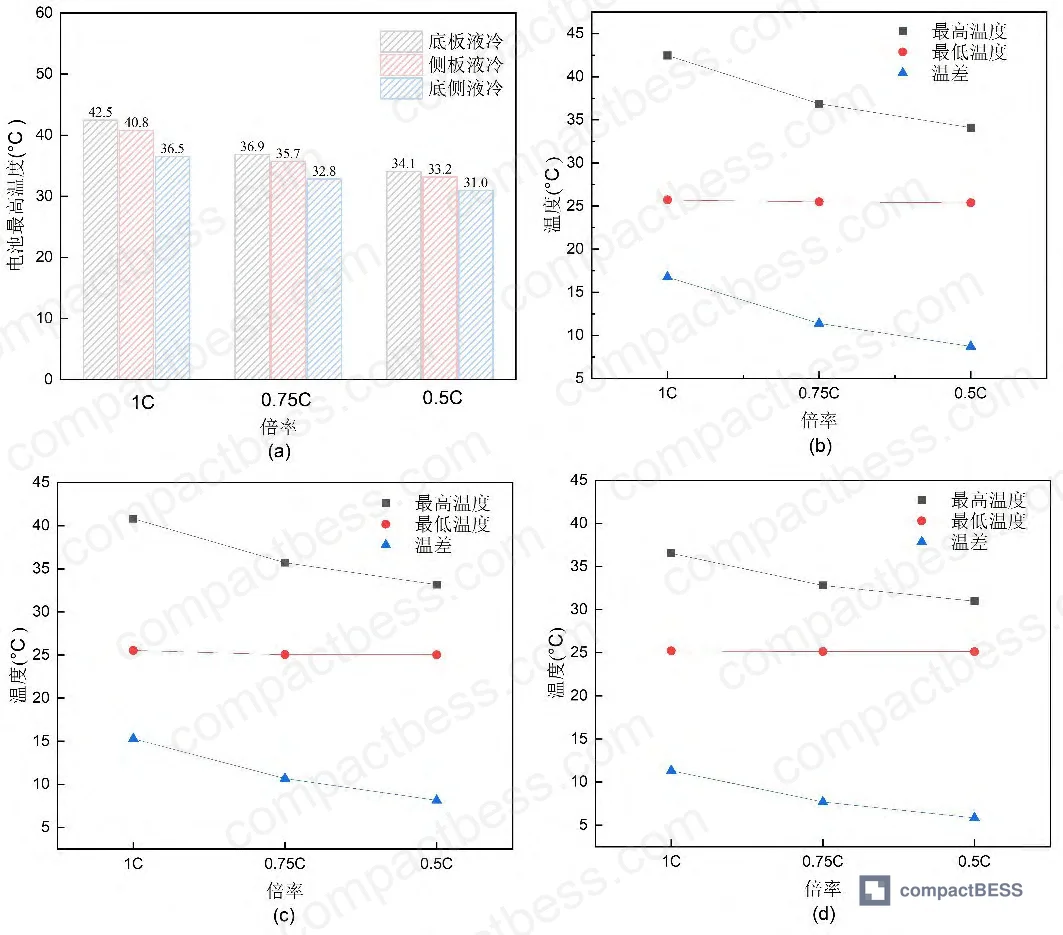
| Bottom-plate only | 42.5 | 36.9 | 34.1 | 4.65 |
| Side-plate only | 40.8 | 35.7 | 33.2 | 3.38 |
| Combined (bottom + side) | 36.5 | 32.8 | 31.0 | 2.86 |
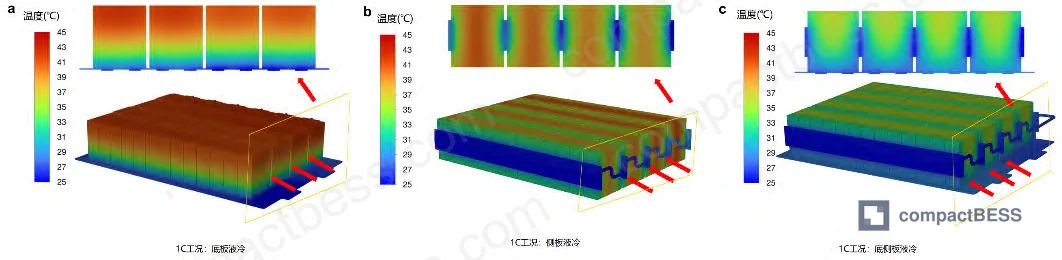
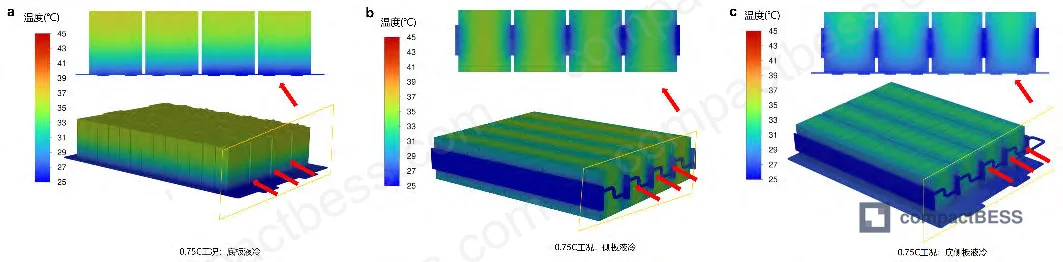
The combined structure doesn’t just lower peak temperature — it fundamentally changes the heat distribution pattern. Bottom-plate cooling produces a temperature gradient that rises steadily from bottom to top of the cell stack, which is the worst possible pattern for prismatic cells in a tall module. Side-plate cooling shifts the hottest zone toward the interior center of the pack, which is better but still uneven. The combined structure compresses that gradient further in both axes. At 1C, the temperature differential across the module drops from 16.8°C (bottom-plate) to 11.3°C (combined) — a reduction that directly translates to more uniform capacity fade and a lower probability of localized lithium plating events during fast charge.
Honestly, most buyers over-specify cell capacity and under-specify thermal uniformity. A 280 Ah cell running at 42.5°C in the hottest corner of a bottom-plate-cooled module is degrading measurably faster than the 34.1°C average you might read off a module-level sensor. The standard deviation metric — 4.65°C for bottom-plate vs. 2.86°C for combined — is the number that actually predicts cycle life variance.
Inlet Diameter Optimization and Coolant Flow Velocity Effects #
Before comparing architectures, the study first established the optimal inlet/outlet diameter — a parameter that buyers almost never ask about but that materially affects both cooling performance and flow stability.
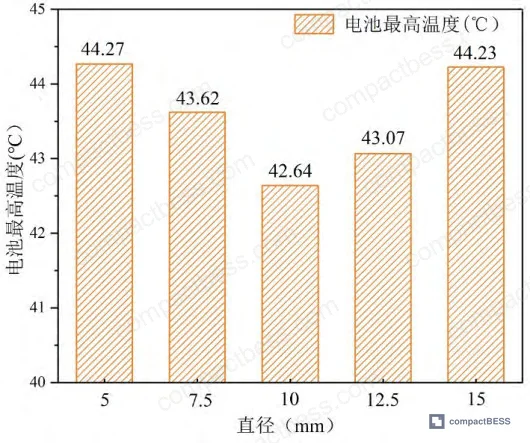
At a constant flow rate and 1C discharge, with module and coolant initial temperature both at 25°C, inlet/outlet diameter was swept from 5 mm to 15 mm:
- At 5 mm: peak cell temperature reached 44.3°C
- At 10 mm: peak cell temperature dropped to 42.6°C — the optimal point
- At 15 mm: peak cell temperature climbed back to 44.2°C
The mechanism matters here. As diameter increases from 5 to 10 mm, flow velocity decreases and coolant distributes more uniformly across the sub-channels — improving heat transfer. Push the diameter beyond 10 mm and the flow regime shifts: localized recirculation and vortex zones develop, degrading heat transfer efficiency. This is a classic thermal-hydraulic trade-off, and 10 mm was selected as the fixed diameter for all subsequent structural comparisons.
Most procurement teams don’t realize that the cooling channel geometry — not just flow rate — is what determines whether a liquid-cooled module actually meets its thermal specs in field conditions. A supplier who can’t tell you their inlet diameter or why they chose it is winging the thermal design.
Energy Consumption and Optimal Operating Strategy for Each Architecture #
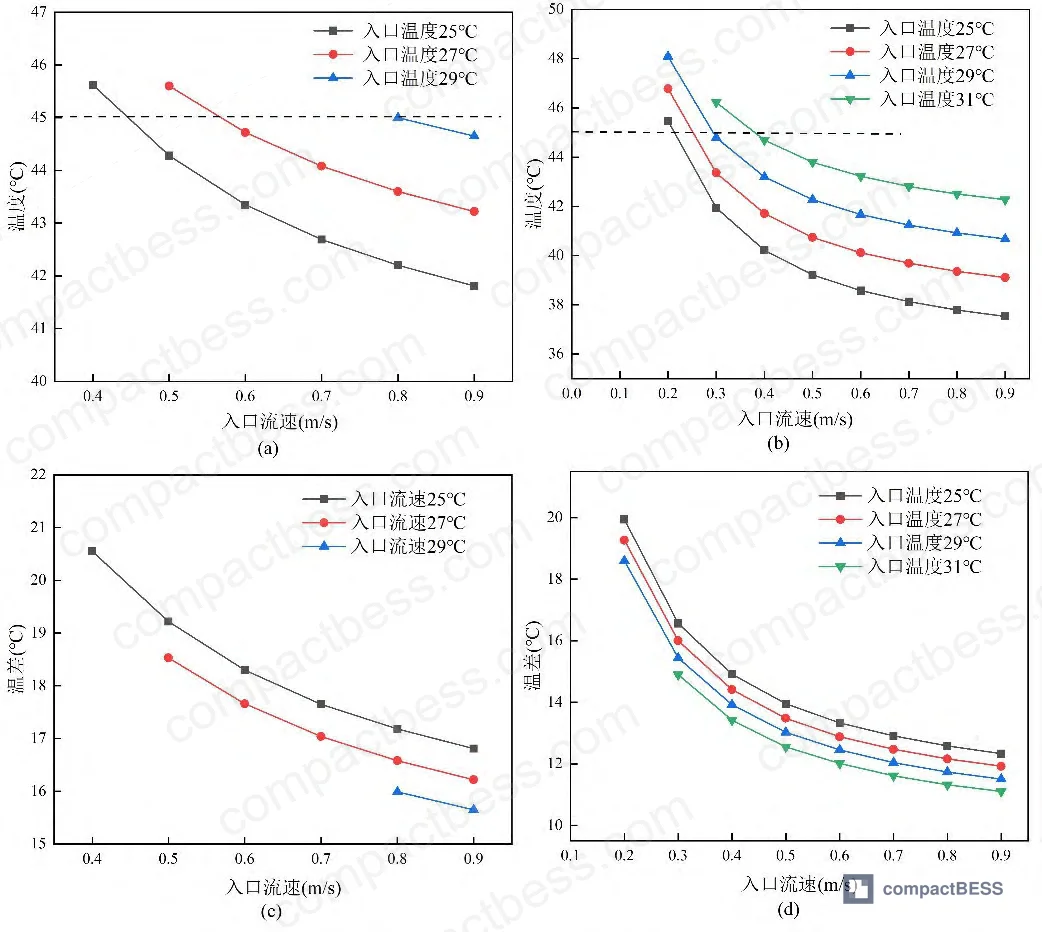
With the architecture comparison established, the study then modeled system energy consumption across a matrix of inlet temperatures and flow velocities, with 45°C set as the hard upper limit for cell temperature. The ambient temperature assumption was 32°C — a realistic summer condition for outdoor BESS installations in South and Southeast Asia or the Middle East.
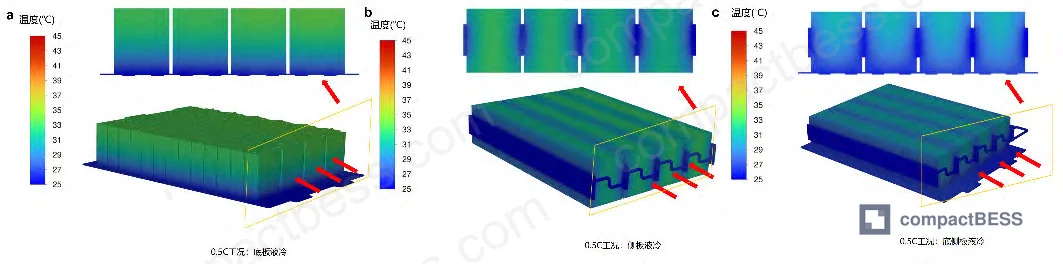
At 1C discharge, bottom-plate cooling already approaches the 45°C safety limit — so it is effectively disqualified for 1C operation without hardware redesign. The energy consumption analysis therefore focused on side-plate and combined structures only.
The heat generation data used as boundary conditions:
| Discharge Rate | Volumetric Heat Source (W/m³) | Efficiency | Heat Generation (kW) |
|---|---|---|---|
| 0.5C | 5,363.7 | 94% | 0.699 |
| 0.75C | 6,257.7 | 93% | 1.223 |
| 1C | 14,303.2 | 92% | 1.864 |
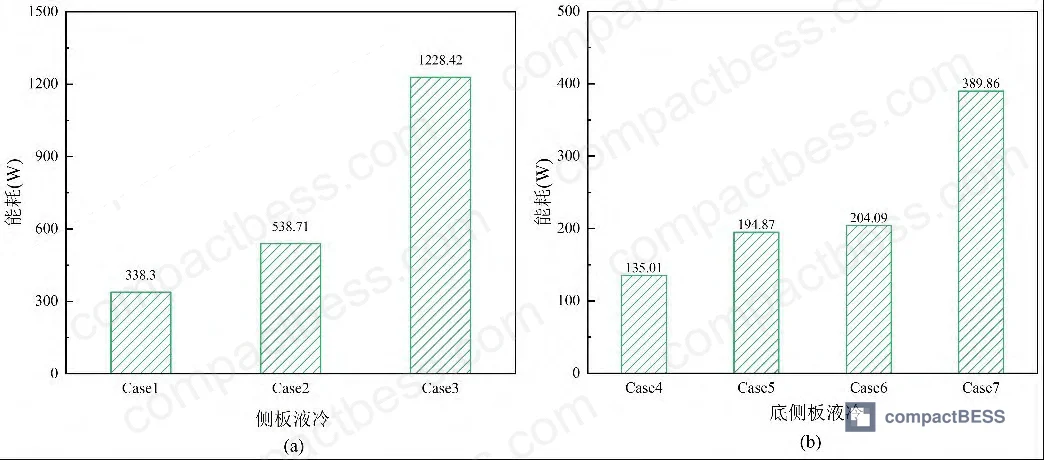
For the side-plate structure, the minimum-energy operating point (Case 1) uses 25°C inlet temperature and 0.4 m/s flow velocity — system energy consumption: 338.30 W. At the same inlet temperature but higher flow velocity (0.9 m/s), energy consumption jumps to 1,228.42 W. The penalty for over-pumping is severe.
For the combined structure, the minimum-energy operating point (Case 4) uses 25°C inlet temperature and only 0.2 m/s flow velocity — system energy consumption: 135.01 W. That is less than 40% of the side-plate minimum.
The combined structure’s minimum energy consumption is 2.51× lower than the side-plate structure’s minimum. That gap doesn’t close with clever control algorithms — it’s baked into the geometry.
In supplier qualification work, we have seen modules where the cooling system was consuming more power than the difference in cycling efficiency between two competing cell chemistries. That’s the kind of calculation buyers need to run before committing to a thermal architecture.
The minimum inlet flow velocity requirements to hold cell temperature below 45°C:
| Case | Inlet Temp (°C) | Min. Flow Velocity (m/s) | Structure |
|---|---|---|---|
| Case 1 | 25 | ≥0.5 | Side-plate |
| Case 2 | 27 | ≥0.6 | Side-plate |
| Case 3 | 29 | ≥0.8 | Side-plate |
| Case 4 | 25 | ≥0.2 | Combined (bottom + side) |
| Case 5 | 27 | ≥0.3 | Combined (bottom + side) |
| Case 6 | 29 | ≥0.3 | Combined (bottom + side) |
| Case 7 | 31 | ≥0.4 | Combined (bottom + side) |
Practical Guidance for Buyers #
If you are sourcing liquid-cooled battery modules for grid storage, industrial UPS, or large-format outdoor power applications, the thermal architecture choice is not an aesthetic preference — it’s a system-level procurement decision with direct consequences for warranty validity, cycling cost, and safety.
Bottom-plate-only cooling is the most common structure you’ll encounter from volume manufacturers because it’s cheaper to tool and easier to assemble. Based on the data above, it cannot reliably hold temperature differentials below 10°C under 1C load in a 52-cell series module. If your application involves frequent 1C cycling, it’s the wrong architecture regardless of how attractive the unit price is.
The combined bottom-plus-side-plate structure delivers the best performance on every measured metric — peak temperature, temperature uniformity, and system energy consumption — but it adds mechanical complexity and cost. Ask suppliers specifically whether their side-plate channels are thermally bonded or merely in contact with cell surfaces; a gap of even 0.1 mm filled with air instead of thermal interface material will substantially degrade the side-plate’s contribution.
For procurement qualification purposes, require a CFD simulation report with validated mesh independence data (relative deviation < 5% across mesh count iterations), along with test data at 1C discharge showing module temperature differential. Any supplier claiming ΔT < 10°C at 1C on a bottom-plate-only design should be asked to demonstrate it, not just state it.
Standards to reference in your RFQ: IEC 62619:2022 (safety requirements for stationary energy storage), UL 9540 (energy storage system safety), and UN 38.3 for transport qualification of the cells within the module.
At compactbess.com, our sourcing team works directly with verified Chinese manufacturers specializing in liquid-cooled BESS modules and pack assemblies — connecting global OEM buyers and energy storage integrators with suppliers who can provide full thermal simulation documentation and production test reports before any commitment.
Need help identifying qualified suppliers for liquid-cooled BESS modules? Talk to our sourcing team →
Supplier Qualification Questions #
- What is your module’s temperature standard deviation (Tδ) at 1C discharge with coolant inlet at 25°C and flow velocity at 0.9 m/s — and can you provide the CFD validation report showing mesh independence with less than 5% deviation across at least three mesh densities?
- What is the inlet/outlet diameter of your liquid cooling manifold, and what is the measured peak cell temperature at inlet diameters of 10 mm vs. 15 mm at 1C discharge — can you confirm the 10 mm optimum holds for your module geometry?
- For a 52-cell or equivalent module at 1C discharge, what is the maximum temperature differential (ΔT) between the hottest and coolest cell, and does your cooling architecture achieve ΔT ≤ 11.3°C as demonstrated in combined bottom-plus-side-plate designs?
- What is the minimum coolant inlet flow velocity required to hold peak cell temperature below 45°C at 1C discharge with 29°C inlet temperature — and what is the corresponding system energy consumption (pump + chiller combined) in watts?
- Does your thermal management system support operation at coolant inlet temperatures between 25°C and 31°C with corresponding flow velocity adjustment, and what is the minimum energy operating point (target: system total ≤ 135–338 W depending on architecture) for your specific cooling structure?
Sourcing Checklist #
- [ ] Supplier has provided CFD simulation report with grid independence verification across ≥3 mesh densities, with maximum temperature deviation < 5% between mesh iterations
- [ ] Module thermal data confirms peak cell temperature ≤ 45°C at 1C discharge under 32°C ambient conditions, compliant with IEC 62619:2022 operating temperature requirements
- [ ] Liquid cooling structure is confirmed as side-plate or combined (bottom + side) design — not bottom-plate only — with temperature standard deviation ≤ 3.38°C at 1C
- [ ] Inlet/outlet diameter is specified at ≤ 10 mm for the cooling manifold, with documentation showing peak temperature rises above 42.6°C are not observed at the design flow rate
- [ ] System energy consumption at minimum operating point is documented: ≤ 338.30 W for side-plate structures or ≤ 135.01 W for combined structures at 25°C inlet, per architectural type
- [ ] Coolant specification is provided including density (~1073 kg/m³), specific heat (~3281 J/kg·°C), and thermal conductivity (~3.94 W/m·K), matching or exceeding reference coolant performance
- [ ] Module-level thermal test report demonstrates temperature differential ≤ 11.3°C at 1C, validated against UL 9540 or equivalent safety standard requirements
- [ ] Cell transport certification confirms UN 38.3 compliance for the 280 Ah prismatic LiFePO4 cells used within the module
Key Specifications Table #
| Parameter | Recommended Value | Verification Method |
|---|---|---|
| Peak cell temperature @ 1C discharge | ≤ 36.5°C (combined structure) / ≤ 40.8°C (side-plate) | CFD simulation validated against physical thermocouple data; module-level 1C discharge test |
| Temperature standard deviation (Tδ) | ≤ 2.86°C (combined) / ≤ 3.38°C (side-plate) | Statistical calculation per IEC 62619 thermal uniformity assessment; surface temperature mapping via IR thermography |
| Coolant inlet/outlet manifold diameter | 10 mm (optimal) | Engineering drawing review; pressure drop measurement confirming laminar flow regime |
| Minimum coolant flow velocity @ 25°C inlet | ≥ 0.2 m/s (combined structure) / ≥ 0.5 m/s (side-plate) | Flow meter at inlet; confirmed by ΔT measurement staying ≤ 45°C peak cell temperature |
| System energy consumption (pump + chiller) | ≤ 135.01 W (combined, optimal case) / ≤ 338.30 W (side-plate, optimal case) | Power logger on coolant circuit; calculated from inlet/outlet pressure differential and chiller COP |
| Module temperature differential (ΔT) @ 1C | ≤ 11.3°C (combined) / ≤ 15.3°C (side-plate) | Module-level discharge test with distributed thermocouple array or IR camera |
Can’t find a supplier meeting these specs? Submit your requirements and we’ll match you within 48 hours.
Frequently Asked Questions #
Why does bottom-plate liquid cooling perform worse than side-plate designs, even with the same coolant flow rate?
The core issue is contact geometry. In a prismatic cell module, heat generation is distributed through the full height of the cell, but the bottom plate only contacts cells at one face. This forces heat to travel the full cell height before reaching the cooling surface, creating a steep bottom-to-top thermal gradient. Side plates contact the cells along their largest surface area, intercepting heat much closer to where it’s generated. The combined structure essentially eliminates the one-sided extraction problem by cooling from two perpendicular planes simultaneously — which is why it cuts temperature standard deviation from 4.65°C (bottom only) to 2.86°C.
What happens to temperature uniformity if I run the coolant at lower temperature to compensate for a weaker cooling architecture?
You lower the peak temperature, but you worsen the temperature differential — and that’s the real risk. The simulation data shows clearly that reducing coolant inlet temperature from 25°C to 29°C lowers the peak cell temperature but progressively increases the module’s maximum temperature differential. A module that looks thermally controlled at the module-level sensor may have cells at opposite ends of the temperature range aging at substantially different rates. Chasing lower inlet temperatures to compensate for poor architecture is not a substitute for the right structural design.
Is the combined bottom-plus-side-plate structure significantly more expensive to manufacture?
It adds tooling complexity and requires more precise thermal interface bonding between side plates and cell surfaces. Whether the cost premium is justified depends on your application’s duty cycle. For systems operating at or near 1C regularly — daily cycling, peak shaving, frequency regulation — the energy savings alone (2.51× lower minimum system energy consumption) can offset the hardware cost difference over a multi-year service period. For low-utilization backup power applications cycling at 0.5C, bottom-plate cooling may be adequate if temperature differential specs are relaxed.
What certifications should I require for a liquid-cooled BESS module in commercial or industrial applications?
At minimum: IEC 62619:2022 for stationary energy storage safety, UL 9540 for the complete energy storage system, and UN 38.3 for cell-level transport. For EU market installations, also check alignment with the EU Battery Regulation 2023/1542 requirements on safety and thermal management documentation. These are the baseline — specific project requirements from grid operators or building codes may add further layers.
What is a realistic target for temperature uniformity in a well-designed liquid-cooled module?
Based on validated simulation data for a 52-cell 280 Ah LiFePO4 module, a temperature standard deviation of ≤ 3°C and a peak-to-trough differential of ≤ 12°C at 1C discharge represents strong performance. The combined cooling architecture in this study achieved Tδ = 2.86°C and ΔT = 11.3°C at 1C. If a supplier quotes ΔT < 5°C on a bottom-plate-only design at 1C, ask for the test report — that number is not consistent with the physics of single-face cooling on prismatic cells.
For more context on how cell format and pack geometry interact with thermal management requirements, see our guides on prismatic cell module design and pack enclosure and IP rating considerations.
Published by compactbess.com Technical Team | Request a sourcing quote
Data source: Thermal Design and Performance Optimization of Liquid-Cooled Lithium Iron Phosphate Battery Modules for Grid-Scale Energy Storage Applications, J. Zou et al., Journal of the Electrochemical Society, 2024


