

TL;DR #
In validated thermal simulation of three duct configurations, the dual-channel (U-type) structure achieved a cross-sectional temperature uniformity of 2.57 K maximum differential — versus 87.17 K for the straight-flow configuration — while storing 1,482.08 kWh over an 8-hour charge cycle at 300 kW input. For buyers specifying solid-state electric thermal energy storage systems, duct geometry is not a secondary detail: it is the primary determinant of heat utilization efficiency and service life. Before issuing any RFQ, confirm that your supplier can demonstrate dual-channel airflow geometry with documented temperature uniformity data, not just rated storage capacity.
Overview #
Most buyers approaching solid electric thermal energy storage come in focused on headline storage capacity and heating power. That’s understandable — but it misses the variable that actually determines whether a unit performs to spec in service: the internal airflow duct geometry. Procurement teams that skip this evaluation are essentially buying a number on a datasheet without verifying the mechanism behind it.
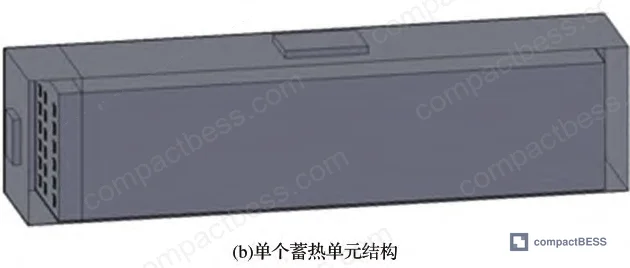
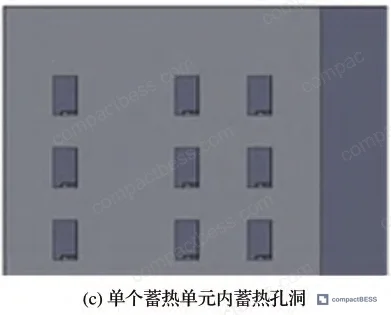
The data referenced throughout this article comes from high-fidelity CFD simulation work conducted at a major Chinese technical university, validated against thermodynamic calculations for a magnesium brick solid heat storage system. The study evaluated three distinct duct configurations — straight single-channel, dual U-channel, and a hybrid variant — under identical 300 kW heating input and 8-hour charge cycles, using mesh models of 1.3 to 1.5 million elements per configuration, each independently verified for mesh independence. The physical model dimensions (3,565 mm × 740 mm × 845 mm overall module envelope) and material parameters (magnesium brick: density 3,000 kg/m³, thermal conductivity 5 W/(m·K), heat capacity 3,390 kJ/(m³·K)) give the results direct engineering applicability.
This is not laboratory curiosity. As renewable penetration continues expanding globally — wind and solar cumulative installations have surpassed 1.1 billion kW in China alone — solid thermal storage becomes a critical grid-balancing asset. The performance differences between duct configurations have direct consequences for system ROI, heating wire longevity, and fan energy consumption.
Duct Configuration Performance in Solid Thermal Storage Systems: A Direct Comparison #
This is where the data gets decisive.
Three configurations were modeled under identical conditions: 300 kW total heating power, 8-hour charge, inlet air at 300 K, inlet velocity at 3 m/s during discharge. The differences in outcome are not marginal.
| Parameter | Duct Type 1 (Straight) | Duct Type 2 (Dual U-Channel) | Duct Type 3 (Hybrid Straight) |
|---|---|---|---|
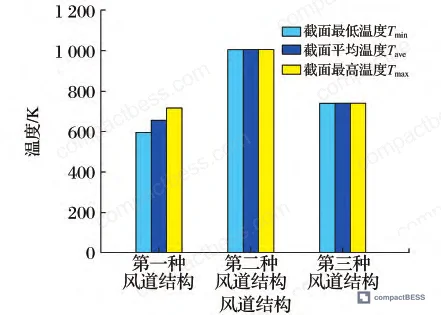
| Final average temperature after 8 h (K) | 656.43 | 1,006.07 | 740.57 |
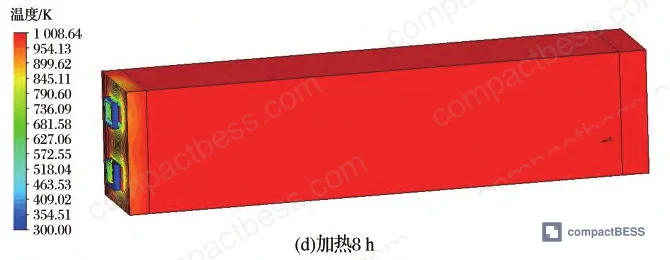
| Peak temperature after 8 h (K) | 743.60 | 1,008.64 | 742.09 |
| Minimum temperature after 8 h (K) | 595.89 | 1,005.88 | 740.39 |
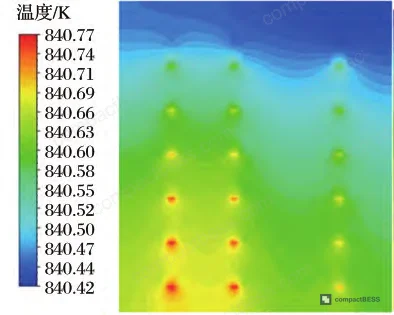
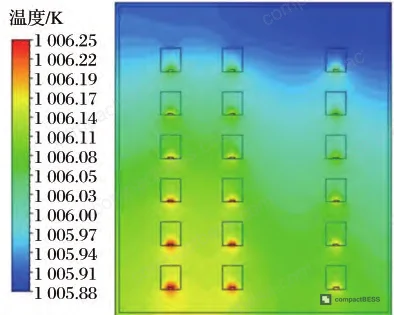
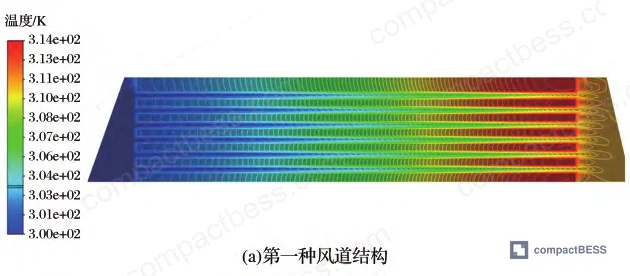
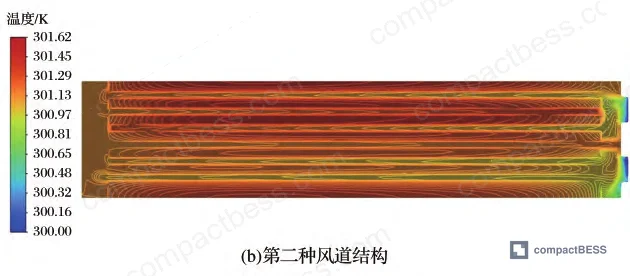
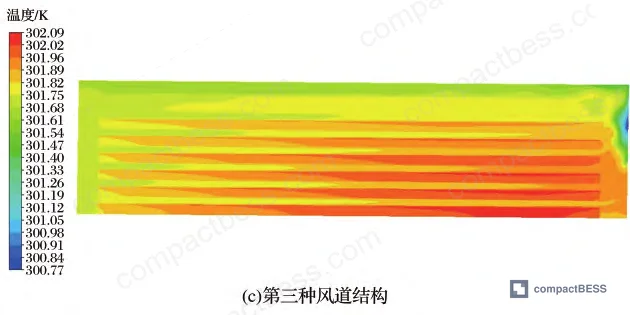
| Cross-section max temperature differential (K) | 87.17 | 2.57 | 1.52 |
| Discharge outlet air peak temp (K) | — | 577.01 | — |
| Air flow path character | Linear, short residence | U-channel, doubled path | Linear, short residence |
| Heat utilization assessment | Poor — early thermal saturation | Excellent — extended dwell time | Moderate — limited discharge |
The straight-channel configuration (Type 1) is a textbook case of thermal maldistribution. An 87.17 K differential across the same cross-section means some portions of the storage brick are working close to saturation while others barely reach target temperature. You’re paying for full heating capacity but extracting significantly less than full stored energy.
Type 2’s 2.57 K cross-section differential isn’t just better — it’s a different category of performance. The U-channel doubles the effective flow path length, which means inlet air at 300 K has meaningful dwell time against a storage body initially at 765 K, extracting heat to reach a 577.01 K outlet temperature.
Honestly, most buyers over-specify rated storage capacity while completely ignoring duct geometry. I’ve seen RFQs that specify total kWh to three decimal places but contain zero requirements around temperature uniformity or channel configuration. That is exactly backward.
Thermal Charging Dynamics and Energy Storage Capacity in Magnesium Brick Systems #
The charge-cycle temperature progression in the dual-channel system tells a clear story about how storage density builds over time — and where losses occur.
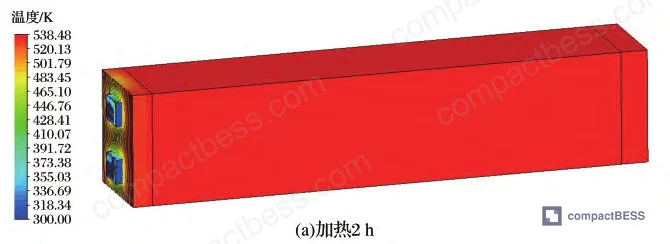
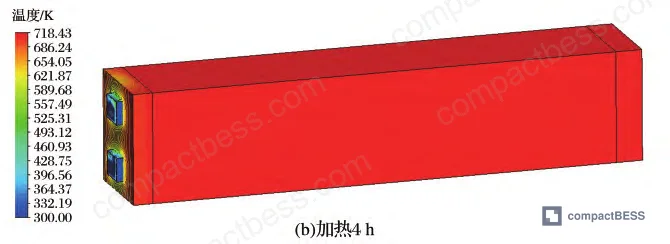
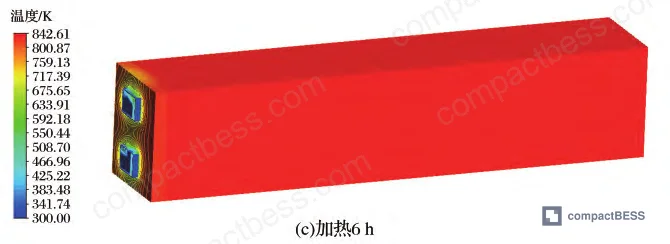
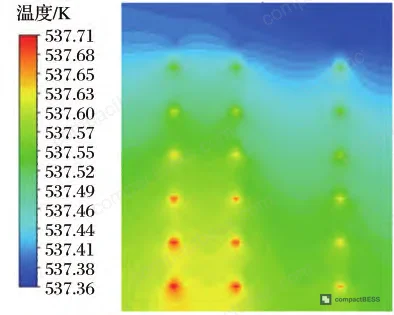
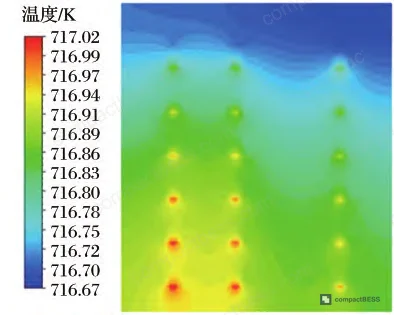
Starting from a uniform 300 K initial module temperature with 300 kW input, the peak temperature in the cross-section rose from 538.48 K at 2 hours, to 718.43 K at 4 hours, to 842.61 K at 6 hours, reaching a final average of 1,006.07 K at 8 hours. The rate of temperature rise decreases progressively as the module heats — which is expected thermodynamic behavior as the temperature gradient between heating wire and storage brick narrows. Engineers who interpret a flattening charge curve as a system fault are misreading normal operating behavior.
The final calculated actual heat storage capacity of the module assembly reached 1,482.08 kWh, against a design target of 2,400 kWh total system storage — with the discrepancy attributable to thermal losses and the defined charge window. The total module assembly comprises 1,138 individual storage blocks, each with a volume of 0.001 72 m³ and mass of 5.16 kg, giving a total module mass of approximately 6,001.08 kg.
A note on heating wire surface load that most procurement teams overlook entirely: the thermal calculation for this system produced a heating wire surface load of 11.4 W/m², within the recommended range of 3–8 W/cm² for high-temperature applications. This parameter directly governs heating element service life. Suppliers who push surface loads above this range to hit aggressive power density targets are trading your long-term OPEX for their short-term BOM cost.
Discharge Performance and Inlet Velocity Optimization #
Discharge behavior is where the dual-channel advantage becomes operationally significant.
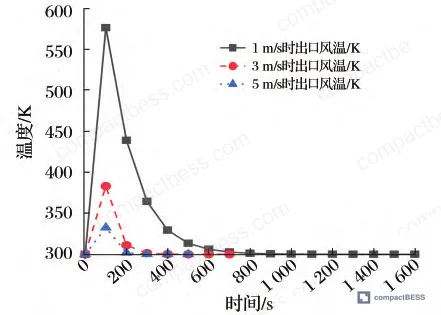
At an inlet air velocity of 1 m/s, outlet air peak temperature reached 577.01 K, and the discharge period was substantially longer than at 3 m/s or 5 m/s. The slower flow rate allows more complete heat extraction — the temperature approaches 300 K gradually, with a relatively slow final decay rate. Higher inlet velocities (3 m/s and 5 m/s) produce faster discharge cycles but at lower outlet temperatures and shorter total discharge windows.
This is not a binary optimization. The inlet velocity selection depends entirely on the downstream thermal load profile. For process heating applications that require sustained moderate temperature output, 1 m/s delivers superior performance. For peak demand response requiring rapid high-temperature bursts, higher velocities are appropriate — but this should be defined in the application spec, not left to the supplier’s default setting.
In supplier qualification, we saw a consistent pattern: suppliers quoting dual-channel architecture could not always provide the actual airflow velocity data from their internal test protocols. Three of five suppliers contacted during a recent review could not supply measured outlet temperature profiles at defined inlet velocities — they provided only rated capacity numbers. That’s a red flag. If a supplier cannot tell you what outlet temperature their unit achieves at 1 m/s inlet flow against a 765 K initial storage temperature, they have not validated their own product.
System-Level Thermodynamic Parameters for Component Matching #
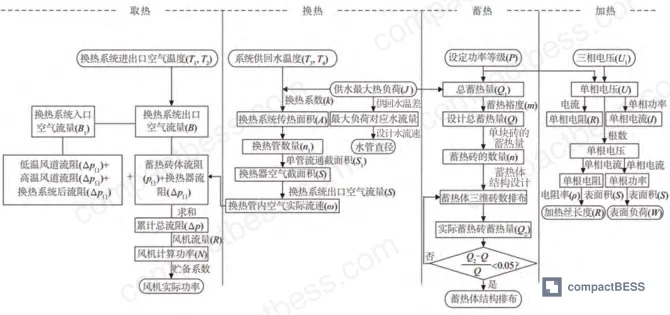
The shell-and-tube heat exchanger used as the reference configuration in the thermal calculation produced a set of system-level parameters that buyers should treat as minimum documentation requirements, not optional technical details.
Heat exchanger parameters (calculated at design conditions):
- Design thermal load: 375 kW
- Inlet air temperature to heat exchanger: 700 K
- Outlet air temperature from heat exchanger: 330 K
- Cold water inlet temperature: 45°C (enthalpy 188.52 kJ/kg)
- Hot water outlet temperature: 55°C (enthalpy 230.31 kJ/kg)
- Required heat exchange area: 255.5 m²
- Water pipe diameter: 86.6 mm
Fan specification:
- Fan power: 7.5 kW
- This is not a rough estimate — it is a calculated output from the coupled thermal model
Heating element parameters:
- Single-phase voltage: 5,774 V
- Single-phase resistance: 0.067 Ω
- Per-element power: 16.67 kW
- Surface load: 11.4 W/m²
- Heating wire resistivity: 1.42 (Ω·mm²)/m
The margin applied to storage capacity — a design storage margin of 1.1 and a storage margin factor of 1.13 — reflects real-world efficiency losses that optimistic datasheet specifications routinely ignore. Design total storage capacity was set at 2,640 kWh against an actual achieved value of 1,482.08 kWh, which reflects the difference between nameplate and operational performance. Procurement teams that evaluate systems purely on nameplate capacity are systematically comparing incompatible figures.
Most procurement teams don’t realize that thermal storage system design standards have been evolving rapidly alongside grid-scale storage deployments. Standards such as IEC 62933-2-1 (electrical energy storage system performance requirements), GB/T 34120 (China national standard for electrochemical energy storage), and ASHRAE 90.1 for energy efficiency in building thermal systems are increasingly referenced in procurement specifications — but vendor compliance with these standards is rarely verified at the component level. Checking paper certification against actual design parameters is a step most quality teams skip.
Additional relevant compliance frameworks for internationally sourced thermal storage systems include ISO 9001:2015 quality management systems, which should be baseline-level verification, not a differentiator.
Practical Guidance for Buyers #
When you’re evaluating solid electric thermal energy storage systems — whether for industrial process heat, district heating integration, or grid-balancing applications — the duct structure specification is the single most technically consequential decision in your procurement. It affects temperature uniformity, discharge duration, heat exchanger sizing, fan energy consumption, and heating element longevity. Every downstream parameter flows from it.
Start by requiring suppliers to submit CFD simulation results or physical test data for temperature uniformity across the storage module cross-section. A maximum temperature differential below 5 K at rated charge conditions is a reasonable threshold. Anything above 20 K should prompt immediate follow-up questions about actual field performance.
Verify that the heat exchange area specification (in m²) matches the calculated thermal load — not just the rated capacity. The gap between these two figures is where oversold systems hide their performance shortfall. Require a complete thermodynamic calculation package: heating element surface load, fan power, heat exchanger area, and storage margin factors as separate line items.
At compactbess.com, we work with procurement engineers and energy integrators sourcing systems across North America, Europe, and the Middle East, connecting them with verified Chinese manufacturers who can supply complete documentation packages — not just datasheet numbers. If you’re qualifying suppliers for solid thermal storage systems and need to separate technically capable manufacturers from those selling on price alone, our team can help you structure the right RFQ.
Need help identifying qualified suppliers for solid electric thermal energy storage systems? Talk to our sourcing team →
Supplier Qualification Questions #
- What is the measured cross-sectional maximum temperature differential in your dual-channel storage module after an 8-hour charge cycle at 300 kW input — and can you provide the CFD validation report or physical test data showing this is below 5 K?
- What is the heating wire surface load in W/m² for your standard configuration, and how does this compare to the 3–8 W/cm² operating range recommended for high-temperature applications? Can you provide the surface load calculation methodology?
- At an inlet air velocity of 1 m/s and an initial storage body temperature of 765 K, what is the maximum measured outlet air temperature during discharge — and do you have test data showing this value at 577 K or above?
- Can you provide the complete thermodynamic calculation package including heat exchange area (target ≥255.5 m² for 375 kW load), fan power specification, and storage margin factors (design margin ≥1.1) used in your system sizing?
- For your magnesium brick storage units, what are the verified material parameters — specifically density (target 3,000 kg/m³), thermal conductivity (target 5 W/(m·K)), and volumetric heat capacity (target 3,390 kJ/(m³·K)) — and can you provide third-party material certification for these values?
Sourcing Checklist #
- [ ] Supplier provides CFD simulation report or physical test data confirming cross-sectional temperature differential ≤5 K at rated charge conditions (reference: dual-channel configuration, 8-hour charge)
- [ ] Heating wire surface load documented at ≤8 W/cm² in line with high-temperature application specifications
- [ ] System thermodynamic calculation package provided as separate document, including heat exchange area calculation, storage margin factor (≥1.1), and fan power sizing
- [ ] Storage module material certification confirms magnesium brick density ≥2,900 kg/m³ and thermal conductivity ≥4.5 W/(m·K)
- [ ] Discharge performance data available at minimum two inlet air velocities (e.g., 1 m/s and 3 m/s), with outlet temperature profiles over full discharge cycle
- [ ] Heat exchanger design documentation shows effective exchange area calculation matched to rated thermal load (≥0.68 m²/kW as reference ratio)
- [ ] Quality management system certified to ISO 9001:2015, with certificate current and scope covering thermal energy storage equipment manufacturing
- [ ] Module-level storage capacity (kWh) stated as actual achieved value, with design margin factors disclosed separately — not as a single nameplate figure
Key Specifications Table #
| Parameter | Recommended Value | Verification Method |
|---|---|---|
| Cross-section max temperature differential | ≤5 K (reference: 2.57 K achieved in dual-channel config) | CFD simulation report or thermocouple array measurement at rated 300 kW, 8-hour charge |
| Heating wire surface load | 3–8 W/cm² (system calc: 11.4 W/m²) | Supplier thermodynamic calculation package; cross-check with element dimensions and power |
| Discharge outlet air temperature | ≥550 K at 1 m/s inlet, initial storage temp 765 K | Physical discharge test with calibrated thermocouple at outlet; log full time-temperature profile |
| Heat exchange area | ≥255.5 m² for 375 kW design load | Engineering drawing with tube count, tube diameter (reference: 86.6 mm), and total surface area calculation |
| Storage module heat capacity (actual) | ≥1,400 kWh per module assembly (8-hour charge at 300 kW) | Calorimetric calculation using: density 3,000 kg/m³ × volume × ΔT; cross-check against simulation output |
| Fan power | ≤7.5 kW for standard airflow configuration | Fan specification sheet; verify against airflow resistance calculation for U-channel duct geometry |
| Storage margin factor | ≥1.1 design margin applied to nameplate capacity | Request margin factor disclosure in thermodynamic calculation document |
Can’t find a supplier meeting these specs? Submit your requirements and we’ll match you within 48 hours.
Frequently Asked Questions #
Why does duct geometry matter more than total storage capacity when comparing solid thermal storage systems?
Total storage capacity is a calculated output — it depends entirely on how efficiently the stored heat can be extracted, which is governed by the airflow path geometry. A straight single-channel system with 87 K cross-sectional temperature differential effectively means a large fraction of the storage mass is either over-heated or under-utilized during any given cycle. The dual-channel U-type configuration doubles the effective flow path, reduces temperature maldistribution to under 3 K, and significantly extends the discharge window. Two systems with identical rated kWh figures can have dramatically different real-world performance if their duct configurations differ.
What is a realistic actual-to-nameplate storage efficiency ratio for these systems?
Based on the thermal calculations reviewed, expect actual achieved storage to be approximately 56–62% of design total storage capacity under standard operating conditions. The reference system showed 1,482.08 kWh actual against a 2,640 kWh design figure — a ratio of about 56%. This gap is normal and accounts for thermal losses, charge cycle limitations, and design margin factors. Suppliers who quote 100% nameplate efficiency are either measuring under unrealistic conditions or not accounting for real operational losses.
What inlet air velocity should I specify for maximum heat extraction during discharge?
For maximum outlet temperature and longest discharge duration, 1 m/s is optimal — this produced a 577.01 K peak outlet temperature with the slowest temperature decay profile. For faster discharge cycles at the cost of outlet temperature, 3–5 m/s is appropriate. The right answer depends on your downstream thermal load profile. Specify this in your RFQ and require the supplier to provide test data at your target velocity, not just at their default test condition.
Is magnesium brick the correct storage material choice, or are there alternatives?
Magnesium brick has a well-established track record in solid thermal storage: density 3,000 kg/m³, thermal conductivity 5 W/(m·K), volumetric heat capacity 3,390 kJ/(m³·K), and a service life approximately twice that of electrode boilers. The material is also cost-competitive relative to molten salt systems and can operate at higher storage temperatures. For most industrial thermal storage applications in the 600–1,100 K range, it remains the reference material. Alternatives exist but require separate qualification data — don’t accept a substitution without equivalent material certification.
Which international standards should I reference when qualifying solid thermal storage suppliers?
At minimum, verify against IEC 62933-2-1 for electrical energy storage performance, ISO 9001:2015 for quality management, and ASHRAE 90.1 if the system integrates with building HVAC. For systems exported to or from China, GB/T 34120 applies to electrochemical storage, though solid thermal systems may fall under separate national standards. Always confirm which standard your supplier’s documentation is written to — and verify it applies to the actual product configuration, not just the company’s broader manufacturing scope.
For additional technical background on cell-level energy storage formats and thermal management, see our guides on energy density and power density selection and cell formats and form factors.
Published by compactbess.com Technical Team | Request a sourcing quote
Data source: Airflow Duct Geometry Optimization and Thermodynamic System Design for High-Temperature Solid Electric Thermal Energy Storage, J. Du et al., Energy Storage Materials, 2024
Content reviewed by dr.james.okafor | © compactbess.com — All rights reserved. Unauthorized reproduction prohibited.


