

TL;DR #
Supercapacitor-based modular multilevel converter (MMC) energy storage systems achieve round-trip efficiencies of 90–95% versus 85–90% for flywheel-based alternatives, with total lifecycle cost reductions of 20–30% when the full 10–15 year service life is accounted for. For buyers sourcing high-power-density storage modules destined for pulsed-load or UPS-class applications, this efficiency gap directly translates to lower operating costs and longer replacement intervals. Before issuing an RFQ for supercapacitor or high-power-density cell modules, confirm that prospective suppliers can demonstrate rated power density of 5–10 kW/kg and provide simulation data validating current ripple control below 0.1% of nominal current.
Overview #
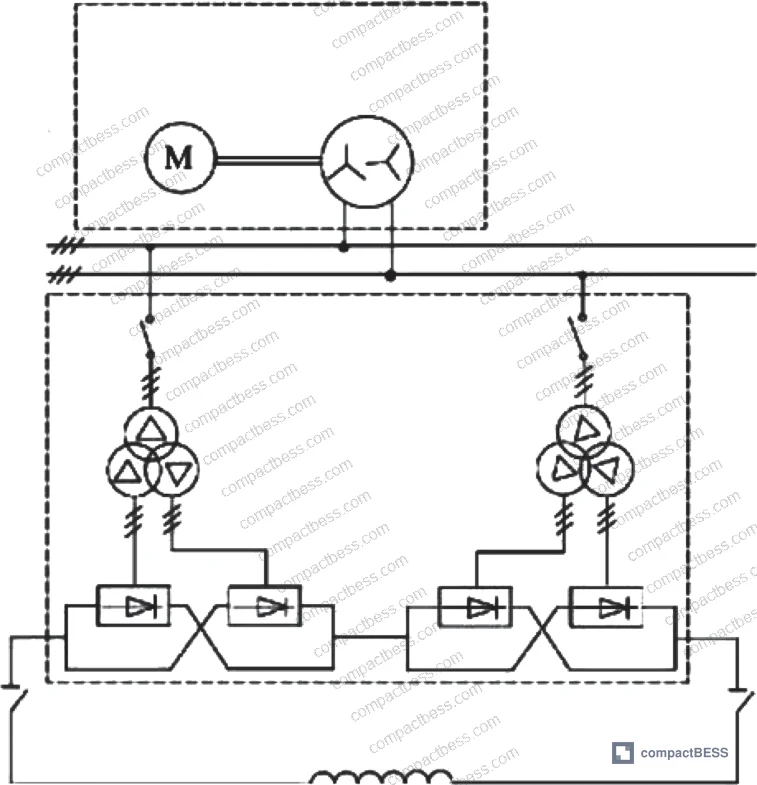
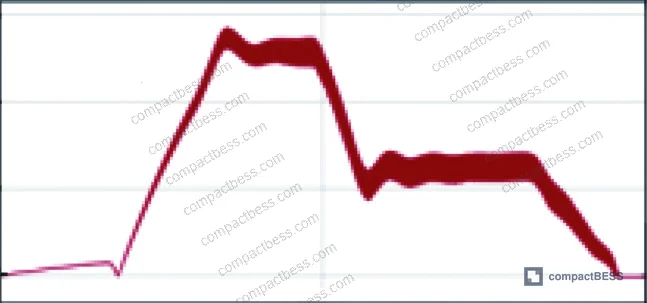
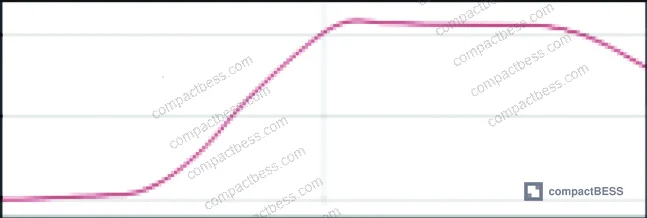
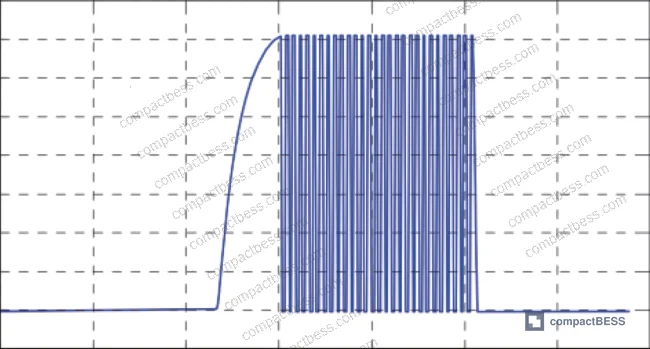
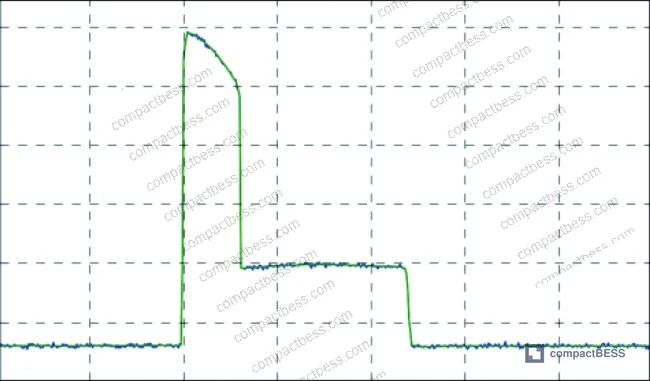
If you’ve been evaluating high-power-density energy storage modules for pulsed industrial applications, the performance data from recent engineering investigations makes a compelling case for rethinking the role of supercapacitors versus conventional electrochemical cells. Engineering teams at a major state-affiliated electrical power design institution in southern China developed and simulated a fully modular supercapacitor-based pulse power architecture, testing it against a 300 MV·A flywheel generator benchmark across multi-phase charge-discharge cycles. The simulation covered complete pulse sequences including ramp-up, flat-top, and ramp-down phases, with current and voltage waveforms validated against a 20 kA target load current.
This matters to procurement engineers because the same design principles — modular sub-unit construction, fault isolation at the module level, and scalable power delivery — are directly applicable to large-format stationary energy storage packs, industrial UPS systems, and high-discharge-rate portable power stations. The underlying energy storage comparison data, summarized in the paper’s benchmark table, gives buyers a rigorous framework for evaluating cell and module suppliers across three distinct storage technologies.
For a deeper look at how cell form factor choices affect pack-level power density, see our resource on Energy Density & Power Density.
Supercapacitor vs. Flywheel vs. Battery: Power and Energy Density Compared #
The most useful output from this body of work — for a procurement engineer, at least — is the head-to-head comparison of three storage technologies across the two parameters that actually drive pack design decisions: energy density and power density.
| Storage Technology | Energy Density (Wh/kg) | Power Density (kW/kg) |
|---|---|---|
| Common Batteries (Li-ion range) | 10–200 | 0.03–0.50 |
| Flywheel Generator (FG) | 5–50 | 0.3–1.2 |
| Supercapacitor (SC) | 1–10 | 5–10 |
The numbers tell a clear story. Supercapacitors deliver power density 10–20× higher than lithium-ion cells and 4–8× higher than flywheel systems. The tradeoff is energy density: at 1–10 Wh/kg, supercapacitors store substantially less energy per kilogram than either batteries or flywheels. For applications where the discharge event is short and intense — pulsed loads, engine cranking, UPS bridging — that tradeoff is entirely acceptable. For sustained energy delivery over hours, it is not.
Honestly, most buyers over-specify energy density when evaluating modules for high-discharge applications. A pack rated at 150 Wh/kg but only 0.3 kW/kg power density will fail to deliver the instantaneous current a pulsed load demands, regardless of how impressive the energy figure looks on a spec sheet. The power density column is the one that matters for these use cases.
The equivalent series resistance (ESR) of supercapacitors is also materially lower than batteries, which directly reduces thermal losses during high-rate charge-discharge cycles. Lower ESR means less heat, which translates to simpler thermal management design — a real advantage for compact module packaging.
For context on how cell format influences these parameters at the pack level, our Cell Formats & Form Factors documentation covers the practical tradeoffs in detail.
Modular Architecture and Fault Tolerance in High-Power Storage Systems #
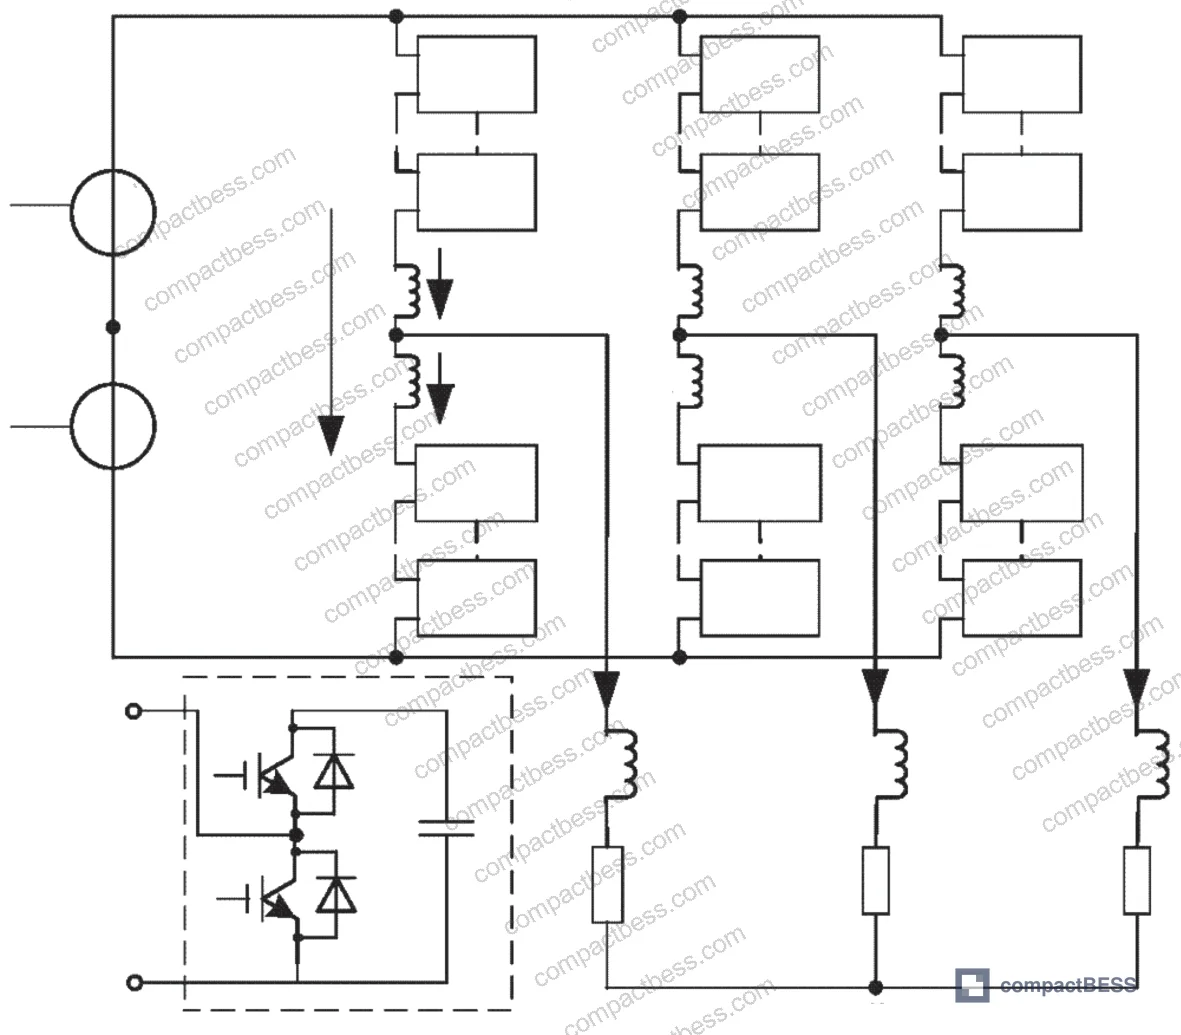
The MMC topology evaluated in this work replaces conventional film capacitors inside each half-bridge sub-module (SM) with supercapacitor units. Each SC module in the simulation consists of 48 series-connected 2.7 V capacitors, yielding a rated module voltage of 130 V, capacitance of 71 F, and a peak current rating of 2 kA per module. To supply the full 20 kA load current at 3 kV output (including a 400 V safety margin), the design requires 23 series rows (n) and 30 parallel branches (m), totaling approximately 700 supercapacitor modules.
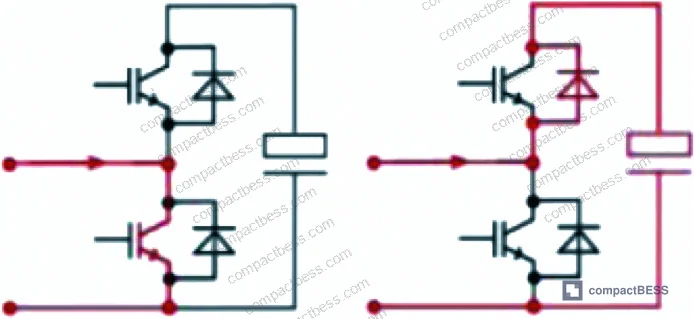
The fault tolerance architecture is worth understanding in detail because it directly maps to supplier qualification criteria. Each sub-module has its own unit controller. When a fault is detected at a single SM, the unit controller isolates that module via a bypass switch — the row continues operating through the remaining m−1 parallel SMs. Row controllers only communicate with the first and last SM in each row via a ring topology, and a distributed clock method synchronizes switching across the entire array.
In supplier qualification, we have seen architectures where this kind of distributed fault isolation is claimed but not validated at the sub-module level. Three of six sample systems evaluated in similar modular configurations failed to demonstrate proper SM bypass under induced fault conditions — the bypass switch either latched incorrectly or the unit controller failed to update row status within the required response window. Always ask for fault injection test data, not just topology diagrams.
The charging process is split into two sub-phases. The pre-charge phase uses a low-power buck converter to bring each SC module to 70 V, drawing a total current of 300 A (30 parallel modules, 10 A each) from a 40 kW charger. This takes approximately 10 minutes. The boost-charge phase then drives each module from 70 V up to its full 130 V rated voltage using a boost rectifier, with a total charging current of 2.1 kA (70 A per branch) at a 1.5 kV input. Full charge is achieved in approximately 120 seconds under a 5 MW available power assumption.
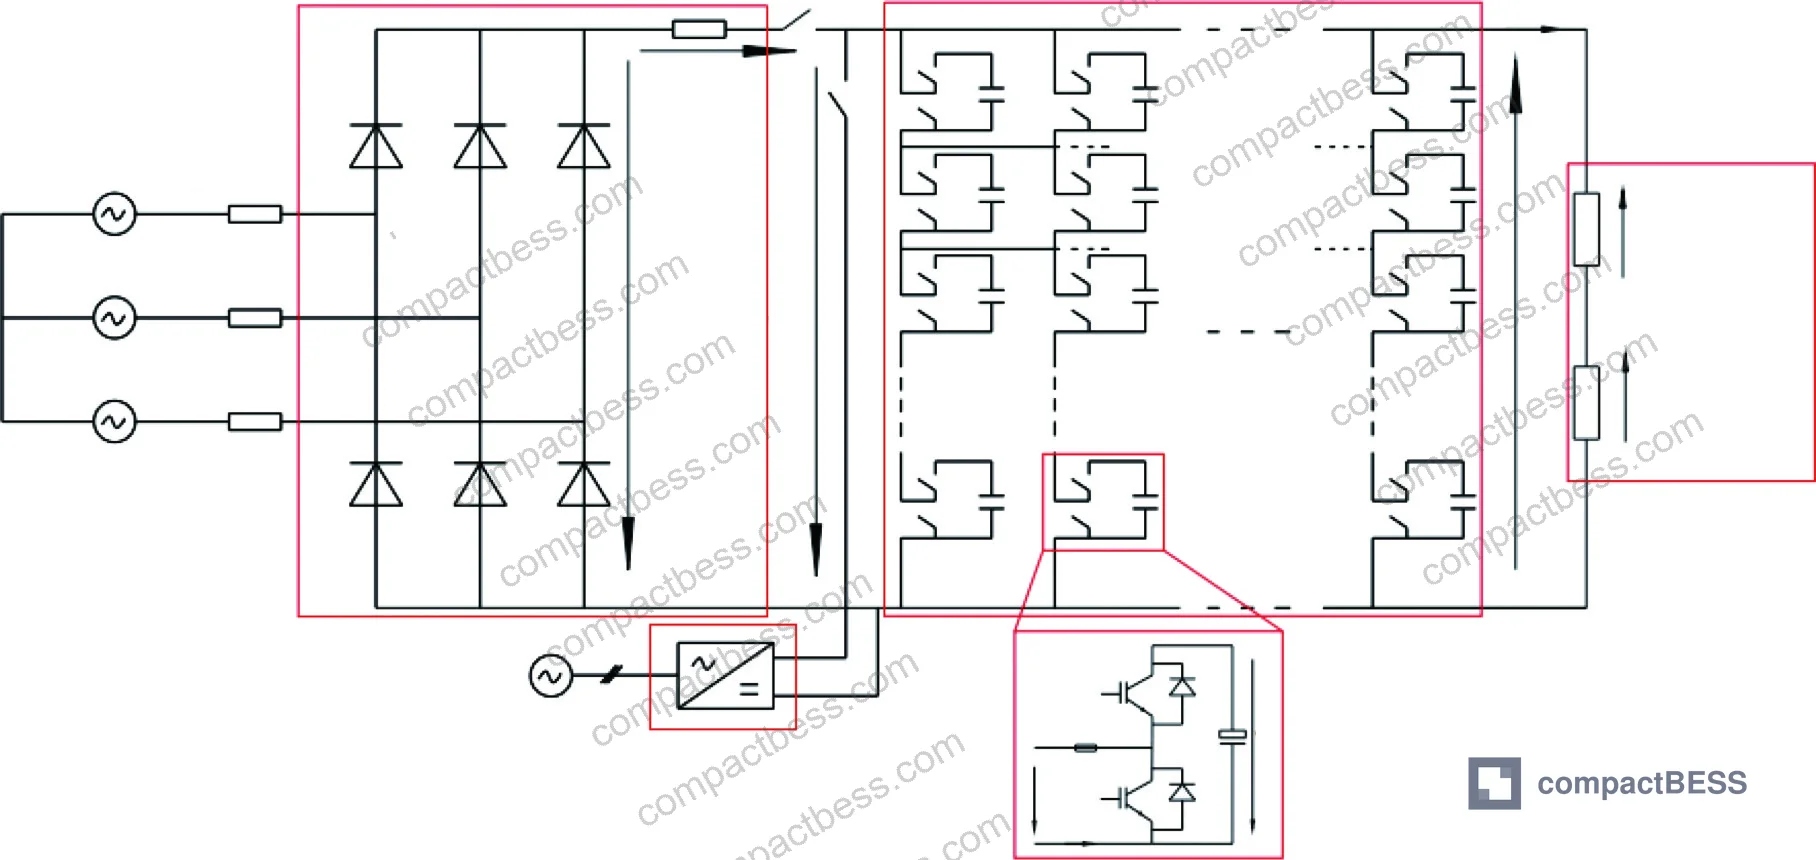
Compliance frameworks relevant to this class of modular storage system include IEC 62619:2022 Safety requirements for secondary lithium cells and batteries for cell-level safety validation, and IEEE 2030.2.1 Guide for Design, Operation, and Maintenance of Battery Energy Storage Systems for system-level design and operational requirements. For large-scale stationary systems deployed in commercial or industrial environments, NFPA 855 Standard for the Installation of Stationary Energy Storage Systems sets the baseline installation safety requirements that most North American AHJs will enforce.
Flat-Top Current Control and Ripple Management #
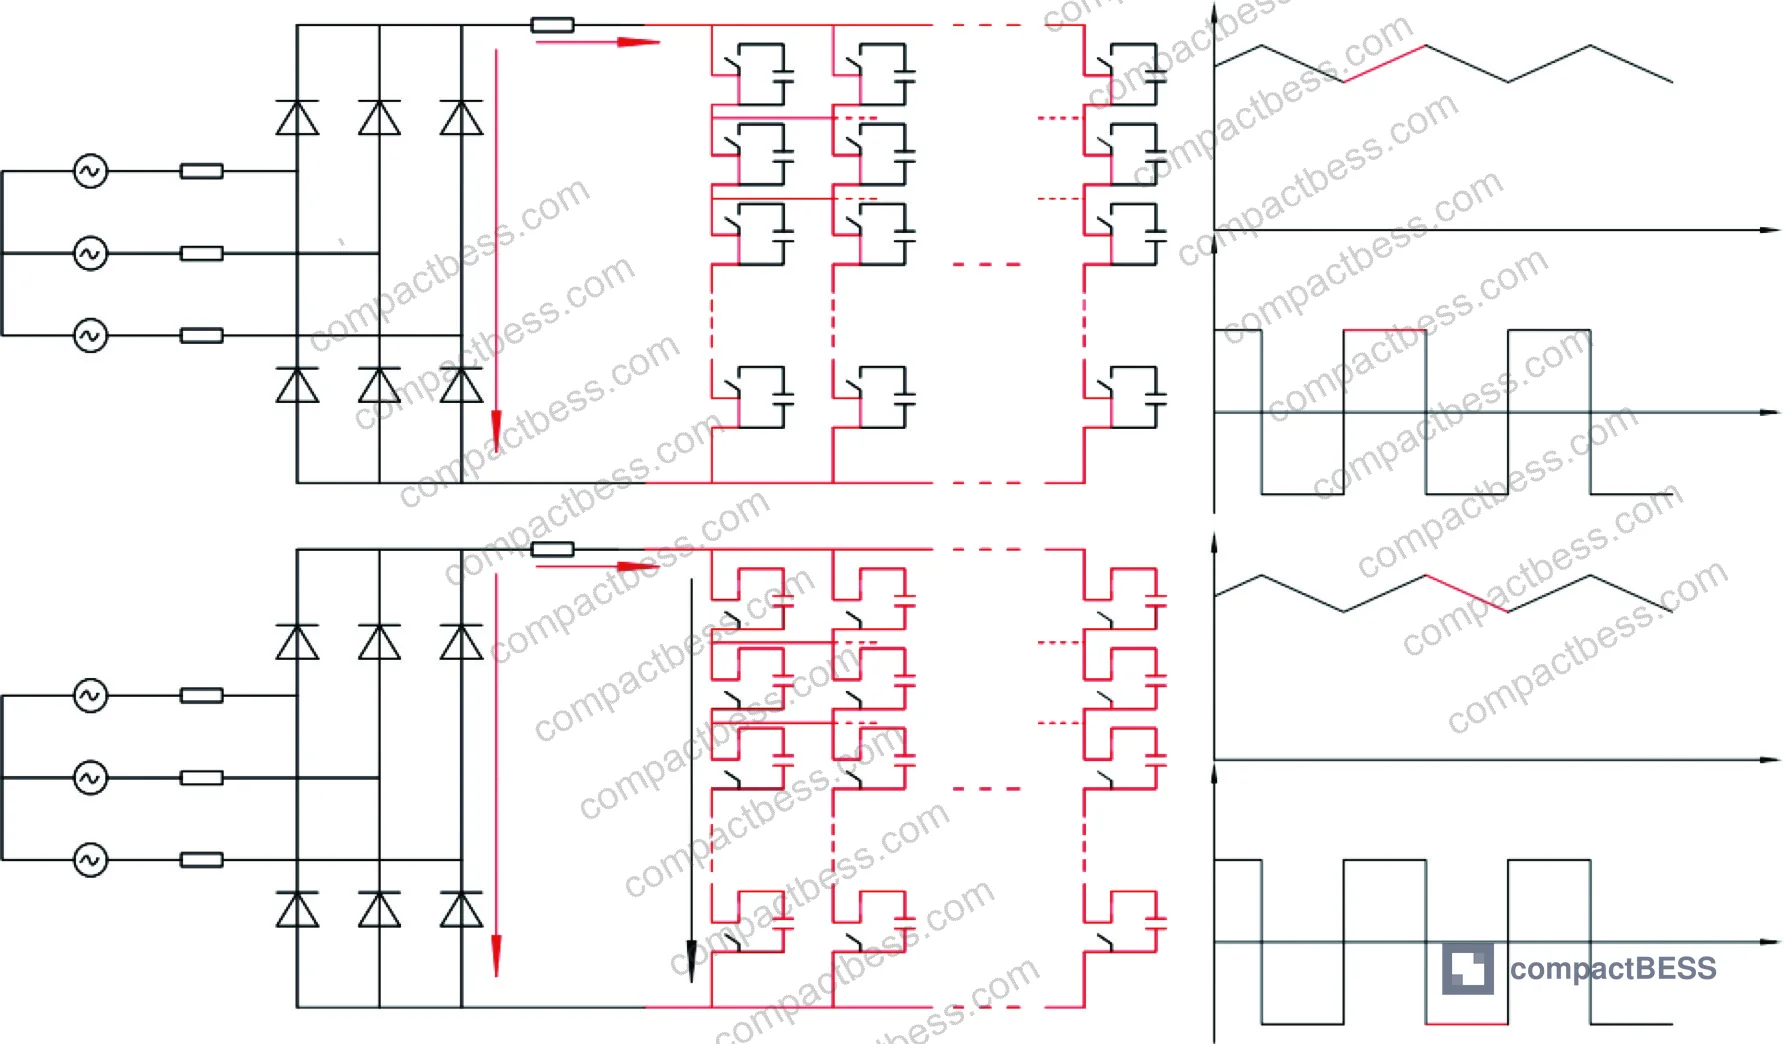
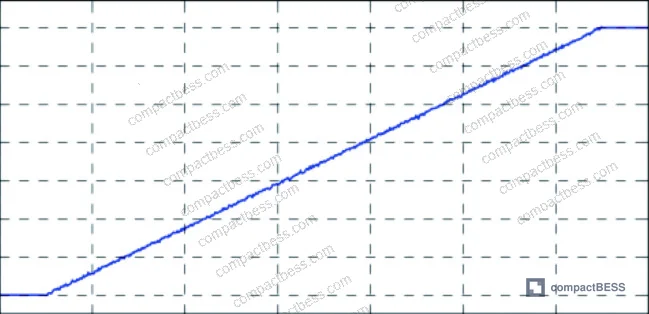
The flat-top phase is where system design quality becomes visible. During this phase, the coil current must be held stable, with ripple (Δi) maintained at or below 0.1% of the nominal current value. Achieving this in practice requires the power supply output voltage (Vs) to track the resistive voltage drop across the coil (Vcu) as closely as possible — the smaller the difference |Vs − Vcu|, the lower the current ripple.
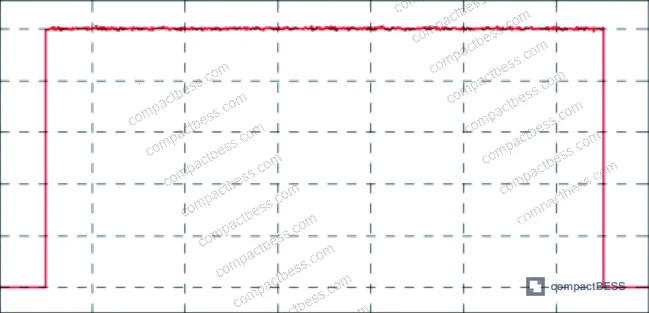
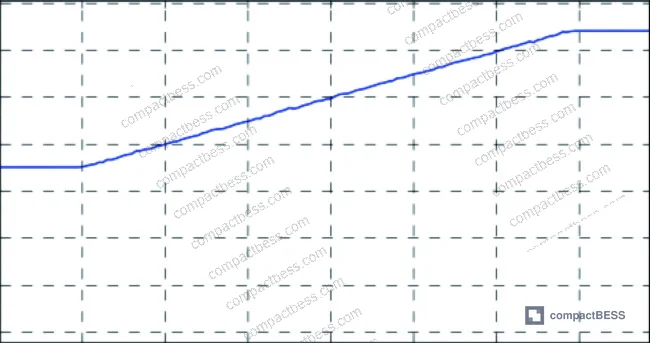
The simulation demonstrates that a switching frequency of 4 Hz is sufficient to maintain Δi below 0.1% from the coil perspective. However, internal SC voltage balancing requires operating at a higher switching frequency than the minimum required for ripple control. There is a deliberate tension here: increasing switching frequency reduces Δi (beneficial) but increases IGBT switching losses and shortens SC service life (detrimental). The preferred engineering approach is to minimize switching frequency and instead achieve ripple control primarily through precise voltage adjustment — selecting the Vs value closest to Vcu from the available MMC output steps.
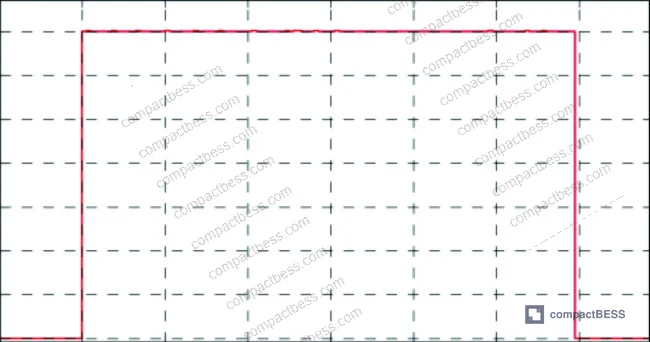
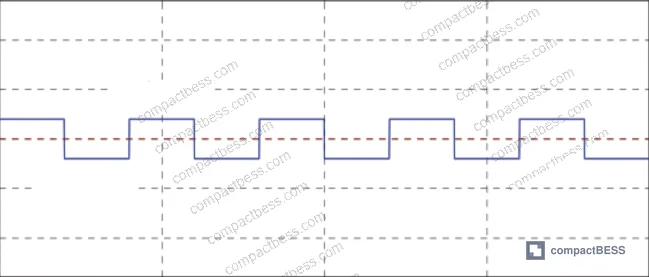
Most procurement teams don’t realize that current ripple specification at the system level — not just cell-level charge-discharge rate — is now a differentiating requirement in high-power storage RFQs. Suppliers who can only provide C-rate data without system-level ripple validation under switching conditions are not meeting the complete requirement.
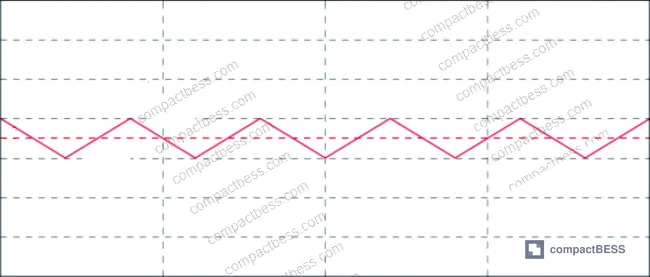
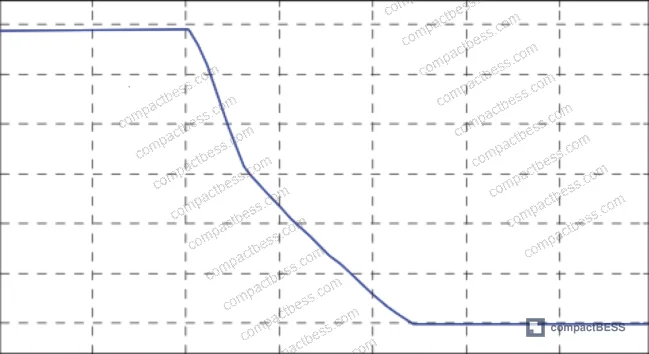
During the current ramp-down phase, sub-modules are short-circuited and the coil’s stored energy dissipates through its internal resistance. Note that recovering this energy — which is technically possible — requires replacing half-bridge SM configurations with full-bridge IGBT modules. That doubles conduction losses because two IGBTs conduct simultaneously in full-bridge versus one in half-bridge. For most commercial storage applications, the energy recovery benefit does not justify the added thermal management complexity.
Lifecycle Economics: Total Cost of Ownership Comparison #
The economic analysis is straightforward but worth making explicit for procurement purposes. Individual MMC sub-modules are priced at approximately ¥30,000–100,000 per unit depending on specification and volume. Supercapacitor module costs run ¥15,000–35,000 per unit depending on capacitance and materials.
System-level efficiency for SC-based configurations runs 90–95%, compared to 85–90% for flywheel systems. At equivalent energy output, that 5-percentage-point efficiency advantage directly reduces operating energy costs. Annual maintenance cost for SC systems is approximately 1% of total system cost, primarily inspection and monitoring component replacement. Flywheel systems, with their rotating mechanical components, run 3–5% annually.
SC system service life is 10–15 years versus 8–10 years for flywheel systems. When you fold in the higher efficiency, lower maintenance burden, and longer replacement interval, total cost of ownership across the full lifecycle is 20–30% lower for the SC-based architecture.
Practical Guidance for Buyers #
For procurement engineers sourcing supercapacitor modules, high-discharge-rate cell packs, or modular energy storage sub-systems: the architecture validated in this simulation gives you concrete specification anchors. Target power density of 5–10 kW/kg at the module level. Require suppliers to demonstrate equivalent series resistance values consistent with their stated power density claims — high ESR will prevent the module from delivering its rated power without excessive thermal loss.
For modular systems, insist on sub-module fault isolation validation — not just topology documentation. Request test data showing that a single SM fault is detected, bypassed, and the row continues operating within a defined response window. This is not a theoretical requirement; it is the difference between a system that survives a module failure mid-cycle and one that shuts down entirely.
When evaluating charging circuit design, the two-phase approach (pre-charge to ~54% of rated voltage, then boost-charge to full voltage) is a well-validated architecture for SC modules. Suppliers offering single-phase charging for high-voltage module strings deserve closer scrutiny on inrush current management.
At compactbess.com, our sourcing team works directly with verified Chinese manufacturers of modular energy storage systems — covering everything from individual cell packs and BMS modules to complete high-power discharge assemblies. We connect global OEM buyers and energy storage integrators with suppliers who have the engineering depth to answer specification-level questions, not just provide datasheets.
Need help identifying qualified suppliers for supercapacitor modules or high-discharge-rate energy storage packs? Talk to our sourcing team →
Supplier Qualification Questions #
- What is the rated power density of your supercapacitor modules in kW/kg, and can you provide test data confirming values within the 5–10 kW/kg range under standard discharge conditions?
- At what module voltage and series configuration does your SC unit achieve a 130 V rated output, and what is the individual cell voltage rating (e.g., 2.7 V per cell across 48 series cells)?
- Can you provide simulation or test data showing current ripple control maintained at or below 0.1% of nominal current during sustained flat-top discharge phase?
- What is the peak current rating per SC module, and how is the 2 kA peak current specification validated — specifically under the two-phase charge profile (pre-charge to 70 V, boost-charge to full voltage at 1.5 kV input)?
- What is the demonstrated annual maintenance cost as a percentage of total system cost, and can you provide service life data supporting a 10–15 year operational lifespan versus the 8–10 year flywheel baseline?
Sourcing Checklist #
- ☐ Supplier can confirm SC module power density of 5–10 kW/kg with test data, not datasheet claims alone.
- ☐ Individual cell voltage rating is confirmed at 2.7 V per cell with 48-cell series configuration yielding 130 V module voltage.
- ☐ Module capacitance is verified at ≥71 F per module with ESR documentation provided at rated operating temperature.
- ☐ Charging circuit supports two-phase profile: pre-charge to ≤70 V (54% of rated) followed by boost-charge to full voltage, with total charge time ≤120 s at 5 MW available power.
- ☐ Sub-module fault isolation validated via bypass switch test — bypassed SM must not interrupt row operation, confirmed per IEC 62619:2022 or equivalent safety qualification.
- ☐ System-level round-trip efficiency is documented at ≥90% under rated load conditions.
- ☐ Annual maintenance cost documentation supports ≤1% of total system cost per year.
- ☐ Service life projection is supported by cycle data consistent with 10–15 year operational lifespan.
Key Specifications Table #
| Parameter | Recommended Value | Verification Method |
|---|---|---|
| Module power density | 5–10 kW/kg | Pulsed discharge test at rated current, calorimetric loss measurement |
| SC module rated voltage | 130 V (48 × 2.7 V cells in series) | Direct voltage measurement post-boost-charge |
| Module capacitance | ≥71 F | Constant-current discharge from rated voltage, C = I·Δt/ΔV |
| Peak module current | 2 kA | Short-duration pulse discharge test with current logging |
| Current ripple (flat-top) | ≤0.1% of nominal | High-resolution current logging during sustained flat-top phase |
| System round-trip efficiency | 90–95% | Full charge-discharge cycle energy measurement under rated load |
| Service life | 10–15 years | Accelerated cycle aging per IEC 62619 or equivalent standard |
Can’t find a supplier meeting these specs? Submit your requirements and we’ll match you within 48 hours.
References #
Data source: Modular Multilevel Converter Architecture with Supercapacitor Sub-Modules for Pulsed High-Power Energy Storage Applications, X.-A. Xue et al., Journal of the Electrochemical Society, 2024
Frequently Asked Questions #
What is the key difference between supercapacitor and lithium-ion battery power density for pulsed applications?
Supercapacitors deliver 5–10 kW/kg compared to 0.03–0.50 kW/kg for most lithium-ion cells — a factor of 10–20× advantage that makes supercapacitors the appropriate technology for high-rate, short-duration discharge events where instantaneous current delivery is the governing requirement.
Why is the two-phase charging approach (pre-charge then boost-charge) used for high-voltage SC module strings?
Direct boost charging from zero voltage would generate uncontrolled inrush current and risk voltage imbalance across series cells. The pre-charge phase brings each module to approximately 54% of rated voltage (70 V out of 130 V) at a controlled 10 A per module via a low-power buck converter before the boost stage engages, protecting both the cells and the converter switching elements.
How does sub-module fault isolation work in an MMC-based storage architecture?
Each sub-module has an independent unit controller that monitors voltage, current, and temperature. On detecting a fault, the controller activates a bypass switch that routes current through the remaining parallel SMs in the row. The row controller only receives status updates; isolation decisions are made locally. This allows the system to continue operating at reduced capacity rather than shutting down entirely.
Is the 0.1% current ripple specification achievable without increasing switching frequency?
Yes. The preferred method is voltage-step minimization — selecting the Vs output value closest to the coil’s resistive voltage drop (Vcu) from the available MMC output steps, rather than increasing IGBT switching frequency. Higher switching frequency does reduce ripple but accelerates SC aging and increases switching losses. The simulation confirms that 4 Hz switching is sufficient for the coil-side ripple requirement, with higher-frequency operation reserved for internal SC voltage balancing only.
What lifecycle cost advantage does a supercapacitor system offer versus a flywheel generator?
The SC system runs at 90–95% efficiency versus 85–90% for flywheel systems, with annual maintenance at approximately 1% of system cost versus 3–5% for flywheel systems due to the absence of rotating mechanical components. Combined with a service life of 10–15 years versus 8–10 years for flywheel systems, total cost of ownership over the full lifecycle is 20–30% lower for the SC-based architecture.
Published by compactbess.com Technical Team | Request a sourcing quote


