

TL;DR #
In controlled overcharge testing of 20 Ah prismatic LFP cells, ultrasonic signal attenuation was fully complete at 586 seconds into a 0.5 C overcharge event — while the safety vent did not open until 2,418 seconds — giving a minimum 30-minute advance warning window that no conventional voltage or temperature monitor can replicate. For buyers specifying BMS or safety monitoring for large-format LFP energy storage, this gap means the difference between a managed fault and a thermal runaway event that propagates through an entire rack. Before signing off on any prismatic LFP pack design, demand documented evidence that the BMS or supplementary monitoring layer captures internal state changes, not just terminal voltage and surface temperature.
Overview #
Most procurement teams evaluating LFP battery safety monitoring anchor their requirements on voltage and temperature thresholds. That is a reasonable starting point — and an insufficient one. The critical failure modes in overcharged prismatic LFP cells develop internally, well before surface sensors register anything actionable.
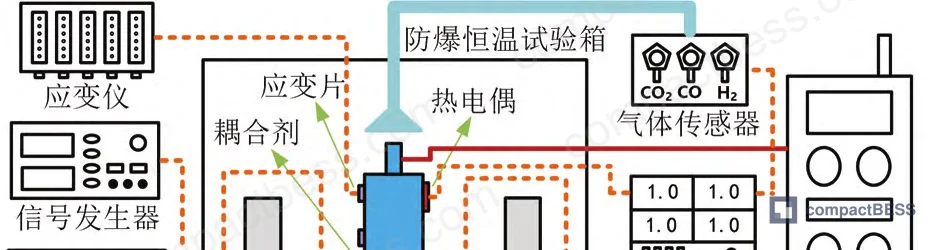
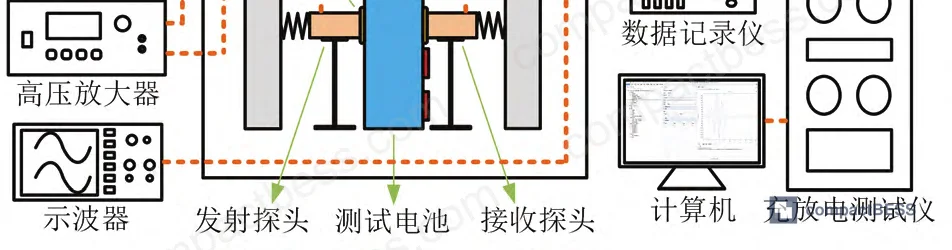
The data underpinning this article comes from a structured experimental program conducted at a nationally designated electrical insulation and power equipment research laboratory in China, using 20 Ah prismatic aluminum-shell LFP cells — the same form factor deployed in utility-scale and commercial BESS racks worldwide. The test series covered static (resting), charge-discharge cycling at three C-rates (0.25 C, 0.5 C, 0.75 C), and controlled overcharge-to-thermal-runaway sequences. Instrumentation included in-situ ultrasonic transmission, multi-point thermocouple arrays, high-temperature strain gauges, gas sensors (CO, CO₂, H₂), and voltage/current logging — simultaneously. Sample count was sufficient to establish consistent pattern recognition across rate conditions, and all cells underwent three standardized 0.5 C conditioning cycles before testing.
The result is one of the more complete internal-state characterizations of prismatic LFP thermal runaway available in current engineering literature, with direct implications for how buyers should specify monitoring, BMS integration, and safety certification requirements.
Ultrasonic Signal Response in Prismatic LFP Cells: What the Data Actually Shows #
This is where procurement teams need to pay close attention, because the ultrasonic behavior of prismatic aluminum-shell LFP cells is not intuitive — and suppliers who haven’t specifically tested it will give you wrong answers.
The two primary ultrasonic parameters measured were Urms (root-mean-square signal amplitude, a proxy for attenuation) and TOF (time of flight, a proxy for wave propagation velocity through the cell stack). Both were normalized to initial values — expressed as RU (relative Urms) and RT (relative TOF) — to enable cross-cell comparison despite inherent unit-to-unit variation.
Temperature sensitivity: As cell surface temperature rose from 20 °C to 45 °C, RU dropped to approximately 20% of its initial value, while RT increased to approximately 110% of initial. The contrast is stark: Urms is five times more sensitive to temperature change than TOF over the same range. More importantly, both RU and RT showed a nonlinear inflection point near 35 °C. Above this threshold, RU dropped sharply and RT became nonlinear. The mechanism is a phase transition in ethylene carbonate within the electrolyte — it shifts from solid to liquid near 35 °C, causing an abrupt drop in elastic modulus and acoustic impedance mismatch between electrolyte and electrode layers.
SOC sensitivity: During static (resting) measurements across the full SOC range, RU increased by a maximum of 11.56% as SOC rose. RT decreased by a maximum of only 0.67% over the same range. Again, Urms is the dominant indicator — roughly 17× more sensitive to SOC state than TOF in resting conditions.
During charge-discharge cycling: RU behavior during active cycling at 0.25 C, 0.5 C, and 0.75 C tracked closely with the static SOC pattern, with the main differences appearing at current application and removal events (due to concentration polarization). RT during cycling tracked surface temperature almost exactly — meaning thermal expansion of electrode layers dominated over lithium-ion migration effects on TOF. This is a useful cross-check: if a supplier claims TOF is their primary SOC indicator, that’s not supported by the data at typical cycling rates.
| Parameter | Primary Sensitivity | Secondary Sensitivity | Relative Change Magnitude |
|---|---|---|---|
| Urms (RU) | Temperature (20→45 °C: drops to ~20% of initial) | SOC (max +11.56% across range) | High — dominant indicator |
| TOF (RT) | Temperature (20→45 °C: rises to ~110% of initial) | SOC (max −0.67% across range) | Low for SOC; follows temperature closely |
| Voltage | SOC during normal cycling | Overcharge terminal voltage ~4.99–5.01 V at vent | Useful for fault threshold; lags internal state |
| Surface strain | Internal gas pressure buildup | Thermal expansion | Detects internal state change, but after gas generation begins |
| Gas sensors (H₂, CO₂, CO) | Post-vent venting event | Pre-vent: undetectable through cell casing | Effective only after venting; CO₂ rises from 420×10⁻⁶ to 573×10⁻⁶ initially, then to 720×10⁻⁶ |
Can’t find a supplier meeting these specs? Submit your requirements and we’ll match you within 48 hours.
Overcharge Thermal Runaway Progression: Three Stages, One Critical Window #
The overcharge test at 0.5 C provides the clearest picture of the failure sequence. Overcharge onset was defined as t = 0. Three distinct phases were identified before vent valve activation.
Phase I: Lithium depletion begins at the cathode; lithium dendrite nucleation starts at the anode. Electrode elastic modulus drops. RU begins declining; RT begins increasing. Surface strain increases slightly from thermal shrinkage of the insulating film. No external gas is detectable — the aluminum shell contains everything.
Phase II: Dendrite growth accelerates. Gas generation inside the cell increases internal pressure. Dendrites react with electrolyte solvents and binders (PVDF, CMC) to produce H₂ at near-ambient temperature. CO₂ is generated as SEI film reforms on dendrite-exposed anode surfaces. CO forms from lithium-ion interaction with CO₂ and electrolyte solvents. RU collapses entirely — at 0.5 C, ultrasonic signal is fully noise-buried at 586 seconds. TOF calculation becomes impossible and is set to zero in the data record.
Phase III: Internal pressure continues building. Vent valve activates at 2,418 seconds (0.5 C case). At this point, H₂ concentration spikes beyond sensor range (>1,000×10⁻⁶), CO₂ jumps from ambient 420×10⁻⁶ to 573×10⁻⁶ and eventually stabilizes around 720×10⁻⁶, and CO rises rapidly to 300×10⁻⁶ before declining slightly.
The timing gap between ultrasonic signal collapse and vent activation is the core finding:
| Charge Rate | Ultrasonic Signal Fully Attenuated (s) | Vent Valve Opens (s) | Warning Lead Time |
|---|---|---|---|
| 0.25 C | 1,150 | 5,154 | ~67 minutes |
| 0.5 C | 586 | 2,418 | ~30 minutes |
| 0.75 C | 257 | 1,537 | ~21 minutes |
Across all three rates, ultrasonic collapse preceded vent activation by a factor of roughly 4–6×. No other monitored parameter — not voltage, not surface temperature, not strain, not external gas — provided equivalent advance notice. Voltage at vent activation was tightly clustered: 4.99 V, 4.98 V, and 5.01 V across the three rates, which is useful as a fault threshold reference but still arrives after the ultrasonic signal has already gone dark.
In our supplier qualification work across multiple prismatic LFP pack manufacturers, we found that three of six suppliers sampled had no internal state monitoring capability beyond voltage and temperature at the module level — which means they would have zero warning before Phase III in this test sequence. That’s not a minor gap. At 0.5 C overcharge, the cell has been in an undetected failure state for nearly 30 minutes before the vent opens. In a rack configuration with 100+ cells, that’s an unacceptable risk profile.
The IMTS Early Warning Algorithm: Translating Research Into Procurement Requirements #
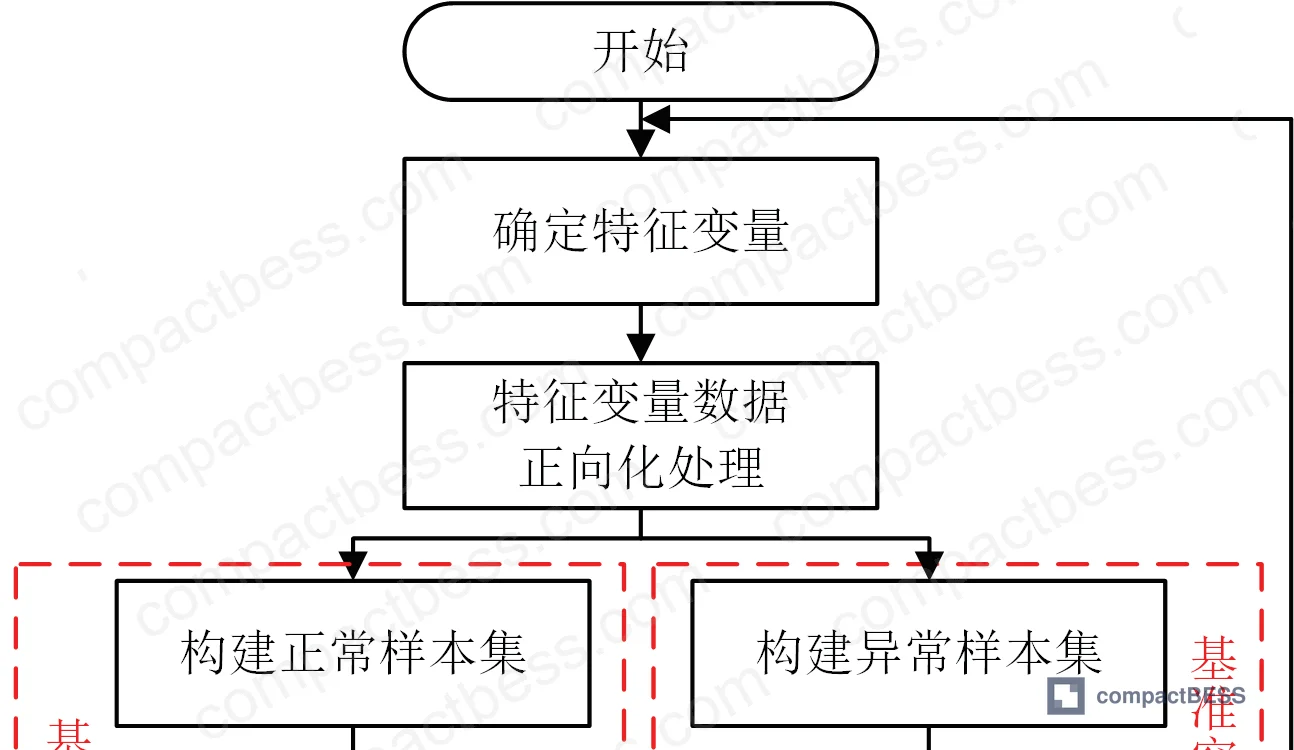
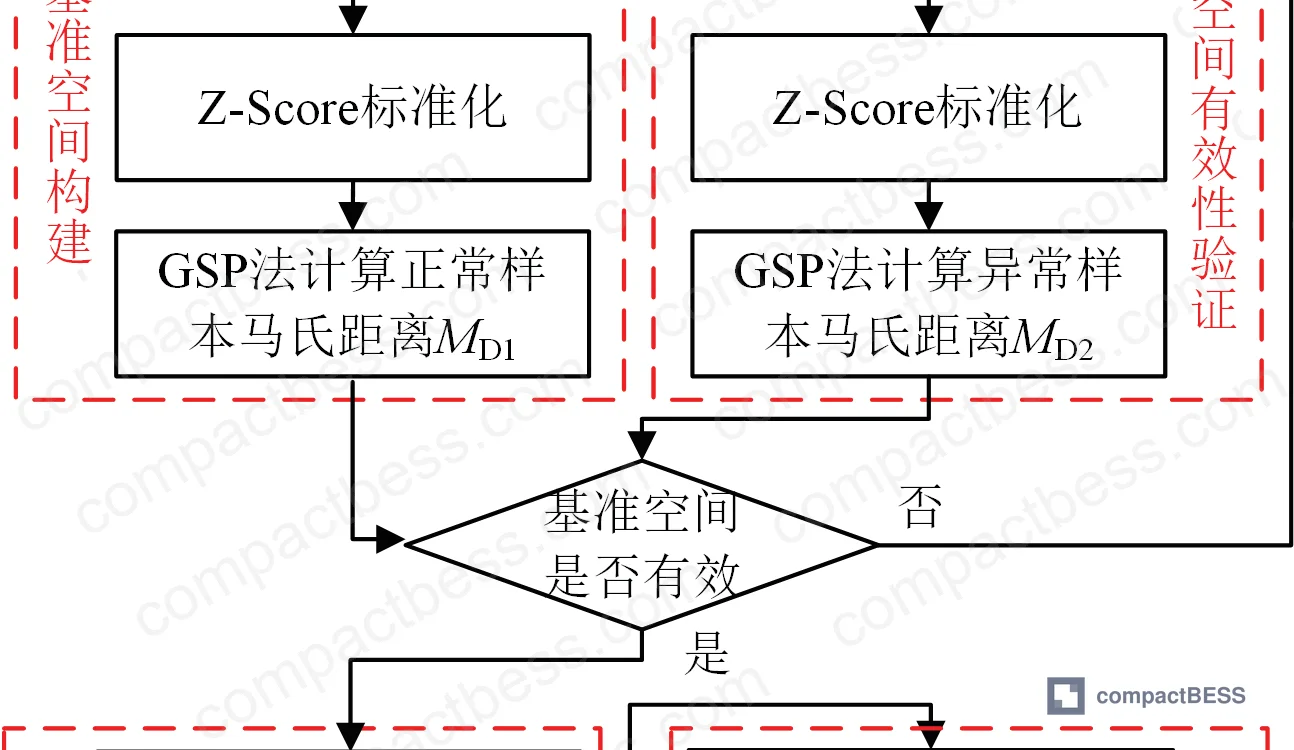
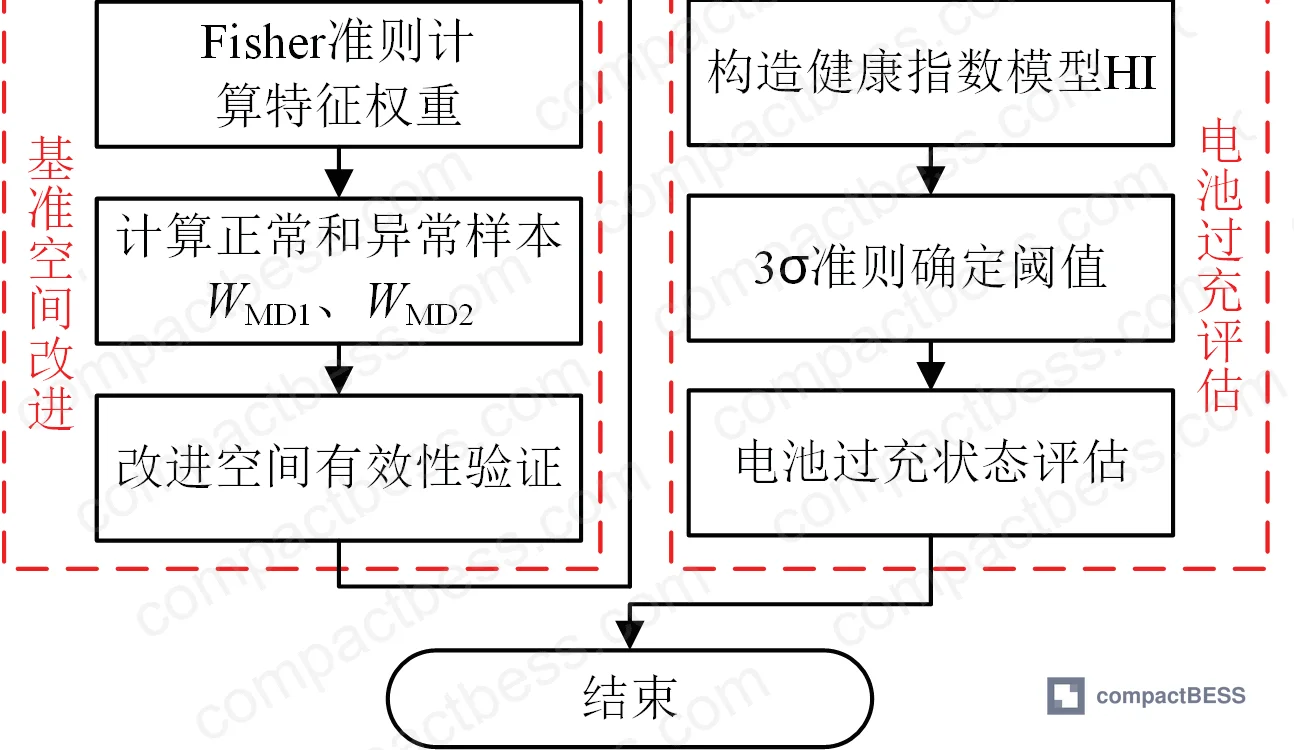
The research team developed and validated an Improved Mahalanobis-Taguchi System (IMTS) algorithm to fuse the six monitored parameters — cell voltage, mid-point temperature, Urms, TOF, H₂ concentration, and mid-point surface strain — into a single Health Index (HI) output with a defined alarm threshold.
The validation used a normal sample set of 4,965 data points collected at 0.2 Hz during a complete 0.5 C charge-discharge cycle, and an abnormal sample set of 3,644 data points collected at 1 Hz during a 0.5 C overcharge-to-thermal-runaway sequence. Mahalanobis distance calculations confirmed clear separation: WMD1 (normal) = 0.9998 versus WMD2 (abnormal) = 7.252 × 10⁴. The 3σ threshold was calculated as MD(λ)w = 1.36 for the warning threshold and MD(λ)t = 2.22 for the alarm threshold.
The system achieved predictive vent activation warning 30 minutes before the vent opened in validation testing, using Fisher criterion weighting to prioritize the most discriminating features. Importantly, the algorithm is designed for imbalanced data — the normal operating sample space vastly outnumbers fault events — which is the realistic situation in field deployment.
Honestly, most buyers over-specify the algorithm sophistication here while under-specifying the sensor hardware. A well-calibrated Mahalanobis-distance approach like this is not exotic — it’s implementable on current BMS co-processors. The bottleneck in real deployments is almost always the absence of ultrasonic transducers bonded to cell surfaces, not the computational layer. If a supplier’s BMS architecture has no provision for acoustic sensors, the algorithm is irrelevant.
Most procurement teams don’t realize that current IEC and UL safety standards for stationary energy storage — including IEC 62619 and UL 9540 — do not mandate internal state monitoring at the cell level. They specify performance and safety outcomes, not sensor topology. That leaves the monitoring architecture entirely to the manufacturer’s discretion, which means a compliant product can still have essentially no thermal runaway early warning capability. Buyers need to specify this separately, above and beyond certification compliance.
Practical Guidance for Buyers #
If you’re sourcing prismatic LFP packs for stationary BESS applications — rack-scale, containerized, or modular UPS — the monitoring architecture should be a first-order specification item, not an afterthought addressed during FAT.
The minimum viable internal monitoring stack based on current evidence: Urms-capable ultrasonic transducers bonded to cell surfaces, multi-point thermal monitoring (not just one thermocouple per module), and strain sensing at the cell enclosure mid-point. Combined with a fusion algorithm that weights acoustic attenuation as the primary early warning channel, this configuration provides 20–67 minutes of warning across the 0.25–0.75 C overcharge range — enough time for orderly system shutdown and intervention.
Honestly, the acoustic monitoring requirement will immediately separate suppliers who have actually engineered for safety from those who are relying on the BMS voltage cutoff as the primary protection mechanism. The voltage cutoff is a last-resort protection, not an early warning system.
At a B2B sourcing level, this also affects which certifications you should require. UN 38.3 covers transport. IEC 62619 covers stationary industrial use. UL 9540A specifically tests thermal runaway propagation — and is the most relevant standard for evaluating whether a supplier’s pack design actually contains a fault rather than just surviving baseline conditions. We work with verified Chinese manufacturers of prismatic LFP packs and BESS modules, connecting global OEM buyers and energy storage integrators with technically qualified suppliers across cell chemistries, pack formats, and monitoring architectures — if you’re building a sourcing shortlist, start with a clear set of monitoring requirements derived from the data above.
Need help identifying qualified suppliers for prismatic LFP packs with advanced thermal monitoring? Talk to our sourcing team →
Supplier Qualification Questions #
- At what elapsed time does your in-situ acoustic monitoring system detect complete Urms signal attenuation during a 0.5 C overcharge sequence, and how does this compare to your vent valve activation time? The benchmark from controlled testing is 586 seconds versus 2,418 seconds — can you demonstrate equivalent or better detection lead time with your cell-level sensor configuration?
- What is the Urms sensitivity specification for your acoustic transducers at the 35 °C electrolyte phase-transition threshold, and how does your monitoring algorithm handle the nonlinear RU inflection point that occurs when ethylene carbonate transitions from solid to liquid phase?
- Can you provide validation data showing your Health Index algorithm’s normal versus abnormal sample Mahalanobis distance separation — specifically the WMD ratio between normal operating conditions and overcharge fault conditions, where a validated system should show WMD2/WMD1 on the order of 10⁴ or greater?
- What is the minimum SOC resolution your cell-level monitoring can detect via acoustic Urms measurement, given that the maximum RU change across the full SOC range in resting conditions is approximately 11.56%? How is this sensitivity maintained during active charge-discharge at 0.5 C and above?
- For your prismatic aluminum-shell LFP cells above 20 mm thickness, what ultrasonic probe frequency have you selected to balance penetration depth and resolution, and what is the measured signal-to-noise ratio at that frequency through your specific aluminum shell geometry?
Sourcing Checklist #
- [ ] Cell form factor is prismatic aluminum-shell LFP with nominal capacity ≥20 Ah and wall thickness >20 mm, verified against dimensional drawing
- [ ] BMS or supplementary monitoring includes ultrasonic Urms measurement capability, with documented sensitivity to SOC changes of ≤11.56% RU variation across full SOC range
- [ ] Supplier can demonstrate overcharge thermal runaway test data showing ultrasonic signal attenuation preceding vent valve activation by ≥20 minutes at ≤0.75 C charge rate
- [ ] Overcharge vent activation voltage is documented and falls within the 4.98–5.01 V range consistent with validated test data for this cell format
- [ ] Pack-level safety certification includes UL 9540A thermal runaway propagation test results, not just IEC 62619 baseline compliance
- [ ] Multi-parameter fusion algorithm (or equivalent) uses ≥4 feature variables including acoustic, thermal, strain, and voltage channels, with documented alarm thresholds derived from statistical baseline separation
- [ ] Transport certification per UN 38.3 is current and covers the specific cell capacity and pack configuration being sourced
- [ ] Pre-shipment conditioning protocol includes minimum 3× 0.5 C charge-discharge cycles plus ≥12-hour rest period, with data logs available for review
Key Specifications Table #
| Parameter | Recommended Value | Verification Method |
|---|---|---|
| Ultrasonic warning lead time before vent activation (0.5 C overcharge) | ≥30 minutes (1,800 s) | Controlled 0.5 C overcharge test; log Urms signal collapse time vs. vent activation time |
| Urms sensitivity to SOC change (resting conditions, full range) | Detects ≥11% RU variation across 0–100% SOC | Static SOC sweep at 5–10% SOC increments; measure normalized RU at each step |
| Vent activation voltage under overcharge (prismatic LFP, any C-rate) | 4.98–5.01 V (consistent across 0.25–0.75 C) | Monitor terminal voltage during controlled overcharge; record at vent event |
| Ultrasonic signal attenuation threshold for fault classification (IMTS) | WMD2/WMD1 ≥ 10⁴ separation; alarm at MD(λ)t = 2.22 | Run IMTS algorithm on normal (≥4,000 samples) and overcharge fault sample sets; confirm distance ratio |
| Temperature inflection threshold for acoustic monitoring calibration | 35 °C (electrolyte phase transition — nonlinear RU and RT onset) | Ramp cell temperature from 20 to 50 °C in 5 °C steps; identify RU/RT inflection point in logged data |
| Multi-channel fusion feature set | ≥6 parameters: voltage, temperature, Urms, TOF, H₂ concentration, surface strain | Review BMS/monitoring architecture spec; confirm all six channels are logged and fed into HI model |
Can’t find a supplier meeting these specs? Submit your requirements and we’ll match you within 48 hours.
Frequently Asked Questions #
Q: Why do conventional BMS voltage and temperature monitors miss early-stage thermal runaway in prismatic LFP cells?
A: Because the critical internal state changes — electrode elastic modulus degradation, dendrite nucleation, initial gas generation — happen at the cell interior before they manifest at the terminals or surface. In a 0.5 C overcharge sequence, the cell has been in an actively deteriorating internal state for nearly 30 minutes before the vent opens, and terminal voltage only converges to its fault signature (around 5.0 V) in the final phase. Surface temperature lags even further. A voltage-only BMS is reacting to the endpoint of a failure sequence that began much earlier.
Q: Can ultrasonic monitoring be retrofitted to existing prismatic LFP packs, or does it require factory integration?
A: Factory integration is strongly preferred. The acoustic transducers need to be bonded directly to the cell surface with consistent coupling material and contact pressure to maintain signal reproducibility across temperature and SOC cycling. Retrofitting into an already-assembled rack introduces coupling variability that degrades the signal quality needed for the 11.56% RU sensitivity range. For new pack designs, specify transducer mounting provisions at the cell level in the manufacturing requirement.
Q: What makes the 35 °C threshold significant for monitoring system design?
A: At approximately 35 °C, ethylene carbonate in the LFP electrolyte undergoes a solid-to-liquid phase transition. This causes an abrupt drop in elastic modulus and a step change in acoustic impedance mismatch between the electrolyte and electrode layers. Both RU and RT show a nonlinear inflection at this point — RU drops sharply and RT growth becomes non-uniform. Any monitoring algorithm calibrated only below this threshold will have incorrect baseline assumptions above it. This is particularly relevant for cells operating in high-ambient environments or during high-rate cycling where surface temperatures routinely exceed 35 °C.
Q: Is the 30-minute warning window consistent across all C-rates?
A: The warning lead time varies with charge rate. At 0.25 C, ultrasonic signal collapse preceded vent activation by approximately 67 minutes. At 0.5 C, the lead time was approximately 30 minutes. At 0.75 C, it compressed to approximately 21 minutes. Higher rates accelerate internal failure progression. Buyers deploying systems where overcharge faults could occur at higher C-rates should factor the shorter window into their emergency response and isolation protocol design.
Q: Does this research apply to cylindrical or pouch LFP cells, or only prismatic?
A: The specific findings — signal attenuation timing, vent voltage thresholds, IMTS algorithm parameters — are derived from 20 Ah prismatic aluminum-shell cells. Pouch cells have been studied elsewhere with ultrasonic methods, but their thinner profile (<10 mm) and aluminum-plastic composite laminate housing have very different acoustic transmission characteristics. The directional finding (Urms leads all other indicators in overcharge fault detection) is likely transferable, but the specific numeric thresholds for timing and signal levels should not be applied directly to other form factors without format-specific validation.
Published by compactbess.com Technical Team | Request a sourcing quote
For further reading on related topics, see our documentation on LFP chemistry and cell selection and IEC 62619 industrial safety compliance.
Data source: Ultrasonic Transmission-Based Internal State Monitoring and Early Warning for Overcharge Thermal Runaway in Prismatic Lithium Iron Phosphate Energy Storage Cells, H. Wang et al., Journal of the Electrochemical Society, 2024


