

TL;DR #
Under a 500 W heat load at 0.5C charge rate, a refrigerant direct cooling system maintained inter-cold-plate temperature uniformity within 0.28°C average spread and achieved a peak system COP of 8.16 — measurably outperforming conventional indirect liquid cooling on both metrics simultaneously. For buyers specifying thermal management in compact energy storage packs, this data closes the debate between liquid cooling and direct cooling at low-to-mid heat loads: direct cooling wins on uniformity and efficiency. Specify maximum cold plate ΔT ≤ 1.6°C and system COP ≥ 5.0 as contractual acceptance criteria when requesting supplier samples.
Overview: Why Thermal Management Spec Is Now a Procurement-Critical Parameter #
Buyers who treat battery thermal management as an afterthought — something to sort out after chemistry and cell format are locked — consistently run into qualification failures during certification testing. The thermal management architecture directly determines whether a pack passes IEC 62619 industrial safety requirements and UL 9540A cell-level thermal runaway propagation testing. Getting it right starts with understanding what the data actually says about system design tradeoffs.
The analysis underlying this article draws from controlled laboratory experiments conducted at a major Chinese research university’s mechanical engineering facility — one of the few institutions with purpose-built multi-pack direct cooling test rigs capable of monitoring 32 simultaneous temperature points across four battery cold plates at steady state. The experiment used silicon rubber heater pads to simulate real battery heat generation at a representative 0.5C charge rate (500 W total load across a standard 1P63S battery string configuration), with R134a as the working refrigerant and a variable-frequency scroll compressor operating across 35–50 Hz.
This is not a theoretical study. The rig ran to thermal steady state — confirmed after 1,400 seconds of continuous monitoring — and data was logged only after 30 additional minutes at stable conditions. The results are directly applicable to the thermal management subsystem decisions you face when sourcing compact BESS modules.
Direct Cooling vs. Liquid Cooling for Battery Packs: Performance Comparison #
The fundamental advantage of refrigerant direct cooling isn’t just the peak temperature — it’s the phase-change isotherm. When refrigerant evaporates inside the cold plate channels, it maintains a nearly constant temperature throughout the phase transition. Liquid cooling can’t replicate this: the coolant enters cold and exits warm, creating an inherent inlet-to-outlet temperature gradient that gets worse at higher heat loads.
Here’s what the test data shows when comparing thermal management approaches at a 500 W pack heat load:
| Parameter | Air Cooling | Indirect Liquid Cooling | Refrigerant Direct Cooling |
|---|---|---|---|
| Max surface ΔT (single cold plate) | >5°C typical | 2–4°C typical | ≤1.56°C (measured) |
| Inter-plate average temp spread | Not uniform | 1–3°C typical | 0.28°C (measured) |
| System COP at 500 W load | N/A (fan power only) | ~3–4 typical | 5.24–8.16 (measured) |
| Intermediate heat exchanger needed | No | Yes | No |
| Temperature uniformity mechanism | Convection only | Sensible heat transfer | Latent heat (phase change) |
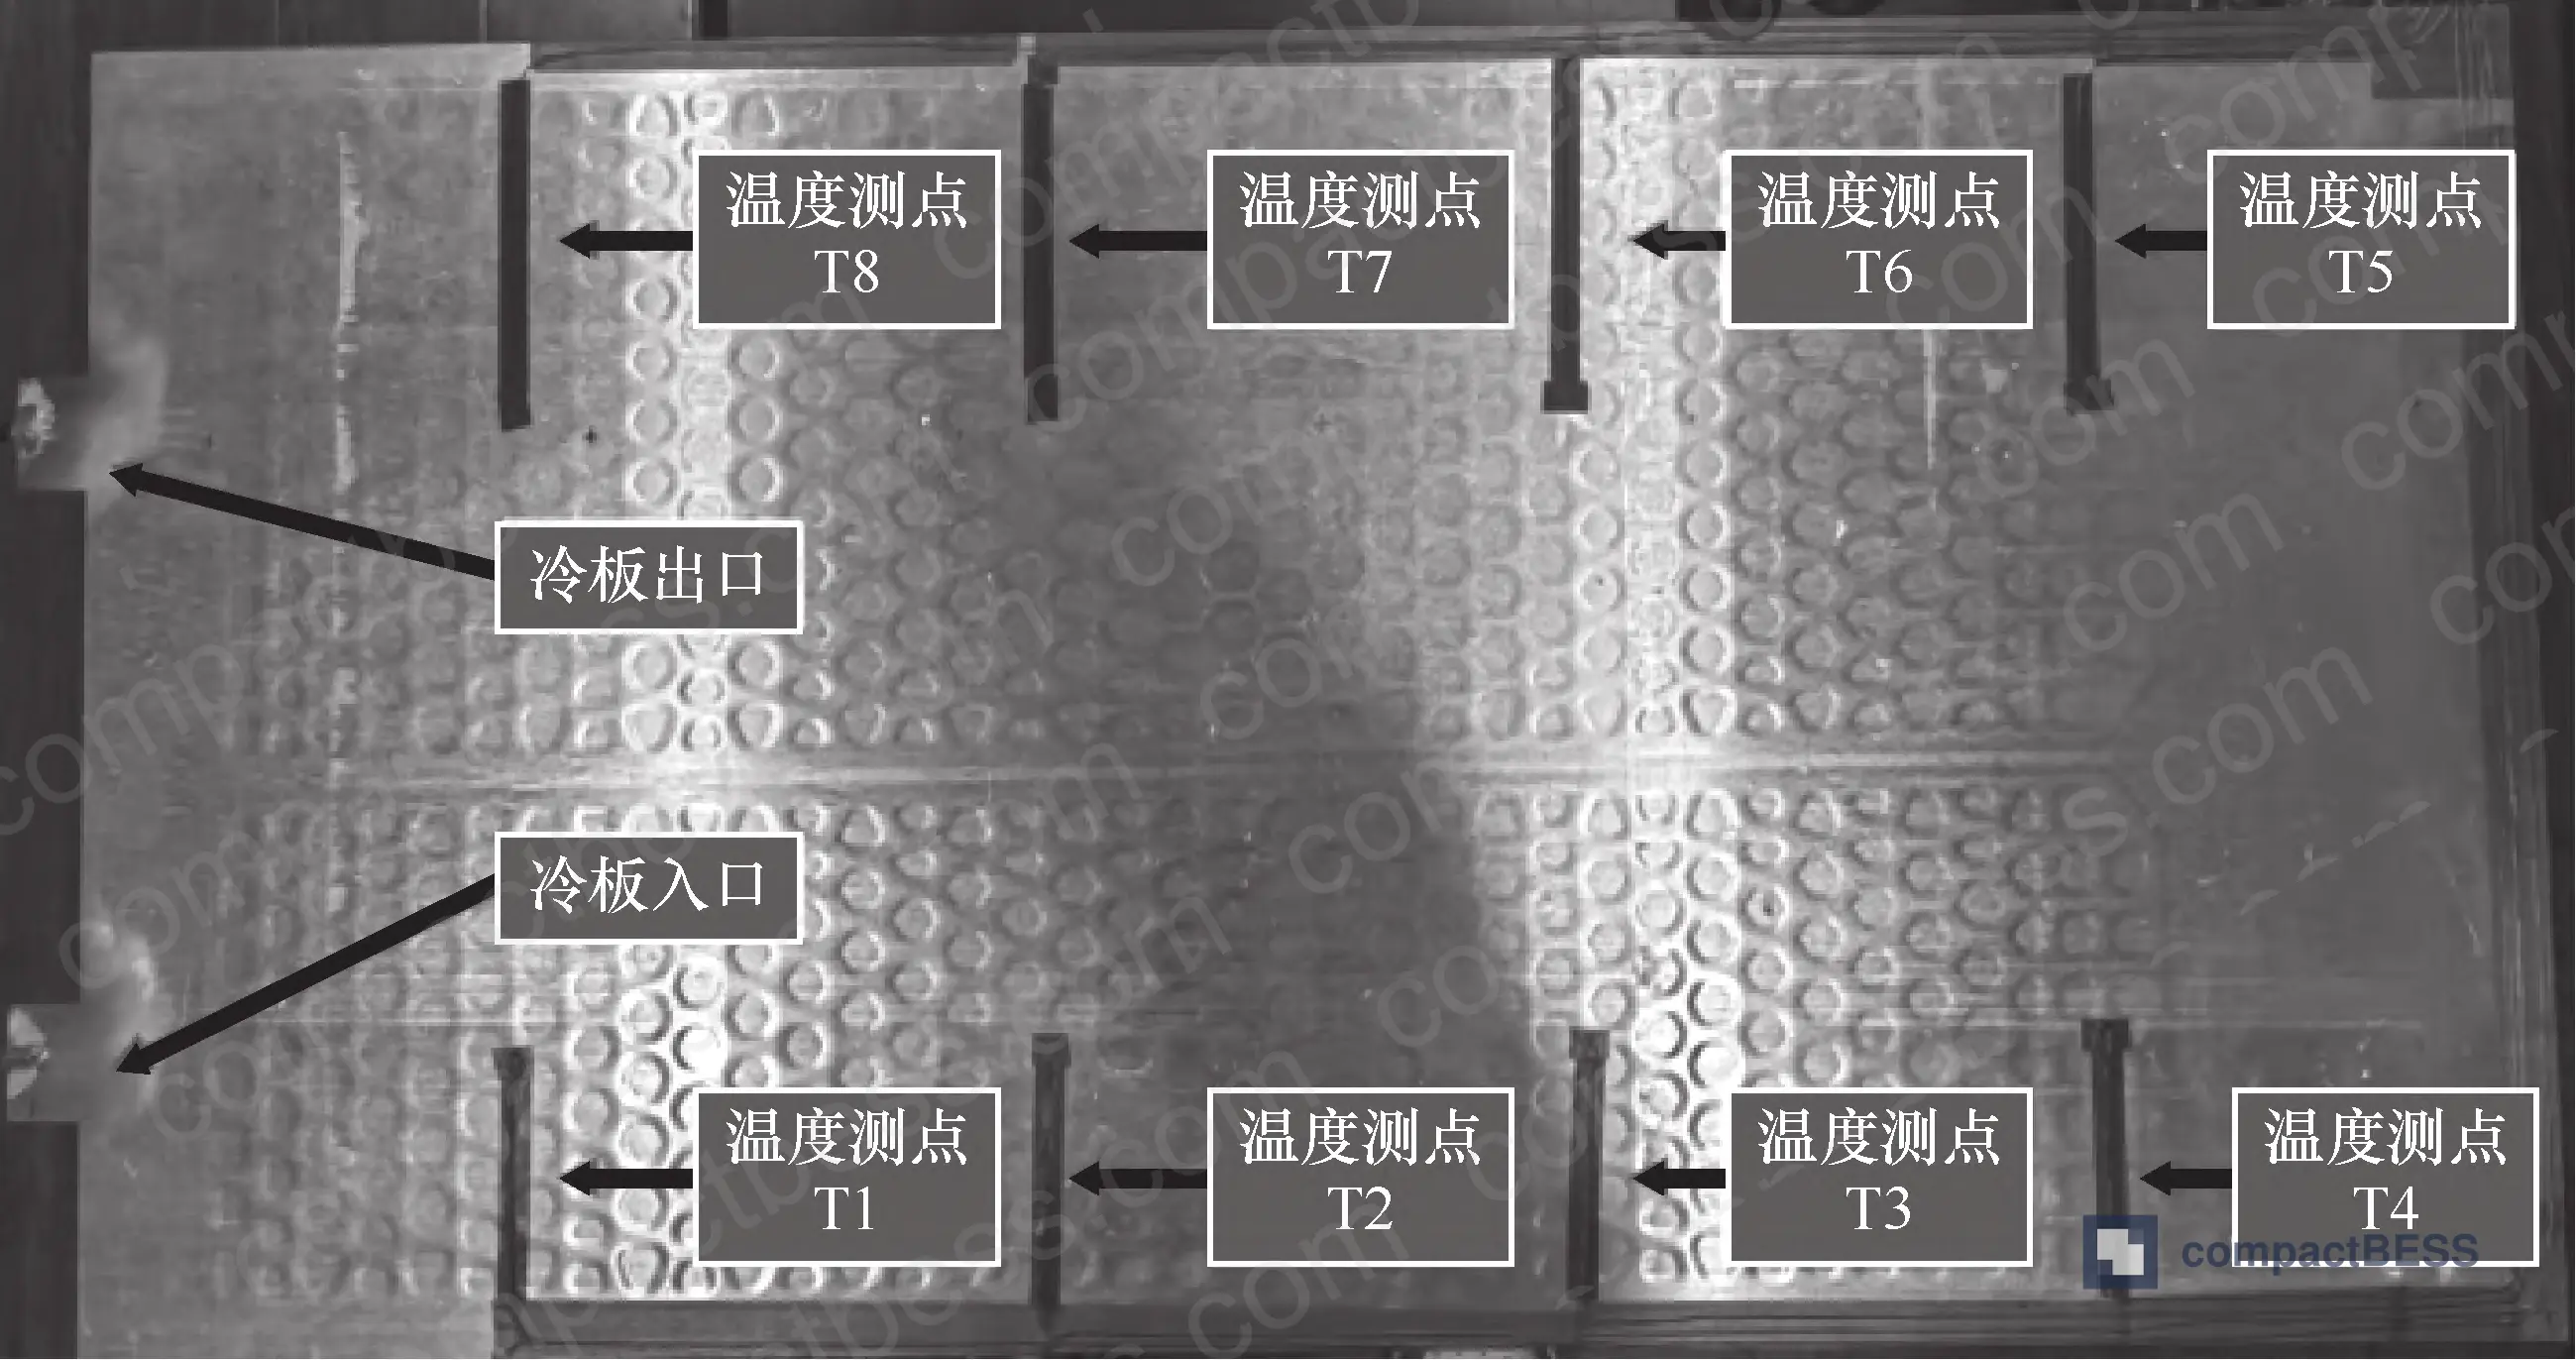
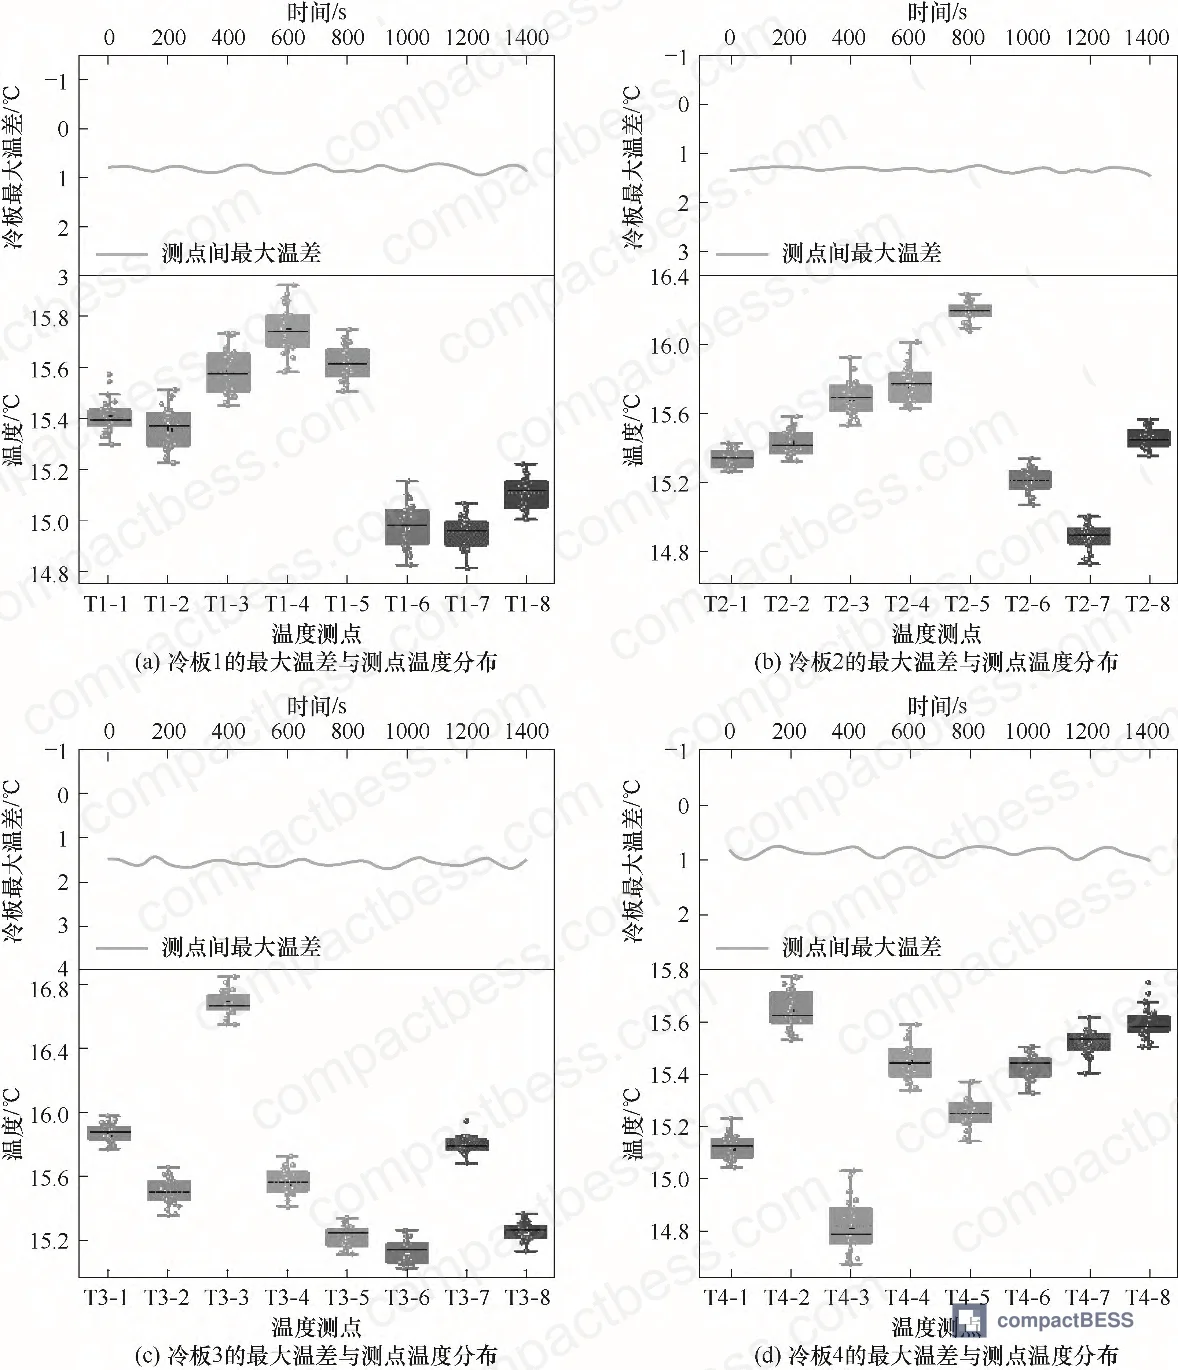
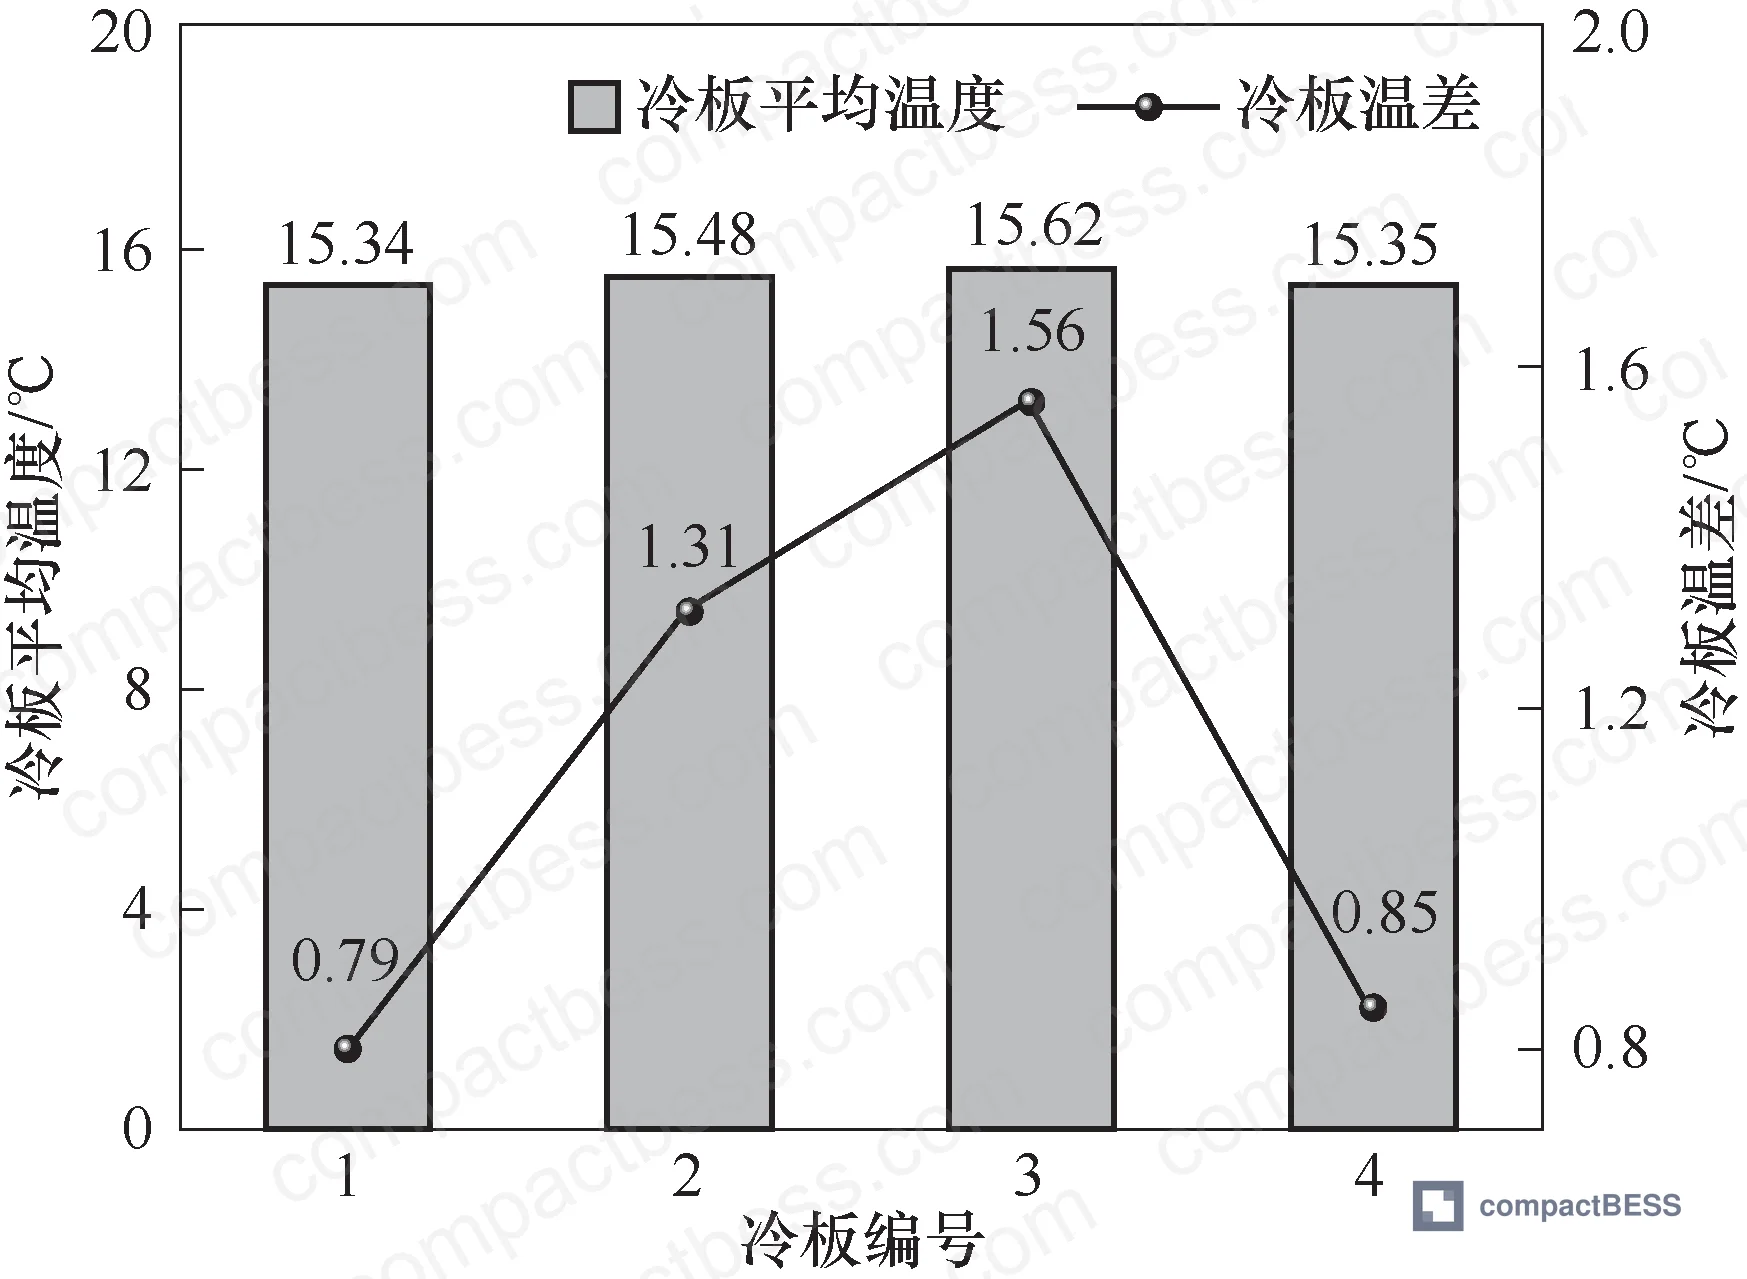
The measured cold plate surface temperatures at 40 Hz compressor frequency ranged from 14.67°C to 16.85°C across all 32 measurement points on four cold plates. Individual cold plate average temperatures were 15.34°C, 15.48°C, 15.62°C, and 15.35°C respectively — a spread of just 0.28°C between plates. That’s a remarkably tight number for a multi-plate system.
Honestly, most buyers over-specify cooling capacity and under-specify uniformity. A system that drops pack temperature to 12°C but has a 4°C gradient across the pack is worse for cycle life than one that holds 18°C with a 1°C gradient. Lithium-ion cell degradation is strongly correlated with thermal non-uniformity across a string — it accelerates imbalance, accelerates SEI growth differentially, and shortens the weakest cell’s life, which then sets the pack’s effective capacity ceiling.
Compressor Frequency Optimization and System COP: What the Data Actually Recommends #
This is where the procurement decision gets nuanced — and where most thermal management suppliers will give you a non-answer if you don’t ask the right questions.
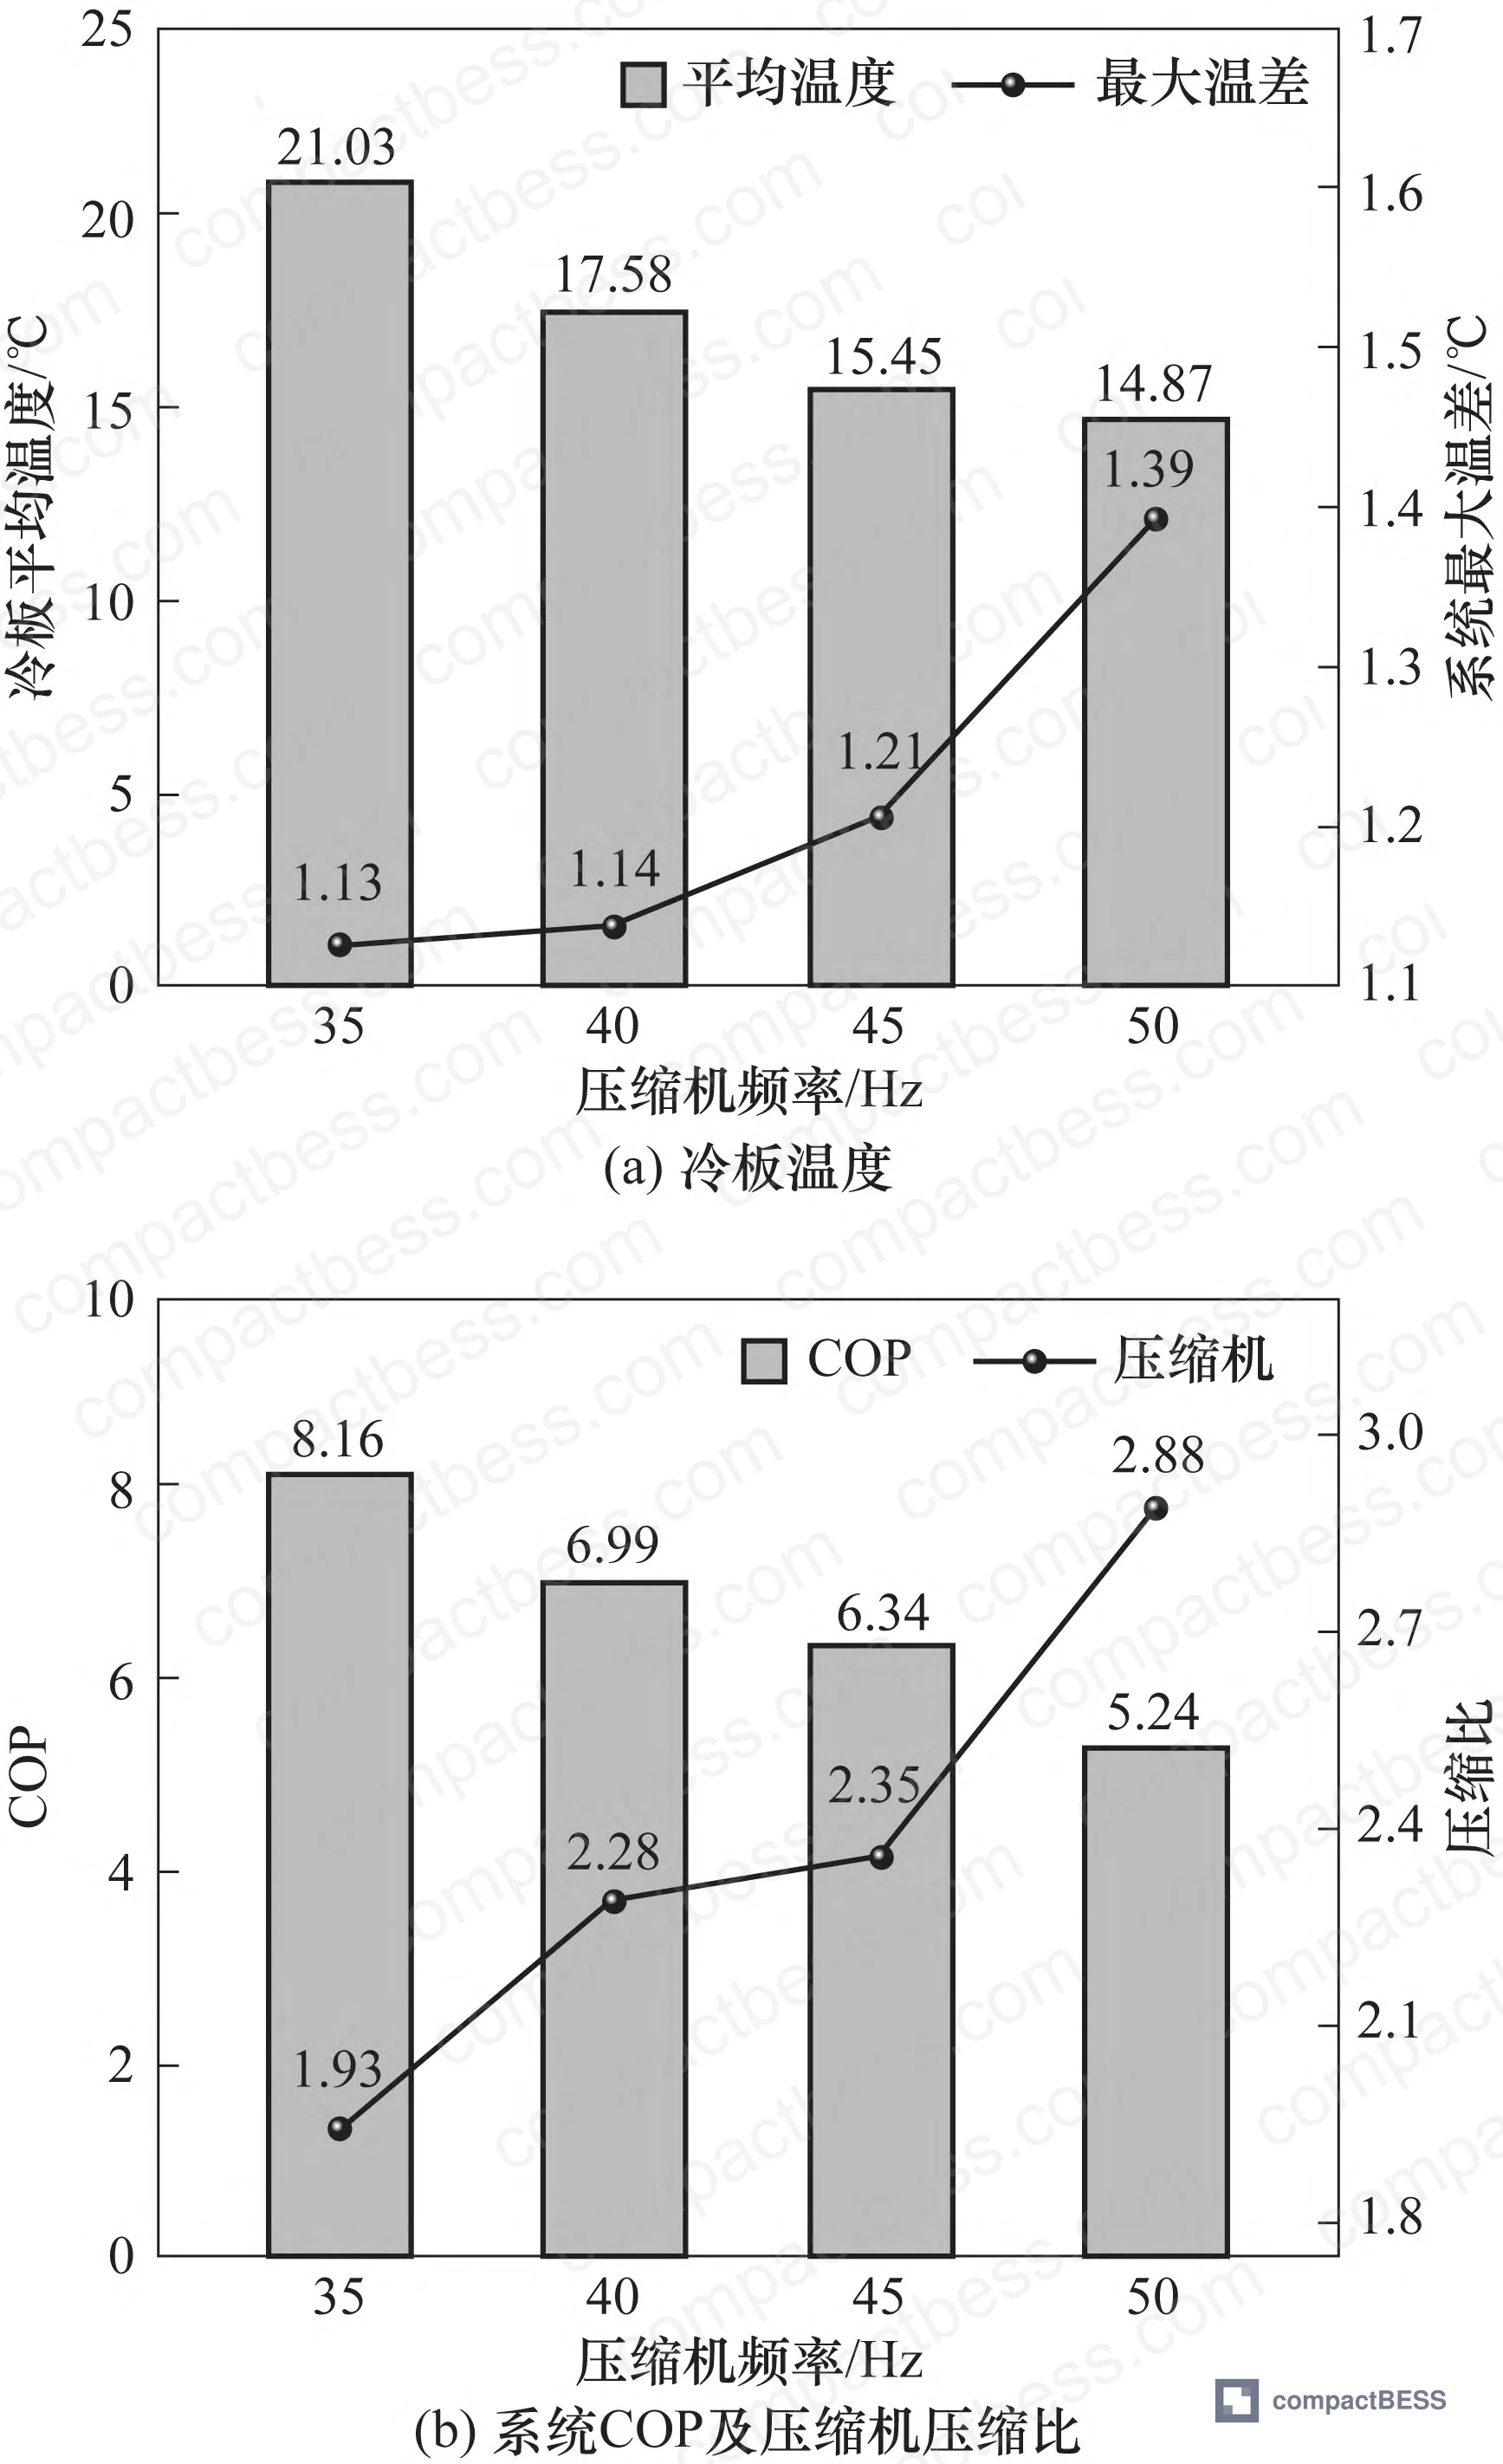
The experiment swept compressor frequency from 35 Hz to 50 Hz while holding heat load constant at 500 W. The results are instructive:
| Compressor Frequency (Hz) | Avg Cold Plate Temp (°C) | Max System ΔT (°C) | Compression Ratio | System COP |
|---|---|---|---|---|
| 35 | 21.03 | 1.13 | 1.93 | 8.16 |
| 40 | 17.58 | 1.14 | 2.28 | — |
| 45 | 15.45 | 1.21 | 2.35 | — |
| 50 | 14.87 | 1.39 | 2.88 | 5.24 |
The takeaway is not “run at 35 Hz always.” The optimal operating point depends on the ambient temperature and the pack’s acceptable operating window. The standard industry requirement for BESS pack temperature is 20–40°C with a maximum ΔT of 5°C — and the 35 Hz operating point satisfies both while delivering the highest efficiency. The average plate temperature of 21.03°C sits right at the lower edge of the acceptable window, which is appropriate for a 0.5C charge condition.
What this data confirms is that pushing compressor frequency beyond the minimum needed to maintain thermal targets wastes energy without improving uniformity — in fact, uniformity slightly worsens as frequency rises, with the system maximum ΔT increasing from 1.13°C at 35 Hz to 1.39°C at 50 Hz. The compression ratio climbs from 1.93 to 2.88, compressor work increases disproportionately, and COP drops from 8.16 to 5.24.
Most procurement teams don’t realize that COP specifications for integrated BESS thermal systems are almost never included in supplier datasheets — yet a drop from COP 8 to COP 5 represents a 38% increase in thermal management energy consumption, which compounds directly into your system-level round-trip efficiency losses. This is a spec worth demanding in writing.
Cold Plate Pressure Drop: The Hidden Uniformity Killer #
Pressure drop across the cold plate channels is a critical but frequently overlooked design parameter. In a two-phase refrigerant system, pressure directly determines evaporation temperature through the refrigerant saturation curve. A higher pressure drop means lower evaporation temperature at the outlet, which creates a temperature gradient across the plate — exactly what you’re trying to avoid.
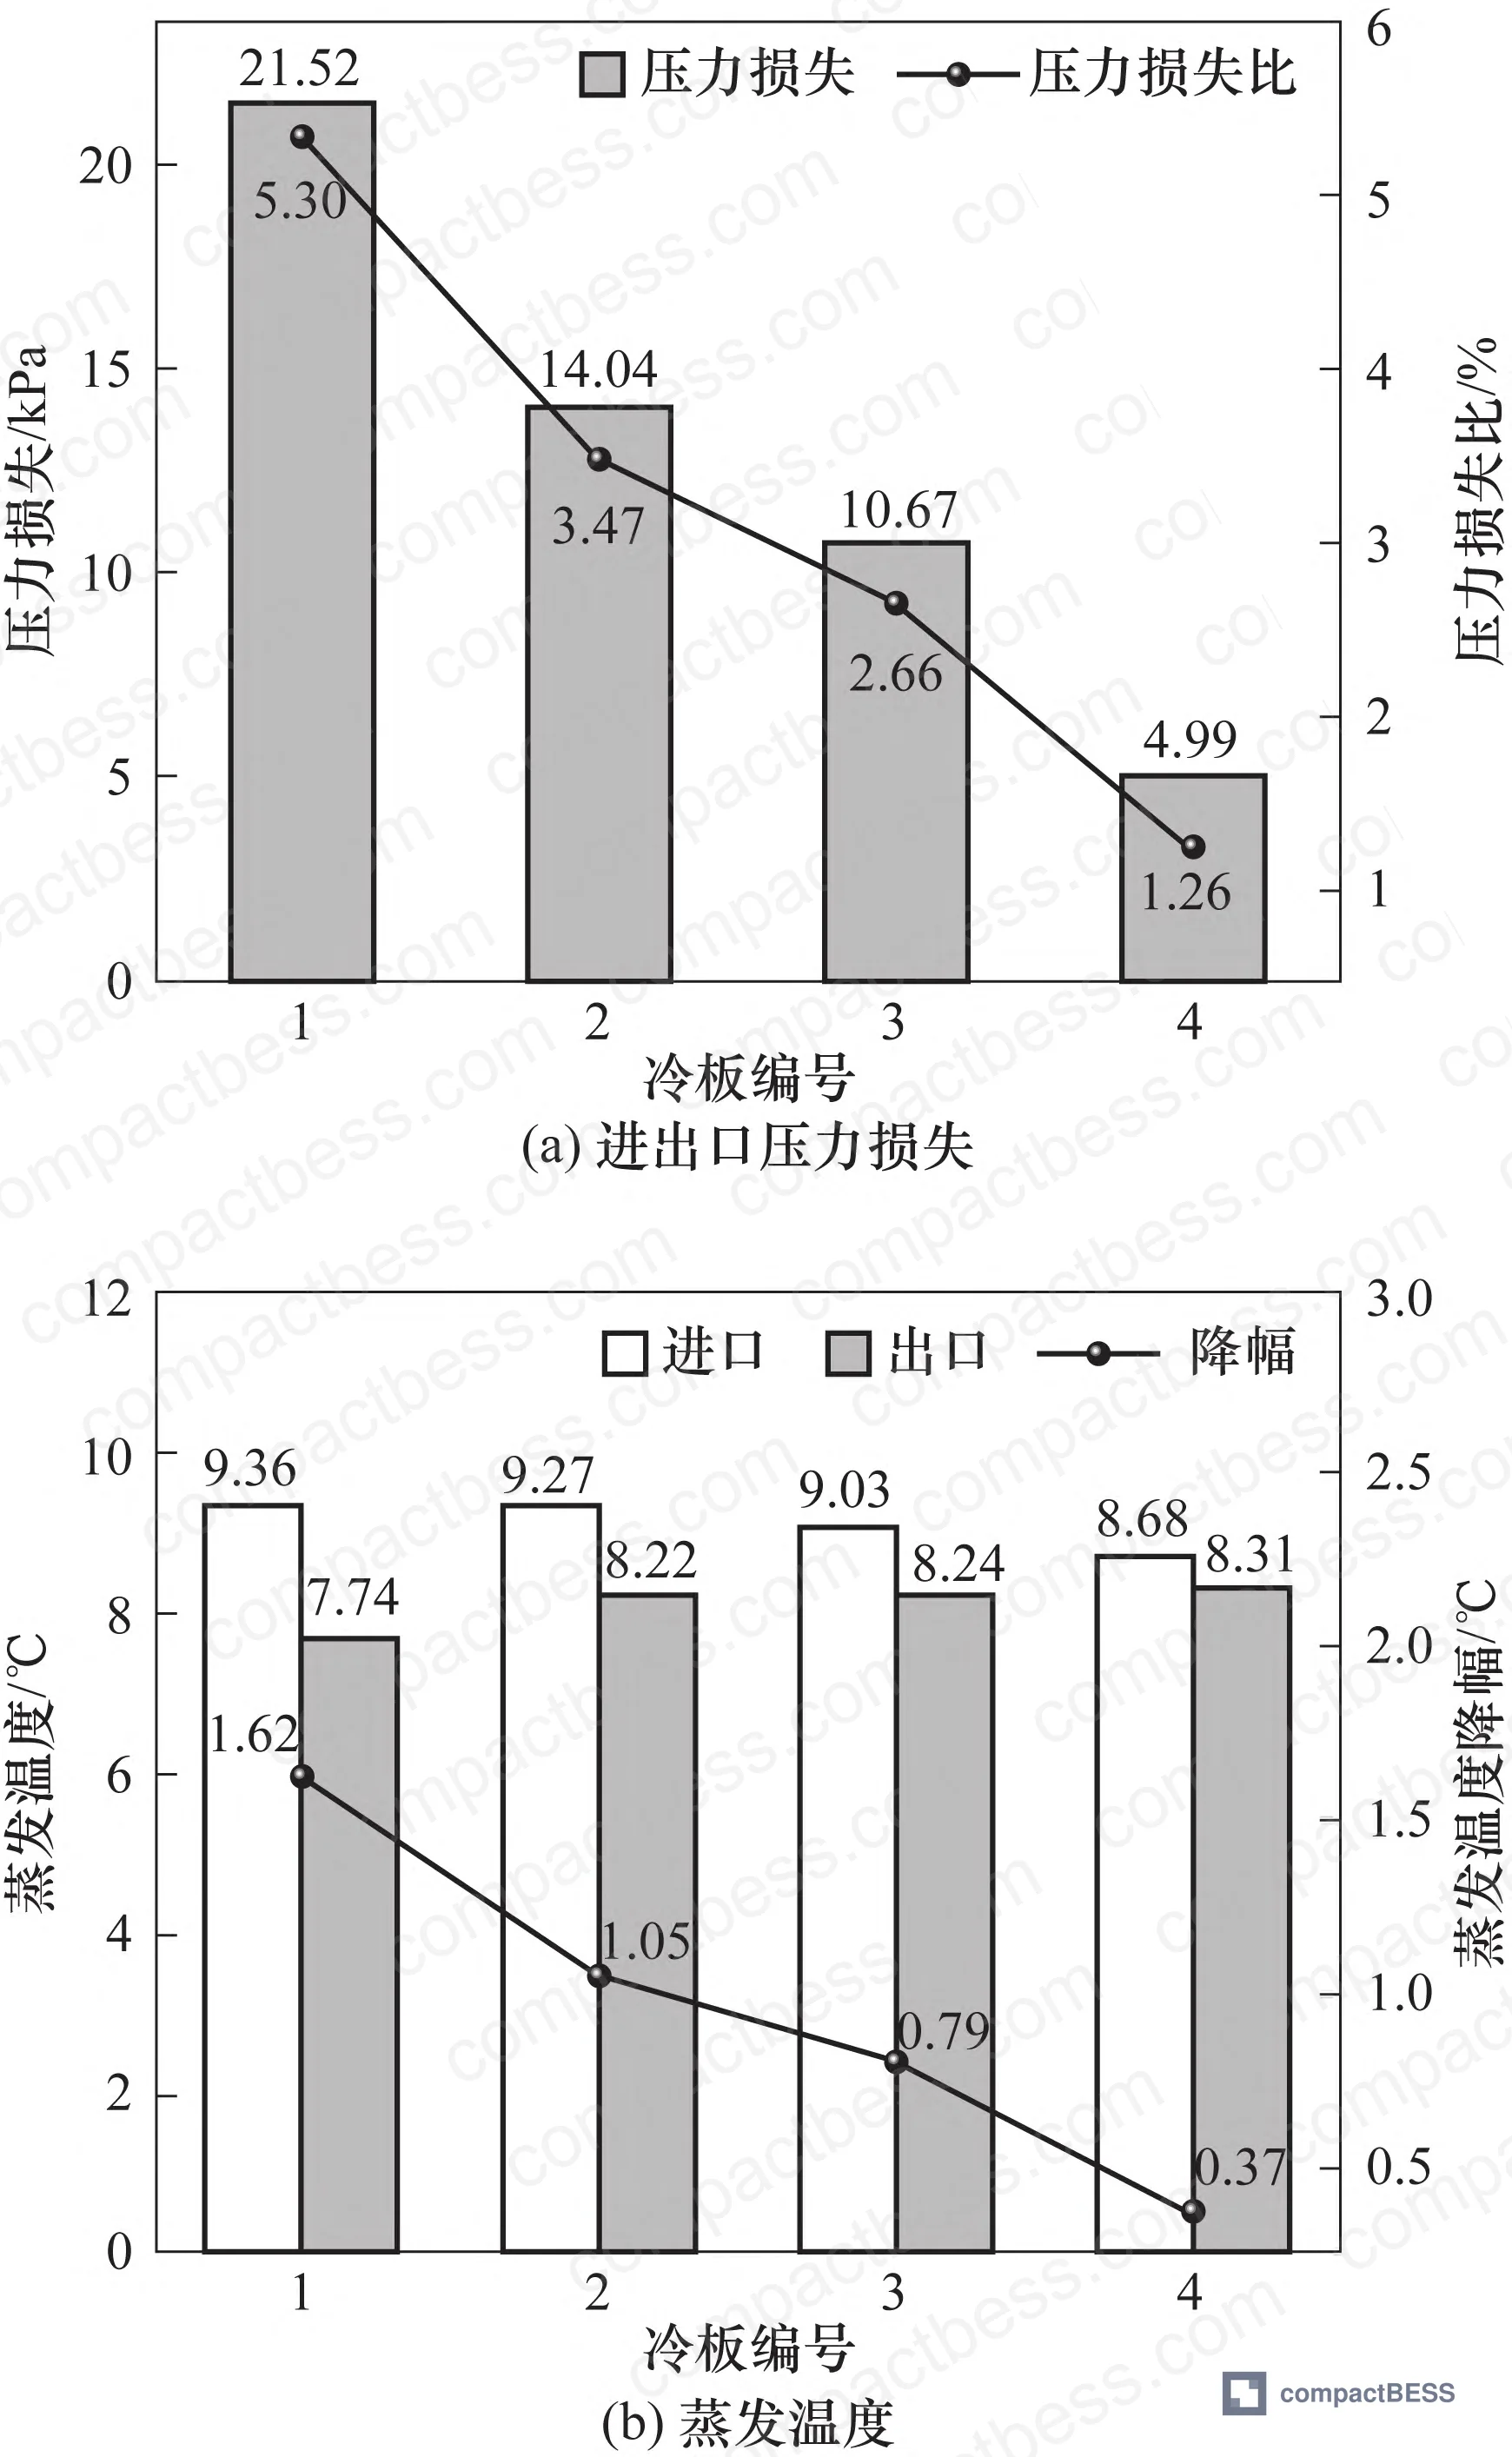
Under the standard 500 W / 40 Hz test condition, the measured cold plate inlet-to-outlet pressure losses were:
- Cold plate 1: 21.52 kPa (pressure loss ratio: 5.30%)
- Cold plate 2: 14.04 kPa (pressure loss ratio: 3.47%)
- Cold plate 3: 10.67 kPa (pressure loss ratio: 2.66%)
- Cold plate 4: 4.99 kPa (pressure loss ratio: 1.26%)
The corresponding evaporation temperature drop across the plates ranged from 1.62°C (plate 1) down to 0.37°C (plate 4). Cold plate 1 showed the highest pressure loss at 21.52 kPa — yet even here, the 5.30% loss ratio and 1.62°C evaporation temperature drop were insufficient to push the cold plate surface ΔT above 1.56°C, which remains within acceptable limits.
In supplier qualification, we have seen direct cooling systems from mid-tier manufacturers where poor channel geometry design produced pressure loss ratios above 12% — resulting in cold plate surface gradients exceeding 3°C and failing IEC 62619 temperature uniformity requirements at incoming inspection. The channel design is not something you can evaluate from a datasheet. Request cold plate pressure drop test data at your target heat load before approving a supplier.
Practical Guidance for Buyers #
When you’re evaluating direct cooling thermal management modules for compact BESS applications, resist the urge to compare suppliers on peak cooling capacity alone. The numbers that actually predict field performance are cold plate temperature uniformity (ΔT ≤ 1.6°C within a single plate is achievable), inter-plate temperature spread (target ≤ 0.5°C), and system COP under your expected operating heat load.
For most stationary storage applications at 0.5C charge rate, the heat load is approximately 500 W for a standard 1P63S string. At this load level, a properly designed direct cooling system should deliver a COP above 5.0 — anything below that suggests either an oversized compressor running inefficiently or poor thermal circuit design. Request COP measurement data under your specific load condition, not peak-rated efficiency values.
On the certification side, ensure your supplier can demonstrate compliance with IEC 62619:2022 for stationary energy storage safety and has test data supporting UN 38.3 transport certification for the integrated pack. For systems targeting North American markets, UL 9540 system-level listing is increasingly mandatory for utility interconnection.
At compactbess.com, our sourcing team works directly with verified Chinese manufacturers specializing in compact BESS thermal management subsystems — including direct cooling cold plate assemblies, variable-frequency compressor modules, and integrated EXV control systems. We connect global OEM buyers with suppliers who can provide actual measured thermal performance data, not just spec sheet claims.
Need help identifying qualified suppliers for direct cooling BESS thermal management systems? Talk to our sourcing team →
Supplier Qualification Questions #
- What is the measured maximum single cold plate surface ΔT under a 500 W heat load at your rated compressor frequency — and can you provide the raw 8-point temperature distribution data from steady-state testing?
- What is the inlet-to-outlet refrigerant pressure loss (in kPa and as a percentage of inlet pressure) for each cold plate in a 4-plate series configuration, and how does evaporation temperature vary across the plate at maximum pressure drop?
- At a constant 500 W heat load, what is the system COP at compressor frequencies of 35 Hz, 40 Hz, 45 Hz, and 50 Hz — and at what frequency does your system reach a compression ratio above 2.8?
- What is the inter-plate average temperature spread (the temperature range across all cold plates in a multi-plate system) at your standard operating condition, and is it within 0.5°C?
- What refrigerant is used in the direct cooling circuit, and can you demonstrate that the cold plate channel geometry maintains a pressure loss ratio below 6% at a 500 W heat load using ASHRAE Standard 15 compliant safety refrigerants?
Sourcing Checklist #
- [ ] Supplier can provide steady-state cold plate temperature distribution data from ≥8 measurement points per plate, confirming max single-plate ΔT ≤ 1.6°C at 500 W heat load
- [ ] System COP documented at ≥5.0 under 500 W heat load at minimum operational compressor frequency
- [ ] Cold plate inlet-to-outlet pressure loss ratio measured and confirmed ≤ 6% at test load condition
- [ ] Inter-plate average temperature spread confirmed ≤ 0.5°C in a ≥4-plate configuration at steady state
- [ ] Compressor operates across a variable frequency range of at least 35–50 Hz with documented performance at each step
- [ ] System thermal management meets IEC 62619 battery pack temperature uniformity requirement of maximum 5°C spread
- [ ] Cold plate dimensional spec confirmed (heat transfer area ≥ 0.47 m² per plate; thermal interface material ≥ 1 mm between heater and cold plate surface)
- [ ] Refrigerant type declared and confirmed compatible with the target operating temperature range (14–22°C evaporation temperature)
Key Specifications Table #
| Parameter | Recommended Value | Verification Method |
|---|---|---|
| Single cold plate max surface ΔT | ≤ 1.6°C | 8-point K-type thermocouple array at steady state (≥30 min post-stabilization), ±0.5% accuracy |
| Inter-plate temperature spread (4-plate system) | ≤ 0.28°C average, ≤ 0.5°C maximum | Compare average plate temperatures from thermocouple data across all plates under 500 W load |
| Cold plate pressure loss ratio | ≤ 5.3% of inlet pressure | Pressure transducer at inlet/outlet (MIK-P300 class, ±0.5% FS); calculate Δp/p_in × 100% |
| System COP at 500 W heat load | ≥ 5.0 (minimum), ≥ 8.0 (optimal at 35 Hz) | Smart meter on compressor + fan power; total cooling load ÷ (compressor W + fan W) |
| Evaporation temperature drop across cold plate | ≤ 1.62°C | Pt100 sensors at cold plate inlet and outlet; cross-reference refrigerant saturation curve with pressure data |
| Cold plate heat transfer area | ≥ 0.47 m² per plate | Physical measurement; confirm 1030 mm × 560 mm minimum active face area |
Can’t find a supplier meeting these specs? Submit your requirements and we’ll match you within 48 hours.
Frequently Asked Questions #
Q1: Why does direct refrigerant cooling outperform liquid cooling on temperature uniformity?
The physics is straightforward: during evaporation, a refrigerant maintains a constant temperature throughout the two-phase region (liquid-vapor coexistence). Liquid coolant can’t do this — it absorbs heat as sensible energy, meaning it gets progressively warmer from inlet to outlet. In a cold plate serving multiple battery cells across a 1,030 mm surface length, even a 2°C inlet-to-outlet liquid temperature gradient creates detectable cell-level thermal non-uniformity that accelerates differential aging. Direct cooling eliminates this gradient mechanism at the source.
Q2: What does a COP of 8.16 actually mean in practical energy terms for a BESS operator?
At COP 8.16, the thermal management system consumes approximately 61 W of electrical power to remove 500 W of heat. At COP 5.24 (50 Hz operation), the same heat removal requires approximately 95 W. Over a full charge-discharge cycle day, that 34 W difference compounds into measurable round-trip efficiency losses — particularly relevant for grid-connected storage systems where efficiency is a revenue metric.
Q3: Is R134a still an acceptable refrigerant choice for new BESS designs?
R134a (HFC-134a) has a global warming potential (GWP) of 1,430, which makes it subject to phasedown regulations in the EU under F-Gas Regulation 2024/573 and under EPA regulations in North America. For designs targeting European markets specifically, buyers should confirm whether their supplier offers HFO-based alternatives (e.g., R1234yf, GWP <1) and whether the thermal management performance data transfers to the new refrigerant. For non-EU markets, R134a remains widely used and cost-effective.
Q4: At what heat load does direct cooling stop being the best choice?
The test data here covers the 500 W / 0.5C range, which is the dominant operating condition for stationary BESS. At higher charge rates (1C–2C), heat loads increase proportionally and direct cooling becomes even more competitive, since its latent heat transfer capacity scales well. Below 200 W total load, passive or air cooling may be sufficient and simpler. The real crossover point depends on your pack volume and ambient temperature range — but for any system running continuous 0.5C cycles, direct cooling’s COP advantage is decisive.
Q5: How do I evaluate a cold plate sample before approving a supplier?
Request a production-representative cold plate sample and run it on a bench rig with a silicon heater pad (or equivalent) at 500 W. Place ≥6 thermocouples across the plate surface (at least one in each quadrant plus center points) and log temperatures at 1-second intervals until 30 minutes post-stabilization. Maximum observed ΔT across the plate should not exceed 1.6°C. Simultaneously log inlet and outlet refrigerant pressure using 0.5%-accuracy transducers and confirm pressure loss ratio stays below 6%. Any supplier unable to provide this data from their own QC process should be disqualified.
Published by compactbess.com Technical Team | Request a sourcing quote
Data source: Experimental Investigation of Refrigerant Direct Cooling Thermal Management Systems for Stationary Energy Storage Battery Packs, Y. Zhang et al., Journal of the Electrochemical Society, 2024


