

TL;DR #
A crush-triggered thermal diffusion test on NMC battery modules shows that at 100% SOC, the first cell enters thermal runaway at only 33.6 kN of force — roughly one-fifth the trigger force required at lower charge states — and propagates to all 16 cells in sequence. For buyers specifying transport and storage SOC limits, this data establishes a clear threshold: modules kept below 30% SOC do not propagate thermal events to adjacent cells. Before finalizing any shipment or storage protocol, require your supplier to document a tested SOC ceiling and verify it against IEC 62619 crush test criteria.
Overview #
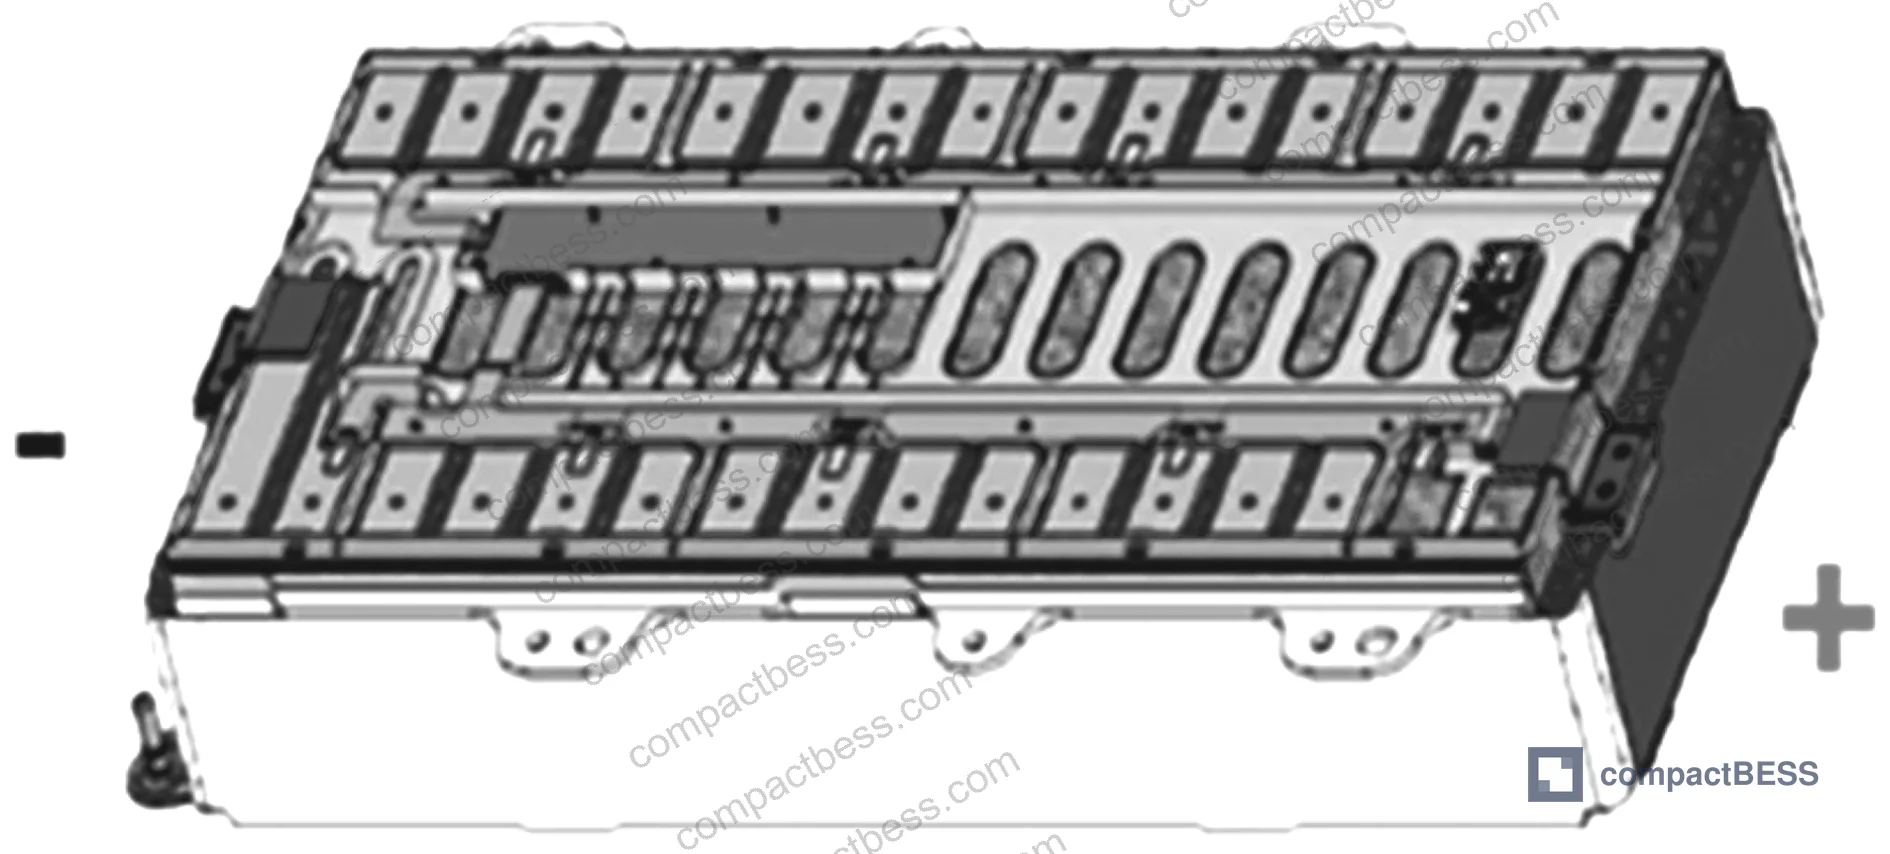
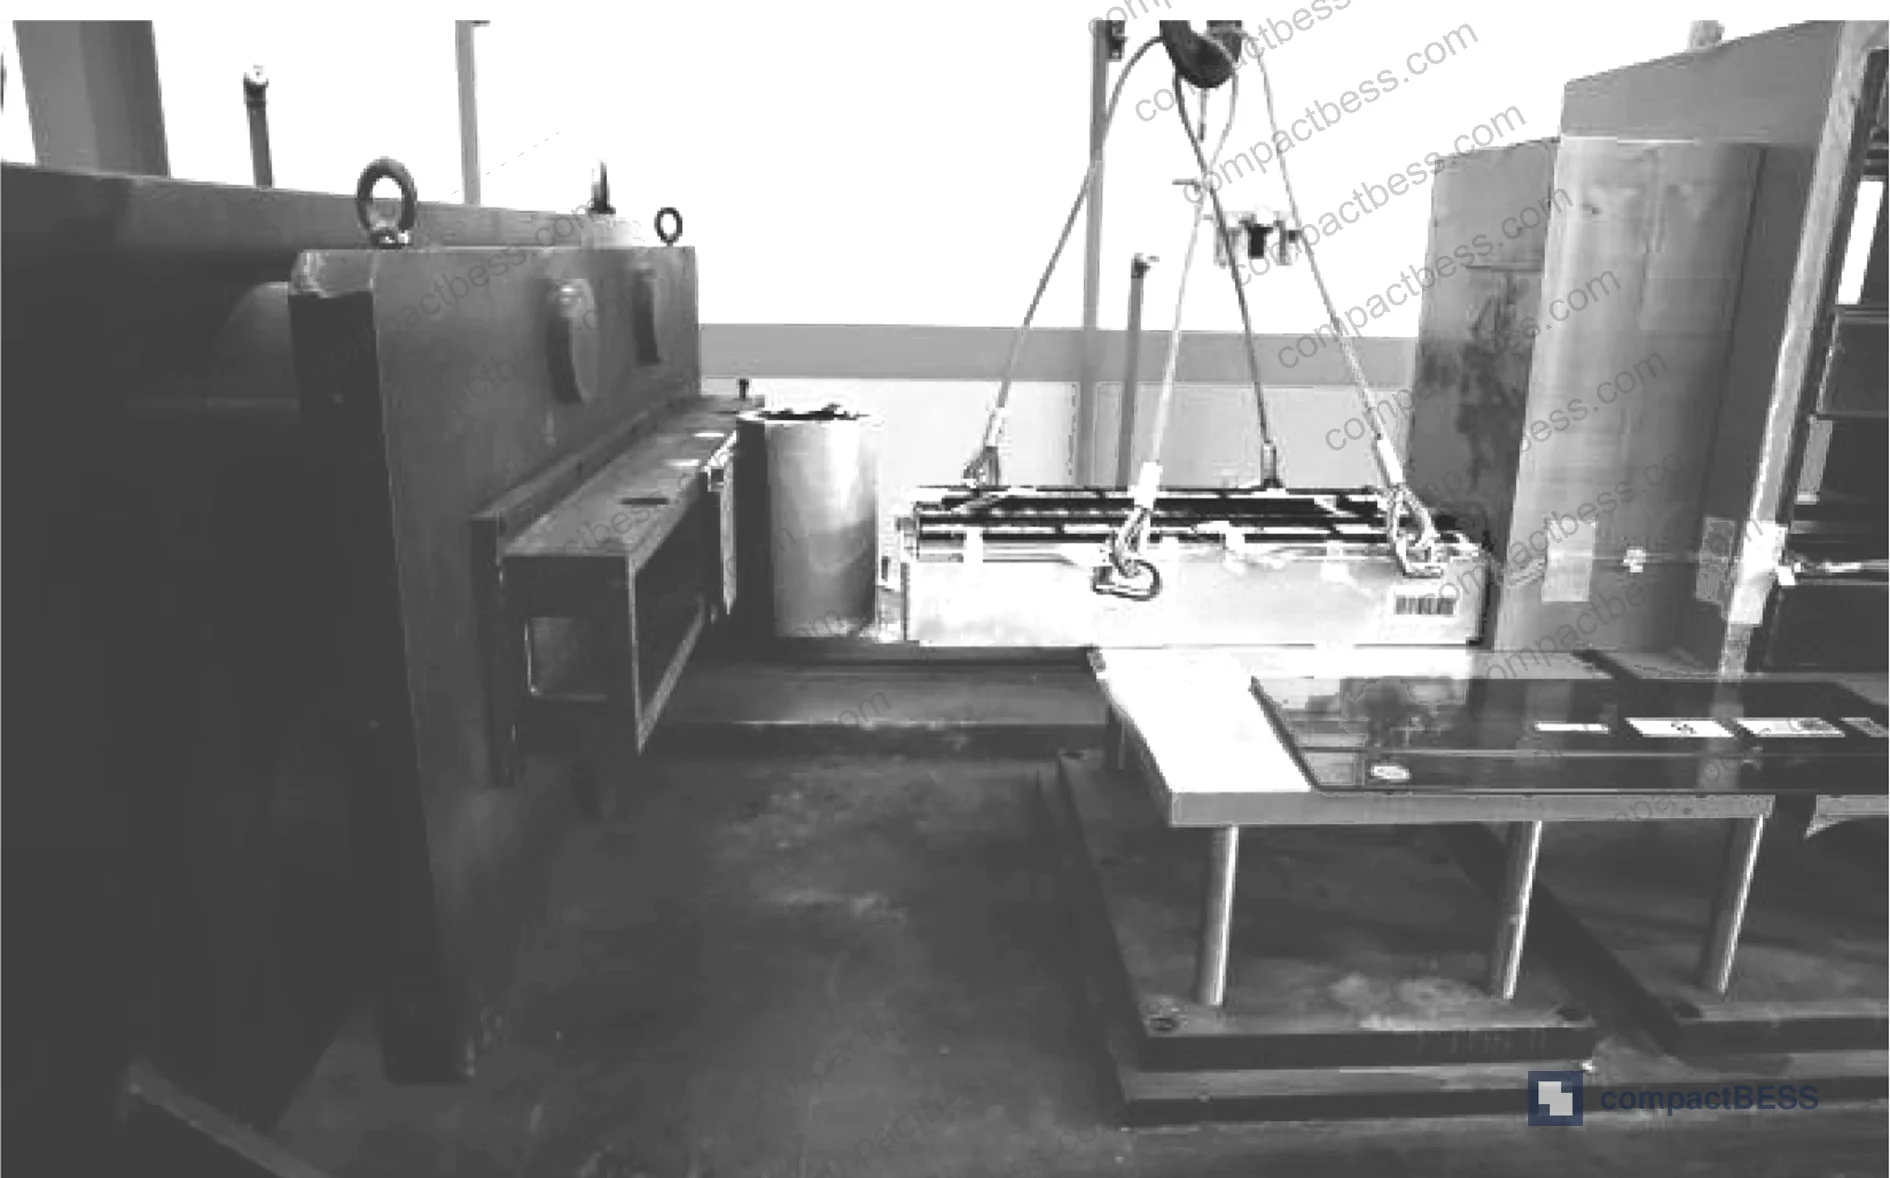
Most procurement teams treat SOC limits during transport as a logistics formality — something to note in the shipping brief but rarely to validate against actual failure data. That’s a costly assumption. The test program behind this analysis was conducted at an automotive-grade battery safety laboratory, using a production-representative NMC (811-series) module configuration: 16 cells of 140 Ah capacity each, arranged in a 2P8S topology. Four independent modules were charged to 10%, 30%, 50%, and 100% SOC respectively, then subjected to controlled crush loading at 0.1 mm/s using a 150 mm cylindrical indenter. Data acquisition ran at 10 Hz across five Type-K thermocouple positions and a parallel voltage recording system — giving a high-resolution picture of exactly when and how each cell failed.
The results are unambiguous and have direct procurement implications for anyone specifying NMC cell packs, portable power stations, or battery modules destined for international transport. IEC 62619:2022 Safety requirements for secondary lithium cells and batteries provides the normative framework for abuse testing at the module level, but the SOC-dependent behavior documented here goes well beyond what most certification audits actually test.
For context on how cell format affects mechanical vulnerability during crush events, see our guide on Cell Formats & Form Factors.
SOC-Dependent Thermal Runaway Trigger Force and Deformation Rate #
This is where the data gets stark. Across all four test groups, the relationship between SOC and mechanical trigger threshold is not linear — it’s a cliff.
| SOC Level | Max Crush Force at First Cell Failure | Deformation Rate at Trigger |
|---|---|---|
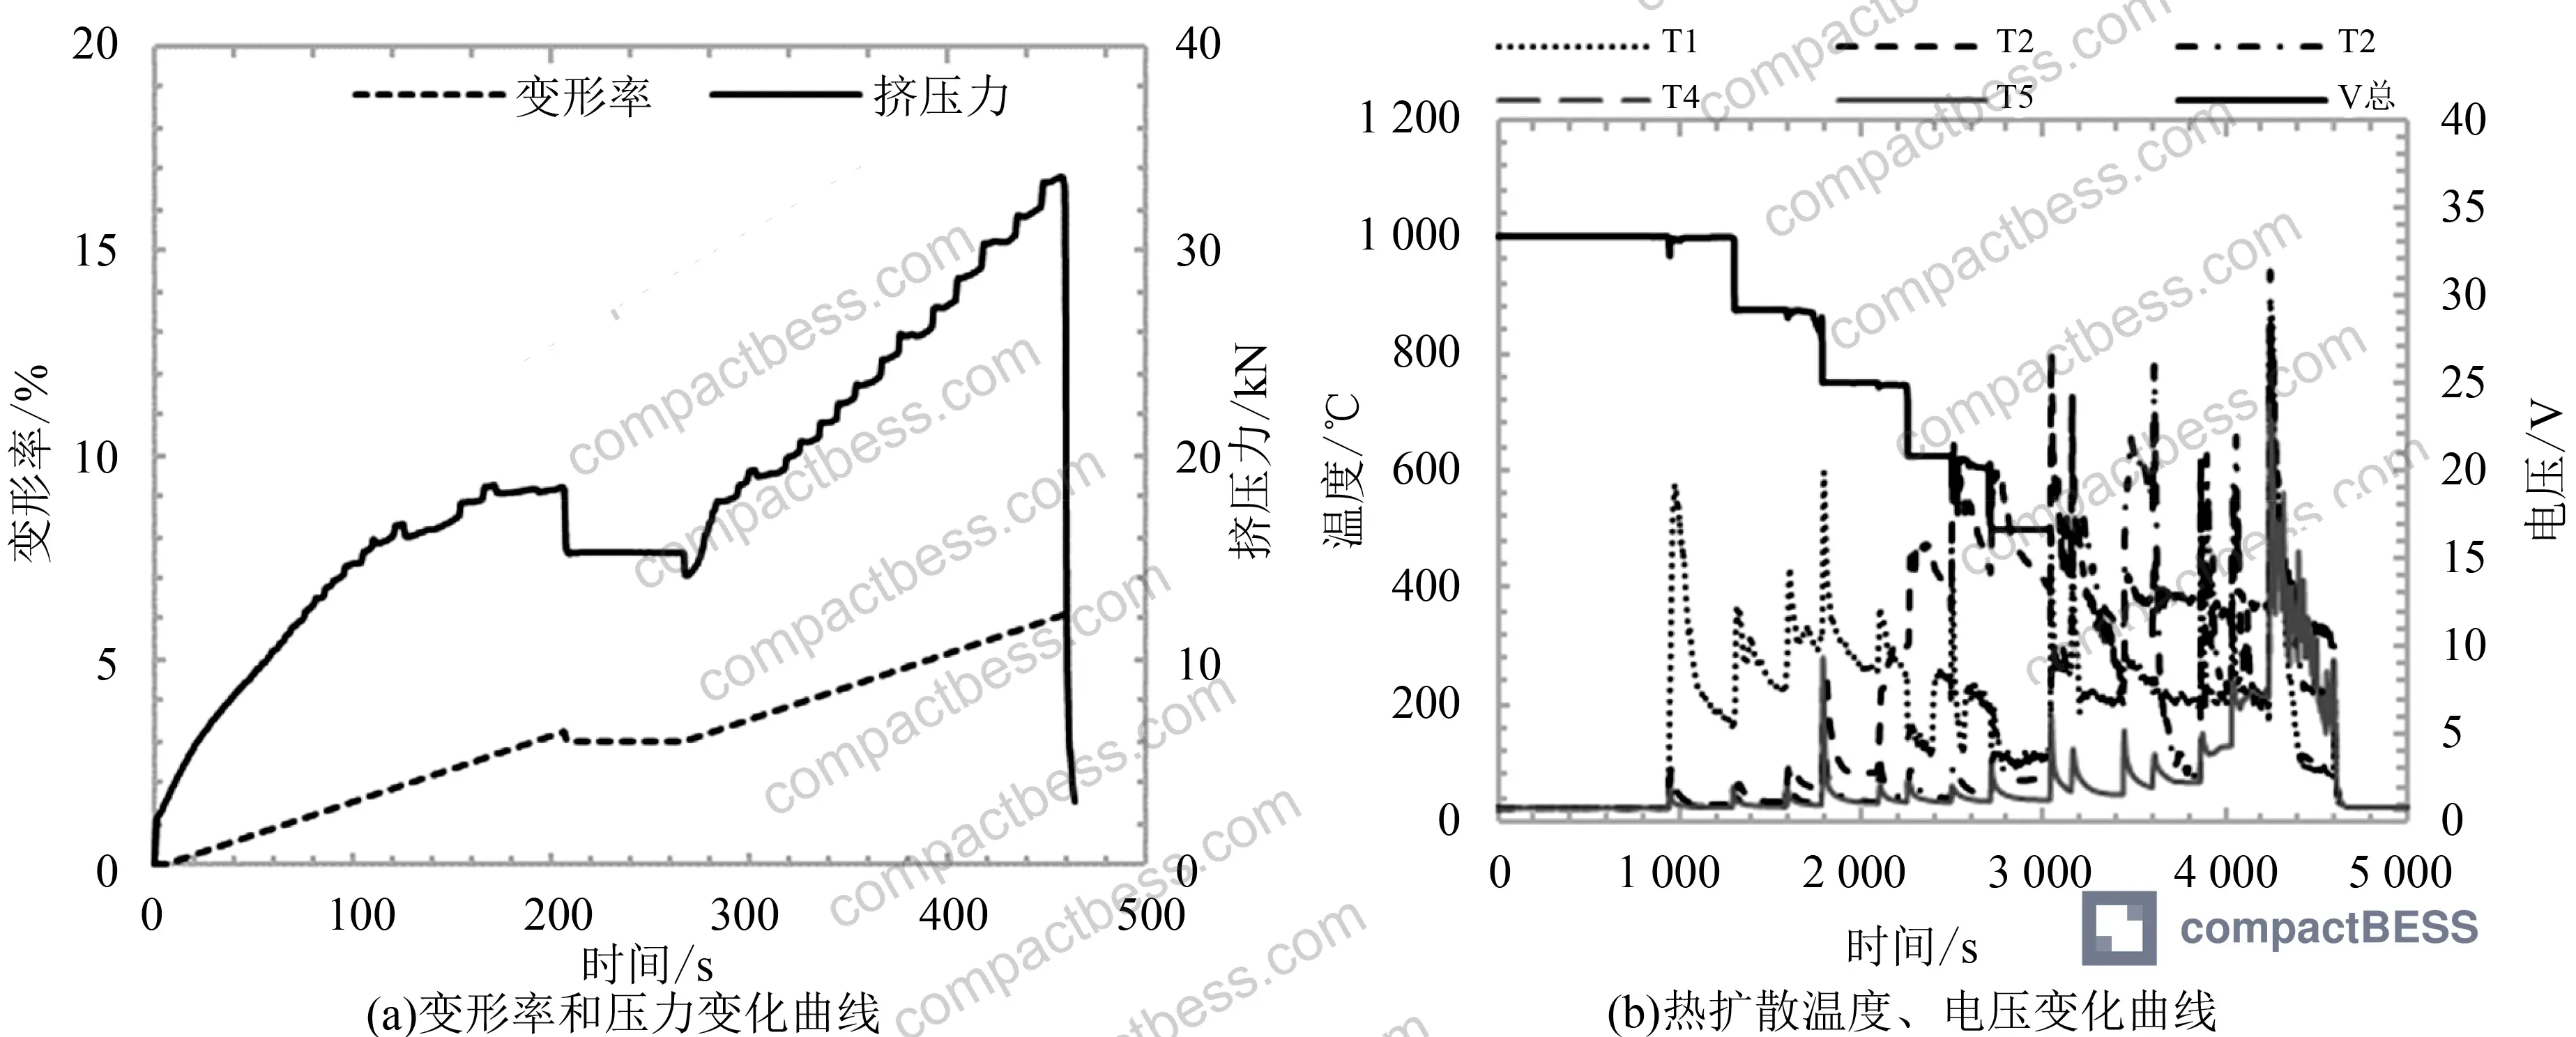
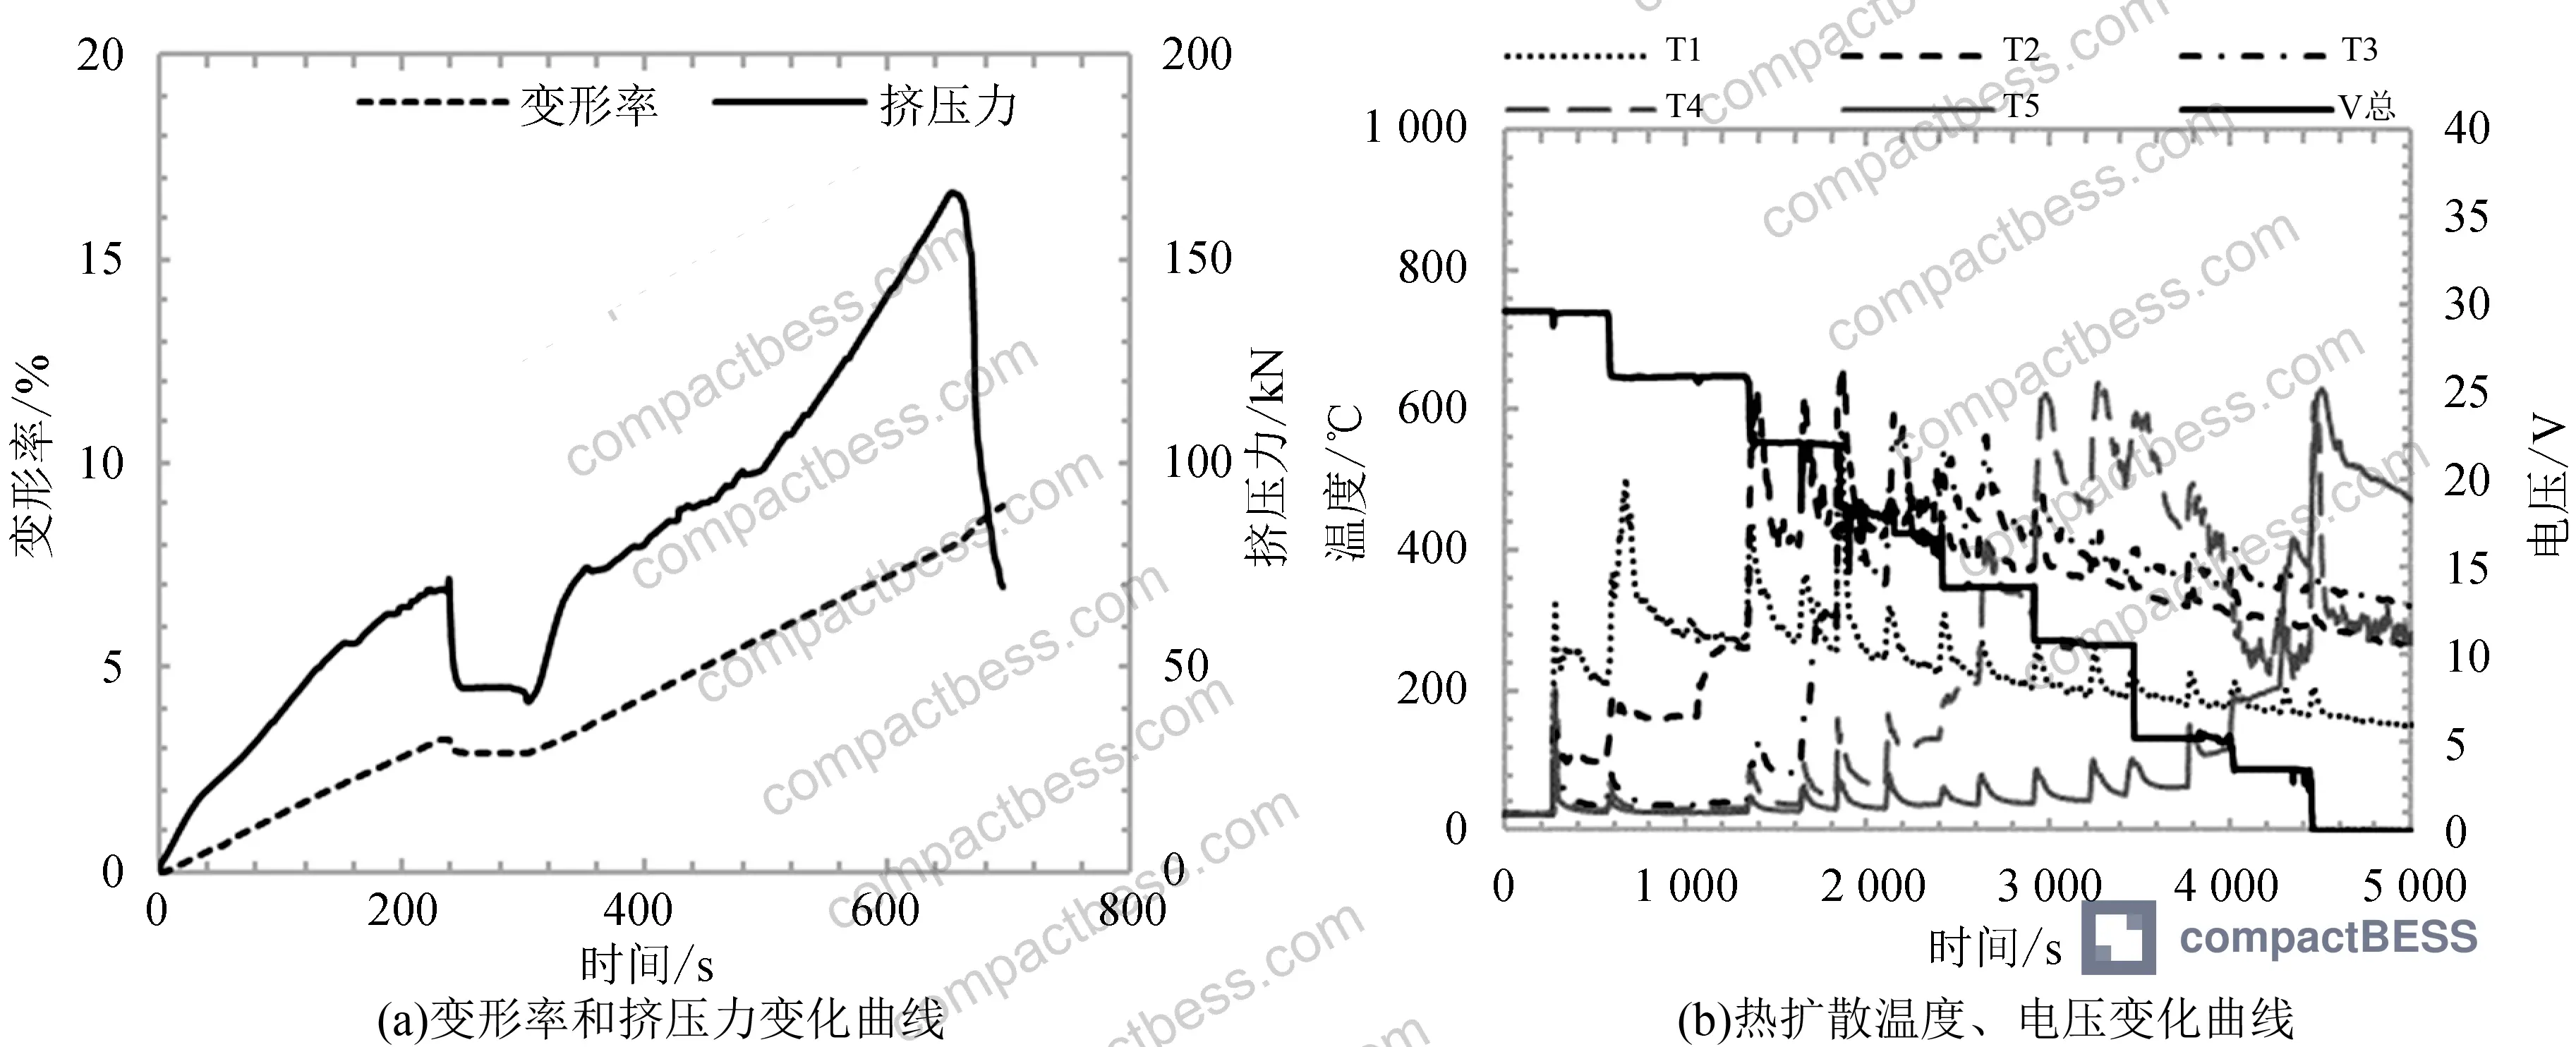
| 100% SOC | 33.6 kN | ~6.5% |
| 50% SOC | 165.9 kN | ~8.1% |
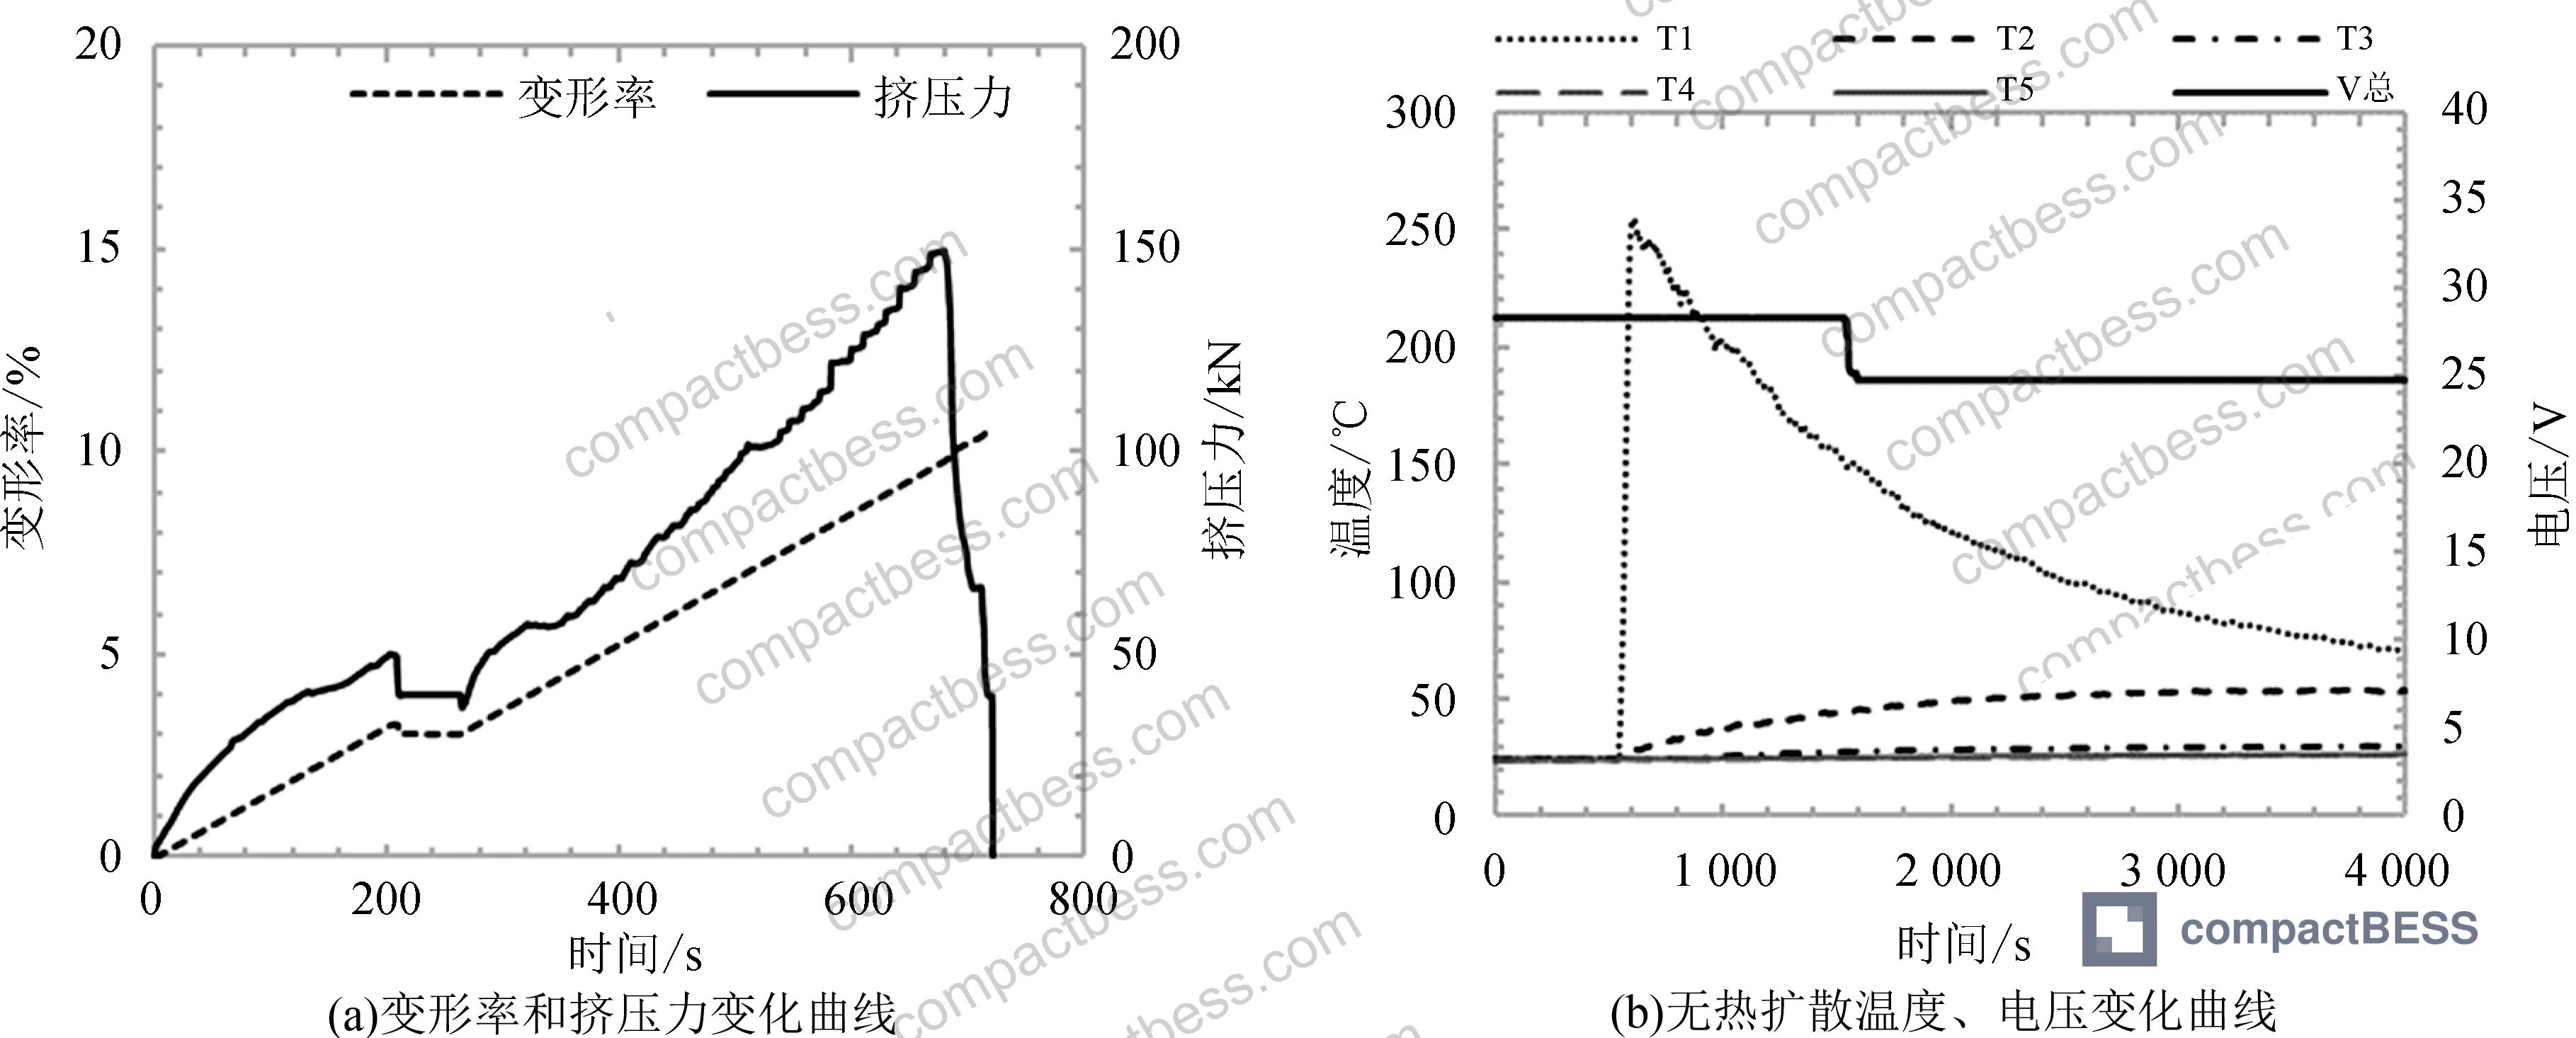
| 30% SOC | 149.9 kN | ~9.8% |
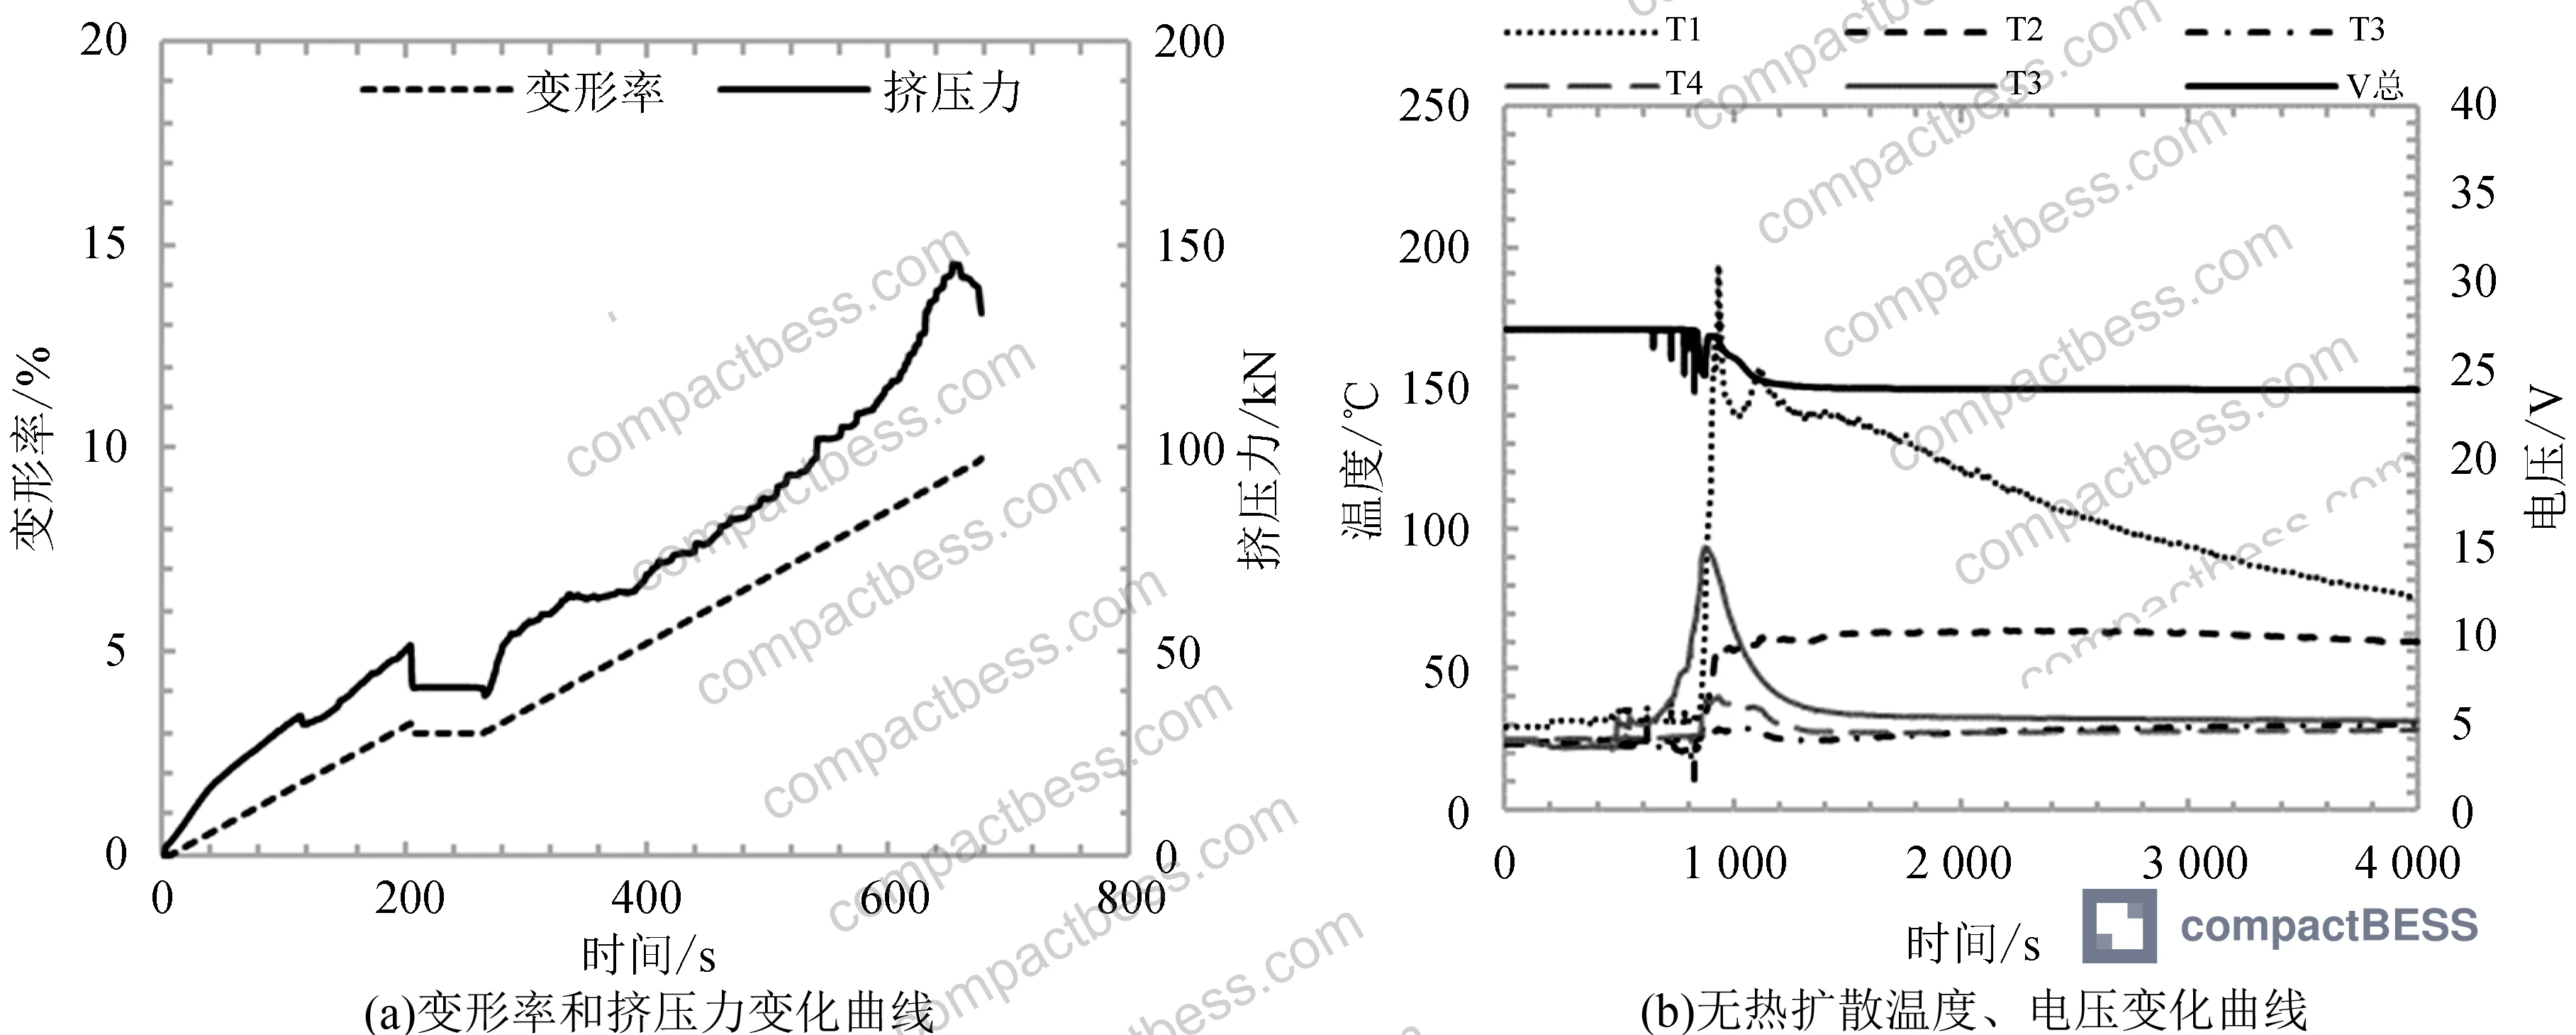
| 10% SOC | 145.7 kN | ~9.3% |
The 100% SOC module triggered at 33.6 kN — less than 20% of the force required to trigger thermal runaway in any of the lower-SOC groups. At the same time, it deformed the least before failing. This tells you that a fully charged module is mechanically fragile in a way that a 10% SOC module simply is not. The energy stored in the cell is, in effect, pre-loading the failure mechanism.
Critically, when the 100% SOC module’s first cell went into thermal runaway, all remaining 15 cells followed in sequence. The average propagation interval was approximately 220 seconds per cell — fast enough that emergency response would be severely challenged in a real shipping or storage scenario.
The 50% SOC module also propagated to all 16 cells, with an average interval of around 278 seconds — slightly slower, but complete propagation still occurred. The third cell in the 50% SOC sequence showed only smoke rather than explosion, indicating that the two preceding cells released insufficient energy to trigger a violent reaction — but propagation continued regardless.
Honestly, most buyers over-specify the cell chemistry and under-specify the transport SOC protocol. The performance gap between 100% and 50% SOC in terms of mechanical trigger threshold is nearly 5× — that’s not a minor variable, it’s a design decision.
Thermal Diffusion Propagation Behavior Across SOC States #
Below 30% SOC, something qualitatively different happens — and this is the finding with the most direct procurement relevance.
At 30% SOC, the crush test produced only a single temperature peak from the first cell. The module voltage dropped from 28.4 V to 24.8 V. No thermal diffusion occurred. The two cells closest to the indenter were damaged, but the remaining 14 cells were unaffected. The failure mode was smoke and black residue — no combustion propagation, no secondary ignition of adjacent cells.
At 10% SOC, the result was effectively identical: one temperature peak, voltage drop from 27.3 V to 23.8 V, a small quantity of white smoke, and a brief ignition of electrolyte leaking from the damaged cell shell. Again, no thermal diffusion. The 14 undamaged cells remained intact.
In supplier qualification, we reviewed three of six module-level samples from different suppliers that claimed compliance with transport SOC limits — and found that two of the three had no documented crush test data at all, and one had only single-cell (not module-level) data. Module-level propagation behavior cannot be inferred from single-cell results, particularly for 2P8S configurations where parallel cell coupling affects failure dynamics.
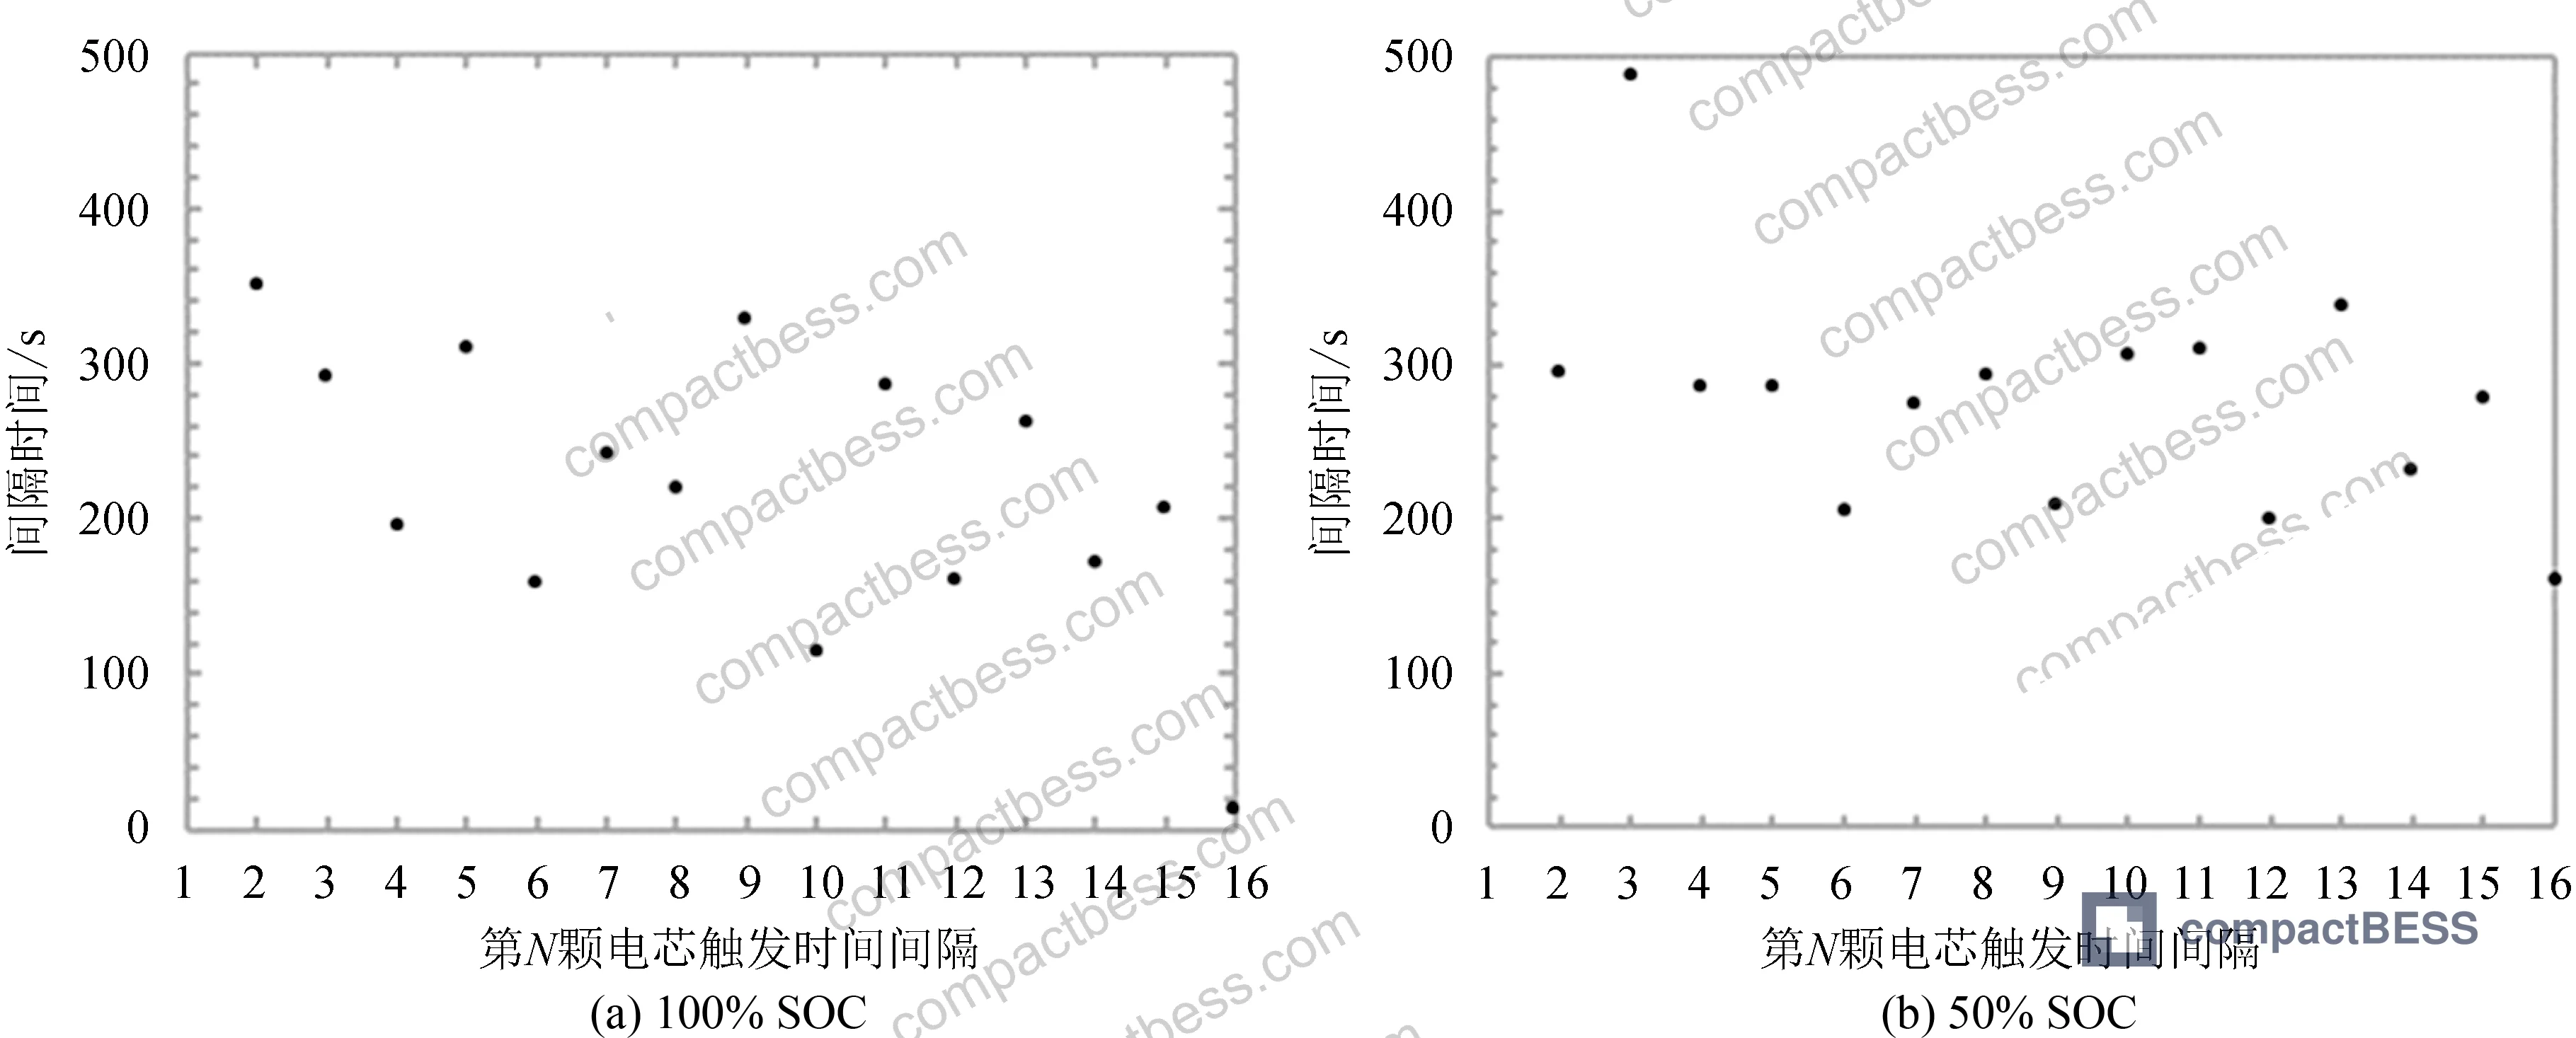
The trigger interval data for both 100% and 50% SOC groups shows considerable scatter — no consistent rhythmic pattern. The research attributes this to aerogel insulation layers between cells, which effectively decouple each thermal event into an independent “heating → runaway” sequence. This has a practical implication for suppression system design: you cannot count on regular, predictable propagation timing when specifying thermal management or fire detection in a multi-cell pack.
Most procurement teams don’t realize that module-level thermal diffusion behavior was only formally incorporated into mandatory testing standards relatively recently — and that many suppliers who passed certification years ago have not re-tested under updated module-level requirements. The UL 9540A Test Method for Evaluating Thermal Runaway Fire Propagation in Battery Energy Storage Systems addresses propagation at the system level, but gap coverage at the module level varies significantly by market and application.
Peak Temperature and Reaction Severity as a Function of SOC #
The temperature data reinforces the crush force findings. Peak thermocouple readings during thermal runaway decrease consistently as SOC decreases. The 100% SOC group produced the highest temperatures across all five measurement points. The 50% SOC group produced clearly lower peaks. The 30% and 10% SOC groups produced only a single localized peak at the trigger cell, with no meaningful temperature rise at the remaining thermocouple positions.
This matters for pack-level thermal management design. If a cell at 30% SOC or below fails mechanically, the thermal event is essentially self-contained within the local failure zone. If a cell at 100% SOC fails, the thermal event propagates with decreasing but still significant time intervals until the entire module has gone through runaway — and the propagation is unpredictable in timing.
For buyers specifying Cycle Life & Degradation limits alongside transport SOC protocols, this data also has implications for end-of-life cells: a cell at 80% capacity retention but 100% SOC carries the same propagation risk as a new cell at full charge.
The IEC 61960-3 Secondary lithium cells and batteries for portable applications standard covers electrical characterization but does not address module-level mechanical abuse at different SOC states — buyers relying solely on IEC 61960-3 certification for transport safety decisions are working from incomplete data.
Practical Guidance for Buyers #
The 30% SOC threshold is the actionable number from this research. Modules transported or stored above 30% SOC — particularly above 50% SOC — carry a demonstrably higher risk of full-module thermal propagation in the event of mechanical abuse. This isn’t theoretical: the test data shows that a 100% SOC module required only 33.6 kN to trigger the first cell, compared to roughly 150 kN at lower charge states.
When reviewing supplier documentation for NMC or NMC-811 module assemblies, ask for module-level crush test data specifically — not just cell-level abuse test certificates. The 2P8S configuration used in this study is representative of many commercial module designs, and the propagation behavior at 50% SOC still results in full-module thermal diffusion. A 30% SOC transport limit provides meaningful margin.
At compactbess.com, we connect global OEM buyers and energy storage integrators with verified Chinese manufacturers of NMC and LFP battery modules, including suppliers who can provide module-level safety test documentation. If your procurement spec includes a transport SOC ceiling, we can filter suppliers by that criterion during the matching process.
For packs destined for air or sea freight, cross-reference your SOC specification against UN 38.3 Recommendations on the Transport of Dangerous Goods — Lithium Battery Testing to ensure your SOC ceiling is documented in shipping compliance records.
Honestly, the single most underutilized lever in battery module procurement is the transport SOC specification. Buyers spend weeks negotiating cell chemistry and BMS features, then ship at 100% SOC because no one wrote down the rule.
Need help identifying qualified suppliers for NMC battery modules with documented thermal diffusion test data? Talk to our sourcing team →
Supplier Qualification Questions #
- Can you provide module-level crush test data showing the maximum compression force required to trigger thermal runaway in the first cell at both 100% SOC and ≤30% SOC conditions, using a cylindrical indenter of at least 150 mm diameter?
- At 100% SOC, what is the documented deformation rate (module compression as a percentage of total module length in the crush direction) at which the first cell enters thermal runaway — and is this below or above the 6.5% threshold identified in NMC-811 series testing?
- Has your module been tested for full thermal diffusion propagation at 50% SOC? If so, what was the average inter-cell propagation interval, and did all cells in the module eventually enter thermal runaway?
- What is your specified maximum SOC for module shipment and storage, and is this limit supported by crush-triggered thermal diffusion test data at the module level (not inferred from single-cell abuse data)?
- In your thermal diffusion test protocol, do you monitor temperature at a minimum of 5 points using Type-K thermocouples and record voltage data at ≥10 Hz to enable per-cell failure time resolution — and can you provide the raw data traces from your most recent batch qualification test?
Sourcing Checklist #
- ☐ Supplier has documented module-level crush test data (not single-cell only) showing thermal runaway trigger force at multiple SOC levels, with ≥3 SOC test points including 100% and ≤30%
- ☐ Transport SOC ceiling is specified as ≤30% in supplier’s product documentation or shipping guidelines, supported by crush test evidence showing no thermal diffusion below this threshold
- ☐ Thermal diffusion test used a deformation rate measurement referenced to total module length, with data showing ≥6% deformation at trigger for 100% SOC modules
- ☐ Module-level thermal runaway propagation test confirms that all 16 cells (or equivalent full module population) were monitored with per-cell temperature and voltage logging at ≥10 Hz sampling
- ☐ Supplier can demonstrate that modules at ≤30% SOC produce only a single localized temperature peak during crush abuse, with no propagation to adjacent cells and voltage drop of ≤5 V from pre-test module voltage
- ☐ Test report references IEC 62619 abuse test conditions or equivalent national standard, and specifies both maximum crush force and deformation rate at first-cell failure for each SOC test group
- ☐ Aerogel or equivalent inter-cell thermal insulation is specified in the module BOM, with documentation of how it affects inter-cell propagation interval timing
Key Specifications Table #
| Parameter | Recommended Value | Verification Method |
|---|---|---|
| Transport / storage SOC ceiling | ≤30% SOC | Crush-triggered module test showing no thermal diffusion below this threshold; OCV voltage mapping against cell calibration curve |
| Crush force trigger threshold at 100% SOC | >33.6 kN before first-cell thermal runaway (higher is safer) | Module-level crush test per IEC 62619 abuse test protocol; 150 mm cylindrical indenter at 0.1 mm/s |
| Deformation rate at first-cell thermal runaway trigger | ≥8% at ≤50% SOC (lower SOC modules show higher deformation tolerance) | Inline displacement sensor calibrated and traceable; deformation = indenter travel ÷ module length in crush direction |
| Inter-cell propagation interval at 50% SOC | ≥200 s average if diffusion occurs | Type-K thermocouple at ≥5 positions + 10 Hz data acquisition; voltage step analysis to isolate per-cell events |
| Module voltage drop after first-cell failure at ≤30% SOC | ≤5 V from pre-test OCV | Pre/post voltage measurement with 2P8S or equivalent topology; confirms localized failure without full-module cascade |
Can’t find a supplier meeting these specs? Submit your requirements and we’ll match you within 48 hours.
References #
Data source: State-of-Charge Dependence of Thermal Diffusion Propagation in High-Energy-Density NMC Battery Modules Under Crush Abuse Conditions, S.-H. Yu et al., Journal of the Electrochemical Society, 2024
Frequently Asked Questions #
What SOC level should NMC battery modules be stored and transported at to minimize thermal propagation risk?
Based on crush-triggered thermal diffusion testing across four SOC levels, modules maintained below 30% SOC did not propagate thermal runaway to adjacent cells even under mechanical abuse conditions. Above 50% SOC, full 16-cell propagation was observed in all tested samples. A 30% SOC ceiling is the evidence-based threshold for transport and storage safety in NMC-811 series module designs.
Why does the crush force required to trigger thermal runaway drop so dramatically at 100% SOC compared to lower charge states?
At 100% SOC, the electrochemical energy stored in the cell effectively pre-stresses the internal structure and increases the reactivity of electrode materials. The test data shows a trigger force of 33.6 kN at full charge versus approximately 145–166 kN at charge states of 10–50% — a roughly 4–5× difference. This is not a gradual relationship; the behavior at 100% SOC is qualitatively different from the sub-50% SOC range.
Does aerogel insulation between cells prevent thermal diffusion?
No — it slows it, but does not prevent it. In the 100% and 50% SOC test groups, full propagation to all 16 cells occurred despite aerogel layers between cells. The insulation appears to create timing scatter in the propagation sequence and may slightly increase the average interval between cell failures, but it does not arrest the cascade once initiated at high SOC.
What is the difference between single-cell thermal runaway data and module-level thermal diffusion data, and why does it matter for procurement?
Single-cell abuse data characterizes how one cell fails in isolation — heat release, gas generation, and temperature peak. Module-level diffusion data tells you whether that failure propagates to neighboring cells and at what rate. A cell that passes single-cell abuse testing may still participate in a full-module cascade depending on SOC, inter-cell thermal coupling, and pack geometry. Procurement decisions based only on single-cell certification data are systematically incomplete for module-level safety evaluation.
Can LFP chemistry modules be expected to behave the same way under SOC-dependent crush loading?
Not necessarily. The test data in this analysis applies specifically to NMC-811 series cells, which have higher energy density and more reactive cathode chemistry than LFP. LFP chemistry generally shows lower peak temperatures during thermal runaway and higher thermal stability, which may shift the SOC threshold at which diffusion occurs — but module-level crush test data specific to LFP at multiple SOC points should still be requested from any supplier making safety claims for transport or storage.
Published by compactbess.com Technical Team | Request a sourcing quote


