

TL;DR #
A pouch cell module using 1.1 mm polyurethane foam spacers operating within a 9.3 mm per-cell dimensional envelope maintains restraint pressure between 22 kPa (0% SOC) and 34 kPa (100% SOC) — a range that keeps foam compression below 0.38 and prevents the steep nonlinear pressure increase that begins above 0.50 compression ratio. Buyers who ignore restraint pressure design when specifying pouch cell modules are essentially outsourcing a critical safety and cycle-life variable to whoever assembles the pack. Before issuing any RFQ for a pouch cell module, require your supplier to provide equilibrium pressure calculation data across the full SOC range — not just a foam thickness callout.
Overview #
Restraint pressure is one of the most under-specified parameters in pouch cell module procurement, and the consequences of getting it wrong show up slowly — as premature capacity fade, rising internal resistance, or in worst cases, structural delamination of electrodes. Engineering teams at an automotive OEM research institute conducted a controlled physical test campaign on 36 Ah NMC pouch cells (226 mm × 161 mm × 8.2 mm nominal thickness), assembling a 1P12S module configuration and systematically characterizing the pressure-thickness interaction across three load levels and two SOC endpoints. Seven individual cells were tested at 60, 200, and 400 kg applied loads — equivalent to surface pressures of 16.2, 53.8, and 108.0 kPa — at both 0% and 100% SOC, with module-level pressure cycling validated against theoretical equilibrium calculations over 90 charge-discharge cycles. The experiment’s value to procurement engineers is that it generates the intersection curves needed to define a safe operating pressure window before you commit to module dimensions and foam selection.
Pouch cell format is well covered in our Cell Formats & Form Factors documentation, but the mechanical constraints of module assembly are where many design reviews stall — or where cost-cutting on spacer materials creates warranty problems two years after deployment.
Pouch Cell Thickness Variation and Its Direct Effect on Module Restraint Pressure #
This is where the physics of pouch format works against you if you haven’t designed for it. Unlike prismatic or cylindrical cells, a pouch cell has no rigid housing to absorb electrode stack expansion — every bit of volume change translates directly into mechanical force on the module structure.
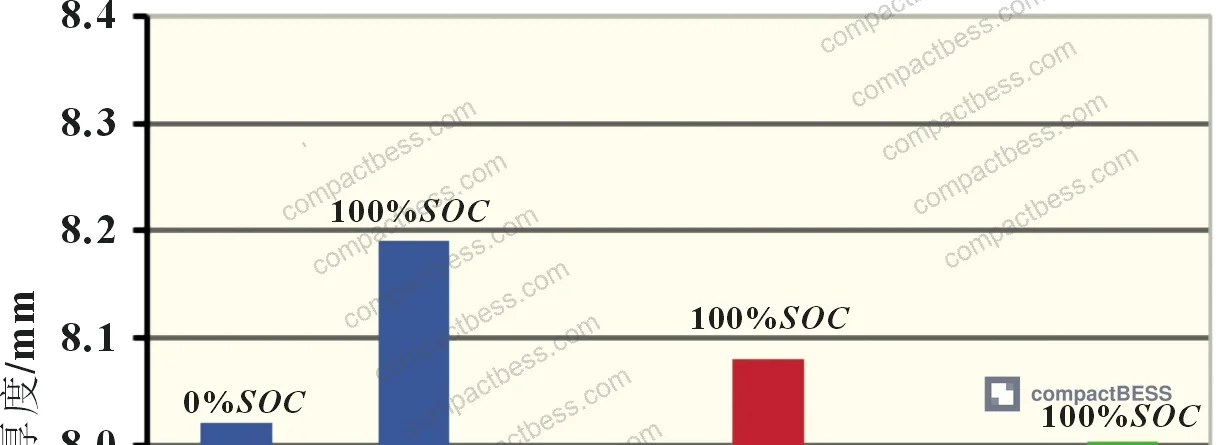
Test data from 7 cell samples across the three load conditions shows a clear and quantifiable pattern. At 0% SOC with a 16.2 kPa surface pressure, cell thickness measured 8.02 mm. At 100% SOC under the same load, that same cell measured 8.19 mm — a 0.17 mm expansion driven primarily by lithium intercalation into the graphite anode causing layer spacing to increase. Push the load up to 108.0 kPa, and the 100% SOC thickness compresses back to 8.00 mm, showing that mechanical pressure and electrochemical expansion are in direct competition.
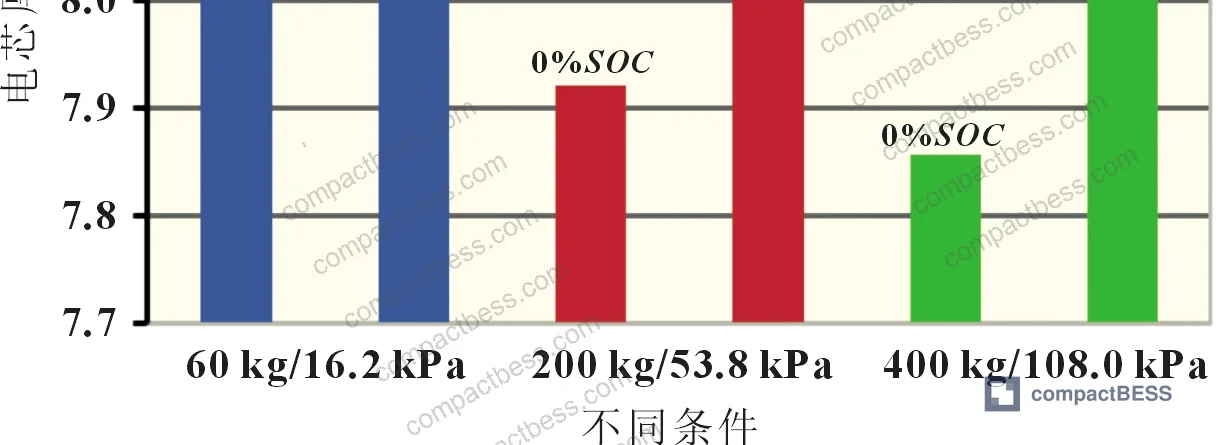
| Load / Surface Pressure | Cell Thickness at 0% SOC (mm) | Cell Thickness at 100% SOC (mm) |
|---|---|---|
| 60 kg / 16.2 kPa | 8.02 | 8.19 |
| 200 kg / 53.8 kPa | 7.92 | 8.08 |
| 400 kg / 108.0 kPa | 7.85 | 8.00 |
The practical implication: the thickness delta between 0% and 100% SOC is approximately 0.17–0.19 mm under low pressure conditions, and this delta is what the foam spacer must absorb without either going slack (pressure drops to near zero) or overcompressing (pressure spikes nonlinearly). A module designed with a fixed rigid envelope and no compliant spacer would see this delta converted entirely into pressure change — and that pressure change would directly impact ion transport path length, contact resistance at the electrode-electrolyte interface, and ultimately cycle life.
Most procurement teams don’t realize that the IEC 62619:2022 Safety requirements for secondary lithium cells and batteries addresses mechanical integrity requirements for battery modules but does not prescribe specific restraint pressure ranges — that calculation responsibility sits entirely with the module designer. If your supplier can’t show you a pressure design calculation, they almost certainly haven’t done one.
Foam Spacer Compression Ratio: The Design Variable Most Suppliers Get Wrong #
The foam spacer is doing real engineering work in a pouch module. It isn’t packaging material. Its job is to maintain a defined, stable contact pressure against the cell surface across the entire SOC range, absorbing the cell’s thickness excursion without either losing contact or generating excessive restraint force.
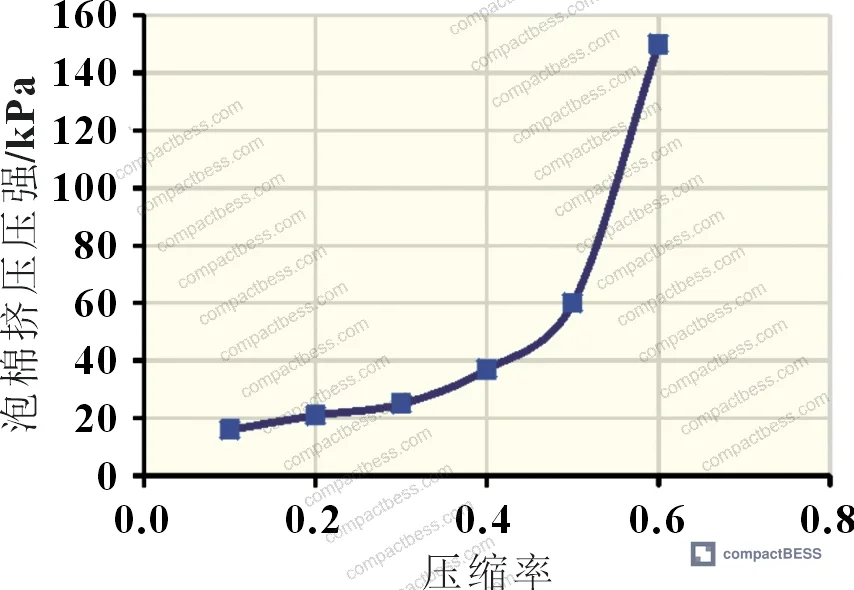
Polyurethane foam follows a well-characterized pressure-compression curve: pressure increases gradually with compression ratio up to about 0.50, then begins to climb steeply. Above a compression ratio of 0.50, you’re operating in a nonlinear regime where small additional cell expansion (such as from end-of-life swelling) causes disproportionately large pressure increases.
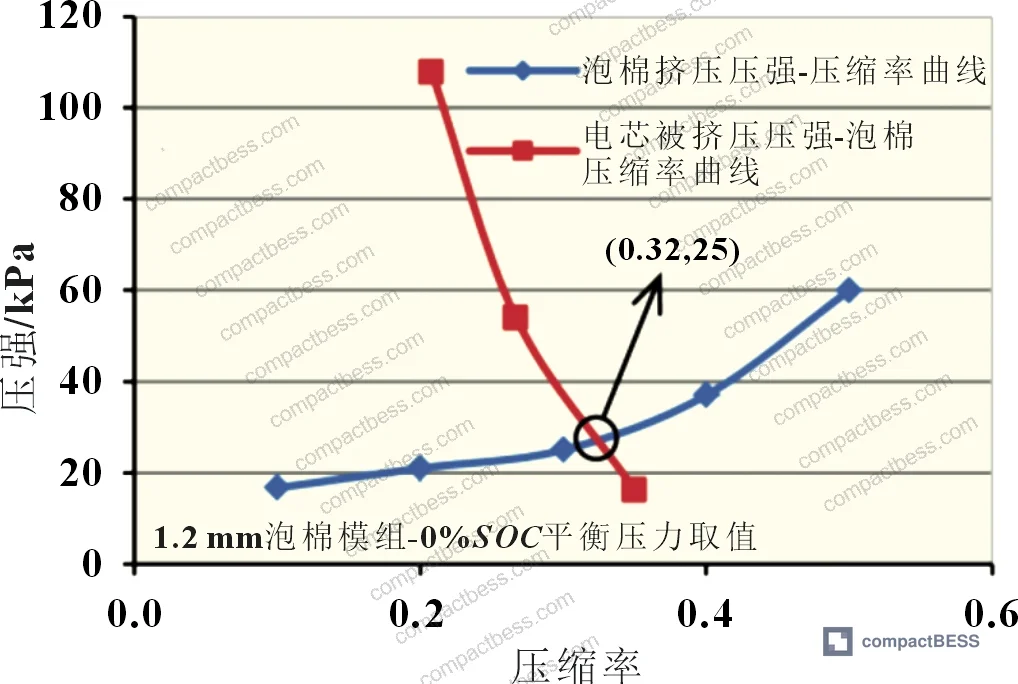
The research evaluated both 1.1 mm and 1.2 mm foam thickness options. With 1.2 mm foam under the 9.3 mm per-cell design dimension:
- At 0% SOC: foam compression ratio reaches 0.32, equilibrium pressure = 25 kPa
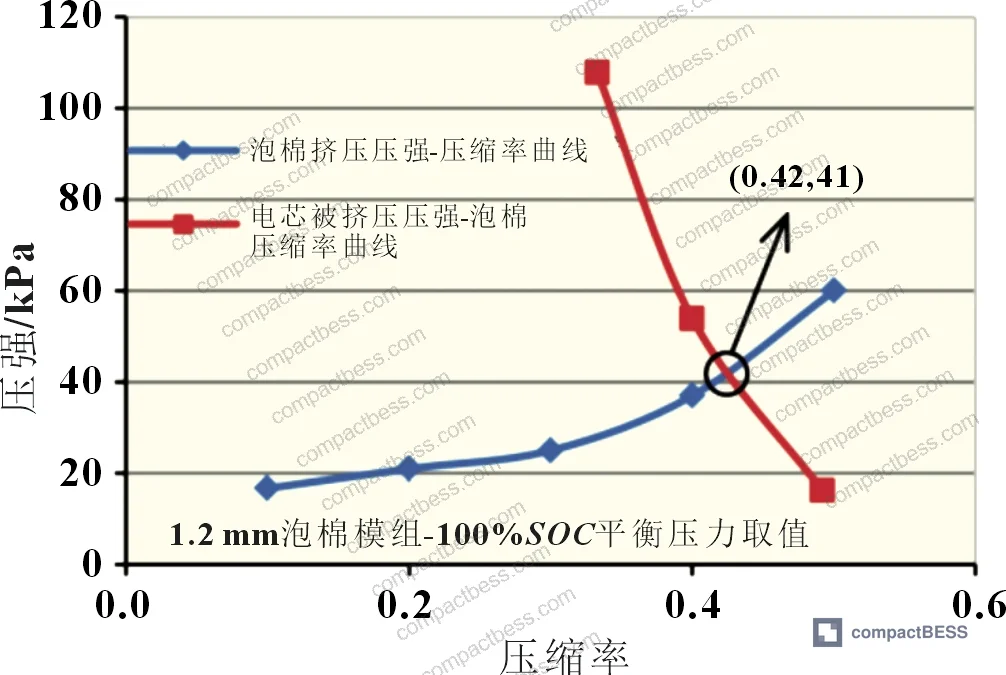
- At 100% SOC: foam compression ratio reaches 0.42, equilibrium pressure = 41 kPa
The 0.42 compression ratio at 100% SOC looks acceptable in a new cell. But cells don’t stay new. As cells age, end-of-life swelling typically adds further thickness beyond the 100% SOC expansion already captured in fresh-cell testing. With 1.2 mm foam, the headroom between the design maximum (0.42) and the nonlinear threshold (0.50) is only 0.08 — thin margin when you factor in dimensional tolerances on the cell, foam, and thermal plate, which can individually contribute ±0.05 mm each.
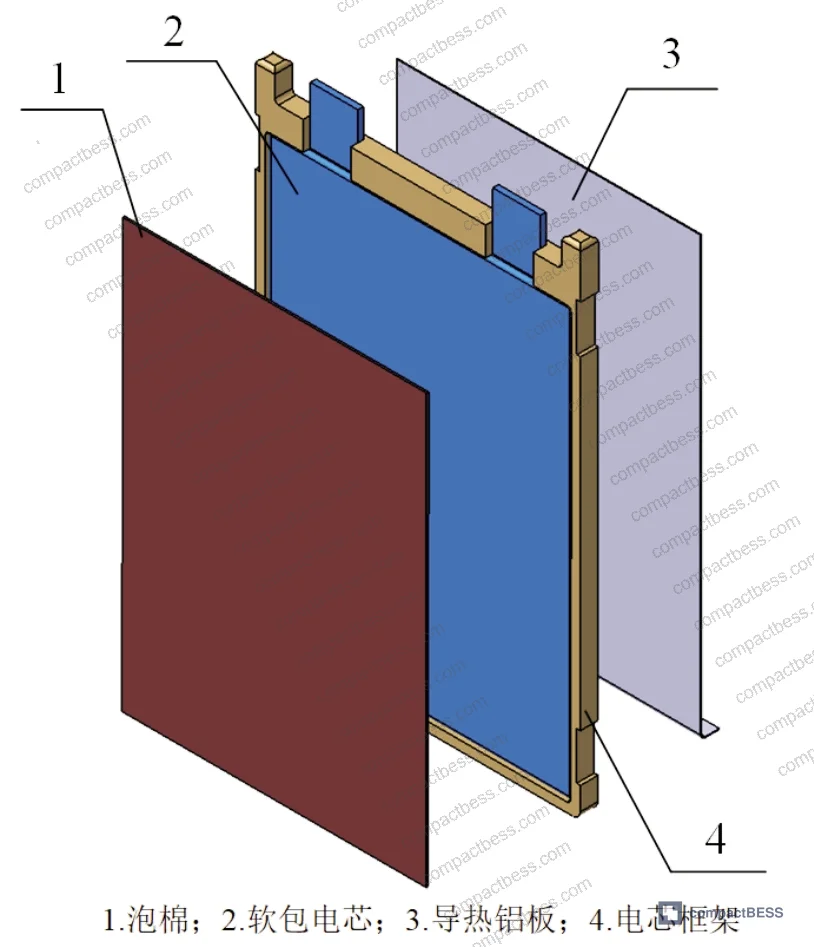
Switching to 1.1 mm foam changes the picture:
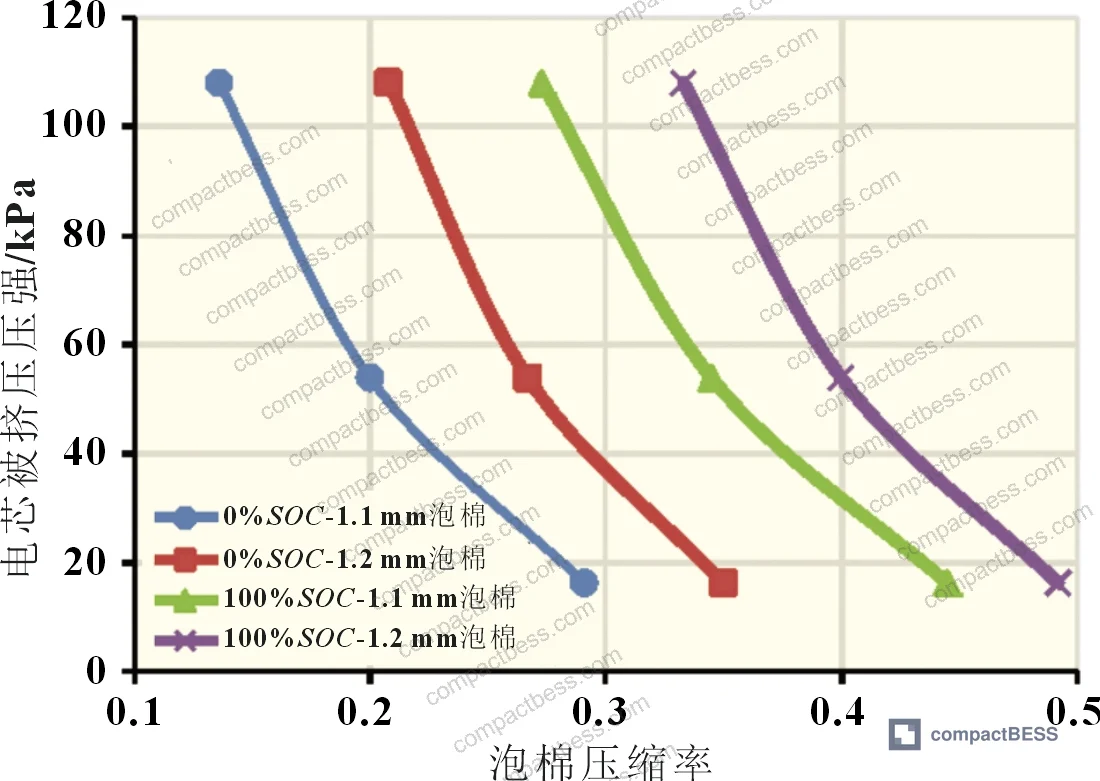
- At 0% SOC: compression ratio = 0.27, equilibrium pressure = 22 kPa
- At 100% SOC: compression ratio = 0.38, equilibrium pressure = 34 kPa

The 1.1 mm foam configuration keeps the compression ratio comfortably below 0.50 across the entire SOC range and preserves meaningful margin for end-of-life dimensional growth. This is why the test data supports selecting 1.1 mm foam with a 9.3 mm per-cell design envelope for this 36 Ah NMC cell geometry.
Honestly, a lot of buyers over-specify cell chemistry and under-specify module mechanics. You’ll spend three months negotiating NMC cathode stoichiometry and then accept whatever foam thickness the module supplier puts in without asking for the pressure curve data. That mismatch is where field failures come from.
In supplier qualification, we saw modules submitted for evaluation where the foam specification was stated only as “flame-retardant PU foam, 1.0–1.5 mm” with no compression curve data provided. Three of those modules showed pressure variability greater than 30% between cells at full charge — a direct consequence of undefined foam mechanical properties. That variability correlates to capacity imbalance and accelerated cell-level degradation in the weaker cells.
Equilibrium Pressure Calculation and Experimental Validation #
The equilibrium pressure method described in the test campaign is the key design tool. The principle: at any given SOC, the cell surface pressure equals the foam counter-pressure. Plotting both “cell compression vs. foam compression ratio” and “foam pressure vs. compression ratio” on the same axes, their intersection gives the actual module pressure at that SOC. The minimum module pressure corresponds to 0% SOC (minimum cell thickness, maximum foam relaxation), and the maximum module pressure corresponds to 100% SOC.
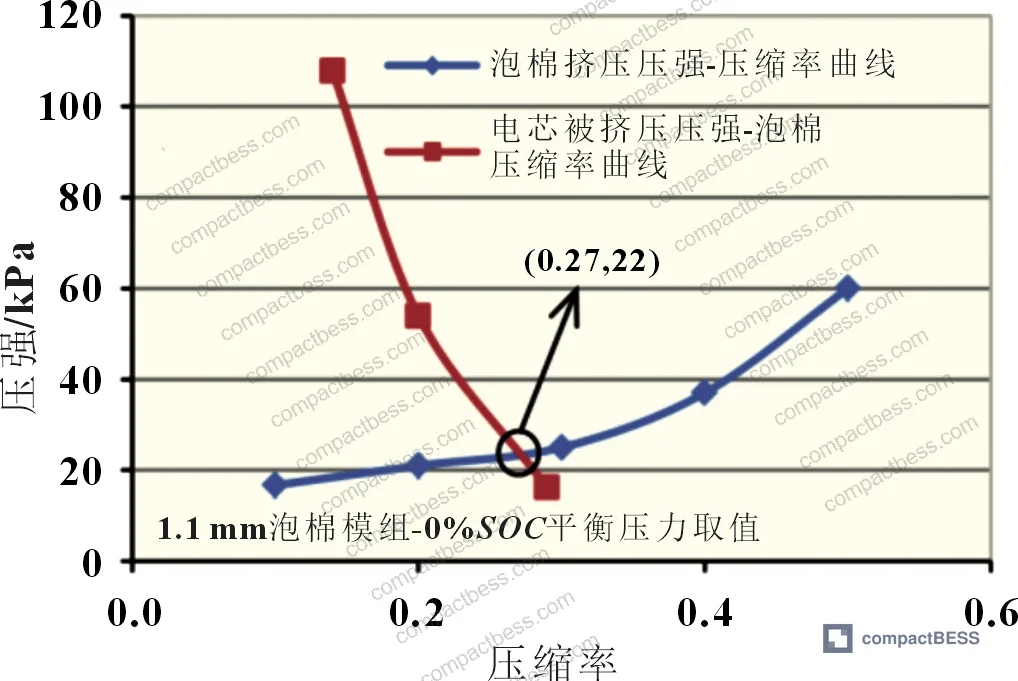
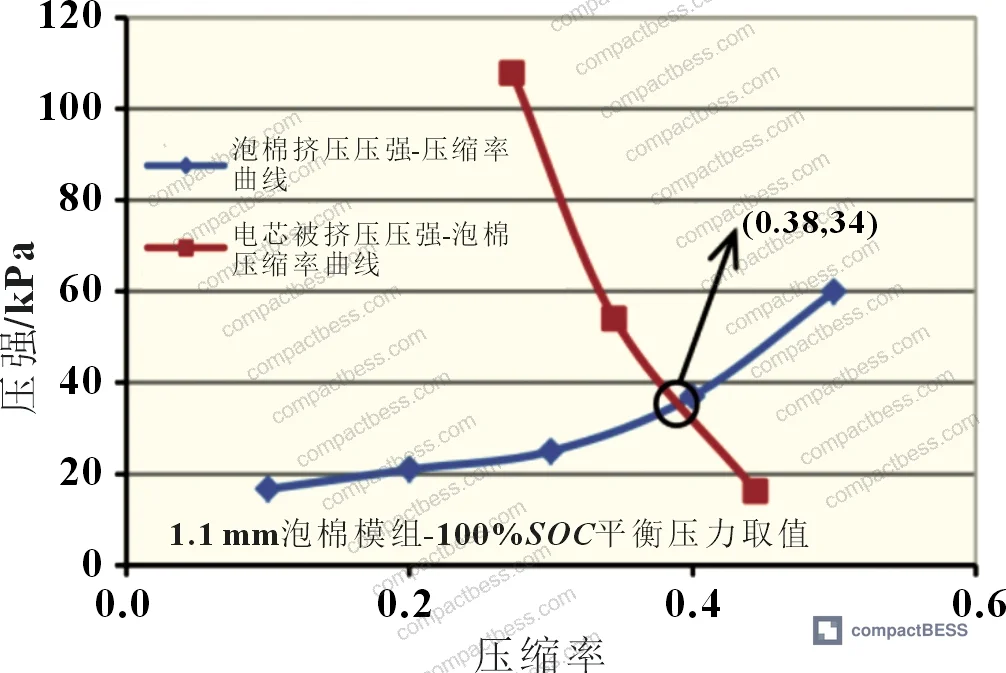
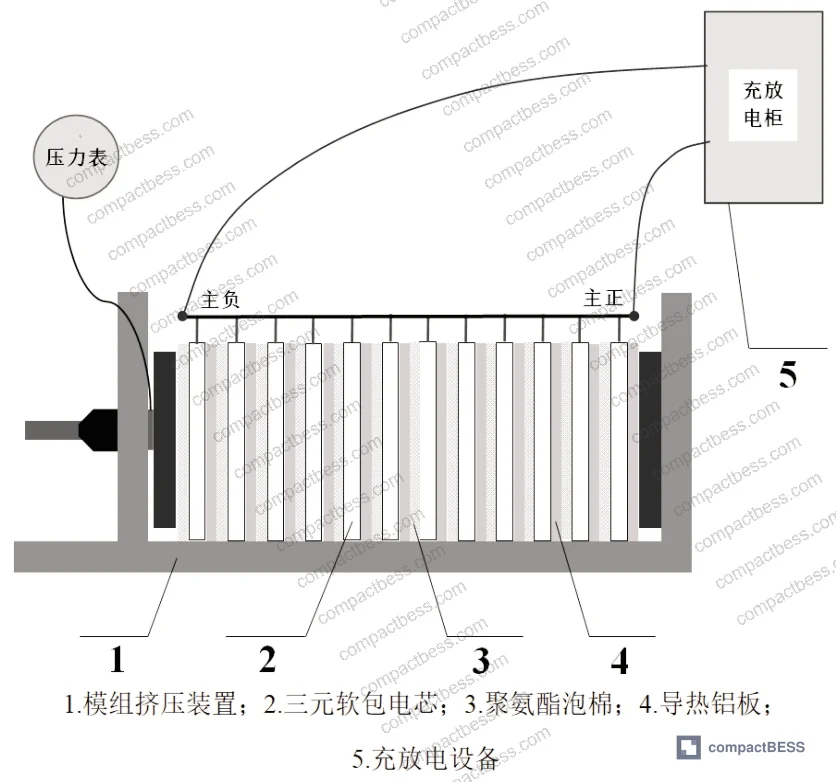
This isn’t theoretical — the method was validated against physical module tests. The 1P12S module was cycled three times for each foam configuration, with pressure recorded at 0% and 100% SOC. Comparing theoretical to measured:
| Foam Thickness | SOC State | Actual Pressure (kPa) | Theoretical Pressure (kPa) | Error |
|---|---|---|---|---|
| 1.1 mm | 0% SOC | 23 | 22 | ~4.5% |
| 1.1 mm | 100% SOC | 31 | 34 | ~8.8% |
| 1.2 mm | 0% SOC | 27 | 25 | ~8.0% |
| 1.2 mm | 100% SOC | 44 | 41 | ~7.3% |
Error across all four conditions stayed below 10%, with the larger deviations appearing at higher compression ratios — consistent with the nonlinear region of the foam’s pressure-compression curve where small dimensional uncertainty creates larger pressure variance.
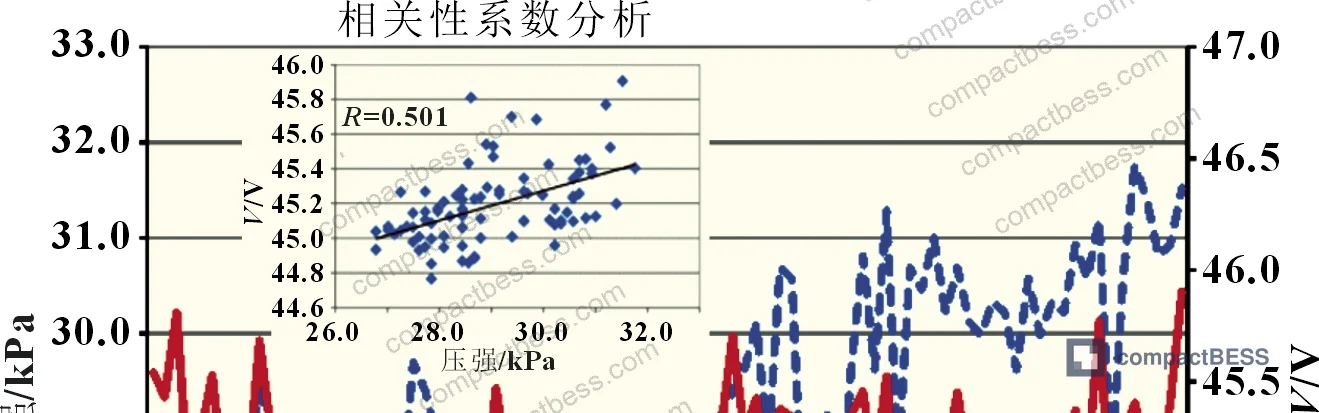
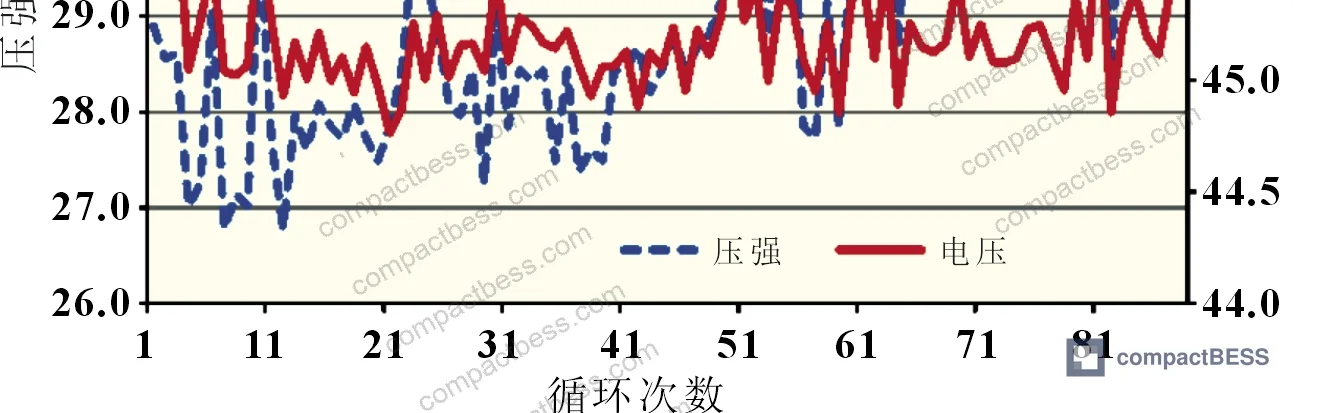
The test campaign then extended to 90 charge-discharge cycles at 1C rate, recording module pressure alongside module voltage at 50% SOC. Statistical correlation analysis of those 90 data points returned a correlation coefficient of R = 0.501. With 90 samples, the critical threshold for significance is R = 0.283 — so the measured R exceeds that threshold, confirming a statistically significant positive correlation between electrochemical state and mechanical pressure. This is not a subtle effect: pressure and SOC track each other closely enough that module pressure could theoretically be used as a secondary SOC indicator.

For buyers evaluating Cycle Life & Degradation in pouch modules, this correlation has a practical implication: a module that shows drifting or erratic pressure readings over cycling is signaling a cell-level electrochemical problem — either capacity imbalance, gas generation, or electrode delamination. The pressure sensor data, if present in the module design, isn’t just mechanical instrumentation; it’s electrochemical intelligence.
Compliance frameworks like UL 9540A Test Method for Evaluating Thermal Runaway Fire Propagation in Battery Energy Storage Systems require evaluation of mechanical integrity under thermal stress, and poorly constrained pouch modules — either over- or under-pressured — present elevated risk in those propagation scenarios. Restraint pressure design isn’t just a performance specification; it’s a safety architecture decision.
For modules destined for EU markets, note that EU Battery Regulation 2023/1542 — Requirements for batteries placed on the EU market increasingly requires documented design validation data as part of the technical file. A supplier who can’t produce equilibrium pressure calculations and physical validation data may struggle to support your CE technical documentation.
Practical Guidance for Buyers #
When you’re evaluating pouch cell module suppliers, the restraint pressure question separates the engineering teams from the assembly shops. Ask specifically for the foam compression ratio at both 0% and 100% SOC — not just the foam material specification. The acceptable operating window is clear: compression ratio should stay below 0.50 at 100% SOC on new cells, with sufficient margin (target ≤ 0.40) to accommodate end-of-life swelling without triggering nonlinear pressure escalation.
For a 36 Ah class NMC pouch cell at 8.2 mm nominal thickness, the validated design is a 9.3 mm per-cell envelope with 0.5 mm thermal aluminum plate and 1.1 mm polyurethane foam — producing a pressure range of 22–34 kPa across the SOC range. Any significant deviation from this dimensional envelope should come with updated equilibrium pressure calculations, not just a verbal assurance from the supplier.
Verify the foam specification includes pressure-compression curve data from the foam supplier. Generic “PU foam” callouts without mechanical characterization are a red flag. Flame-retardant foam adds chemical complexity; confirm that the flame-retardant treatment doesn’t significantly alter the compression curve in the 0–0.50 range.
At compactbess.com, we connect global OEM engineers and sourcing teams with verified Chinese manufacturers of pouch cell modules and pack assemblies — our qualification process specifically checks whether suppliers maintain mechanical design documentation including restraint pressure calculations. If you’re building a procurement specification for a pouch cell application and need suppliers who can actually answer these questions, our team can help narrow the field.
Need help identifying qualified suppliers for pouch cell modules with validated restraint pressure design? Talk to our sourcing team →
Supplier Qualification Questions #
- Can you provide the foam compression ratio values at both 0% SOC and 100% SOC for your module design, and confirm the maximum compression ratio does not exceed 0.50 under fresh-cell 100% SOC conditions?
- What are the equilibrium pressure values at 0% SOC and 100% SOC for your pouch module configuration, and how were these derived — by intersection of the foam pressure-compression curve and cell compression-foam compression curve, or by another method?
- For the foam spacer used in your module, can you supply the supplier-provided “applied pressure vs. compression ratio” characteristic curve, and what foam thickness (mm) is specified — with tolerance — in your module design documentation?
- What is the per-cell dimensional envelope (cell thickness + thermal plate + compressed foam) in your module design, and what is the calculated pressure error between theoretical equilibrium values and physical test measurements across at least 3 charge-discharge cycles?
- Has your pouch cell module undergone extended cycling (≥90 cycles) with simultaneous pressure and voltage monitoring at mid-SOC, and can you provide correlation coefficient data between module pressure and electrochemical state to confirm the two are tracking within expected bounds?
Sourcing Checklist #
- ☐ Supplier provides foam compression ratio data at 0% SOC (target ≤ 0.30) and 100% SOC (target ≤ 0.40) for the specified module design
- ☐ Module per-cell envelope dimension is documented (e.g., 9.3 mm = 8.2 mm cell + 0.5 mm thermal plate + 0.6 mm compressed foam) and matches equilibrium pressure calculation inputs
- ☐ Foam spacer specification includes supplier-provided pressure-compression curve confirming near-linear behavior below 0.50 compression ratio
- ☐ Equilibrium pressure calculation has been validated against physical module test data with measured error ≤ 10% across both 0% SOC and 100% SOC conditions
- ☐ Module design documentation confirms maximum restraint pressure at 100% SOC does not exceed 41 kPa for the 9.3 mm design envelope, with margin for end-of-life cell swelling
- ☐ Foam material is specified as flame-retardant polyurethane, with confirmation that flame-retardant treatment does not alter the compression curve behavior below 0.50 compression ratio
- ☐ Cell thickness specification includes tolerance band at both 0% and 100% SOC under representative surface pressure (16–54 kPa range), not just nominal dimensions at unconstrained state
- ☐ Supplier has performed module cycling with concurrent pressure monitoring, with data showing pressure variation correlates to SOC state (IEC 62619:2022 mechanical integrity criteria met)
Key Specifications Table #
| Parameter | Recommended Value | Verification Method |
|---|---|---|
| Per-cell module envelope (cell + thermal plate + compressed foam) | 9.3 mm | Caliper measurement of assembled layer stack; compare to design drawing |
| Foam spacer thickness (polyurethane, flame-retardant) | 1.1 mm nominal (±0.05 mm tolerance) | Caliper measurement of uncompressed foam sample from production lot |
| Foam compression ratio at 100% SOC (new cell) | ≤ 0.38 (target), ≤ 0.50 (hard limit) | Calculate from equilibrium pressure curve intersection; verify against physical module pressure measurement |
| Module equilibrium pressure range (0%–100% SOC) | 22–34 kPa for 1.1 mm foam / 9.3 mm envelope | Pressure gauge on module test fixture during 1C charge-discharge; compare to theoretical values |
| Theoretical vs. actual pressure agreement | Error ≤ 10% at both SOC endpoints | Three-cycle physical test; record pressure at 0% and 100% SOC; compare to calculation |
| Cell surface pressure range (safe operating window) | 16–108 kPa (test range); design target 22–40 kPa for module service | Surface pressure calculated from applied load and cell area (226 mm × 161 mm = 364 cm²) |
Can’t find a supplier meeting these specs? Submit your requirements and we’ll match you within 48 hours.
References #
Data source: Restraint Pressure Design and Experimental Validation for Pouch Cell Battery Modules, C.-L. Zhu et al., Journal of the Electrochemical Society, 2023
Frequently Asked Questions #
What happens if the foam compression ratio exceeds 0.50 in a pouch cell module?
Above 0.50 compression ratio, the pressure-compression relationship becomes nonlinear — small additional cell thickness increases (from further charging or end-of-life swelling) produce disproportionately large pressure spikes. Sustained overpressure compresses electrode pores and separator structures, blocking lithium-ion transport channels. This increases internal resistance measurably and accelerates capacity fade. In severe cases, mechanical deformation of the electrode stack creates localized plating conditions and safety risk.
Why do pouch cells change thickness with SOC, and how large is the effect?
The primary mechanism is lithium intercalation into the graphite anode: as lithium ions embed between graphite layers on charge, the interlayer spacing increases, causing the anode — and therefore the whole cell stack — to expand. For the 36 Ah NMC cells tested here, the thickness delta between 0% and 100% SOC ranges from 0.17 mm at low restraint pressure (16.2 kPa) to approximately 0.15 mm at higher pressure (108.0 kPa). That’s not a large absolute number, but inside a fixed-dimension module, it drives a measurable and predictable pressure change.
Can restraint pressure data be used to estimate SOC without a voltage measurement?
The 90-cycle test data shows a statistically significant positive correlation between module pressure and electrochemical state (R = 0.501, exceeding the 90-sample significance threshold of R = 0.283). So yes, pressure tracks SOC closely enough to serve as a secondary indicator or a cross-check. This isn’t a replacement for voltage-based SOC estimation, but it’s a useful diagnostic signal — and a module that shows pressure-voltage decoupling over cycling is flagging a cell-level anomaly worth investigating.
Is the equilibrium pressure design method applicable to cell chemistries other than NMC?
The method is chemistry-agnostic in principle — it depends only on characterizing the cell’s thickness-vs-pressure curve and the foam’s pressure-vs-compression curve, then finding their intersection. However, LFP cells typically show lower SOC-driven thickness variation than NMC, so the pressure window will be narrower and the foam selection less critical. High-silicon-anode cells, by contrast, show much larger expansion — potentially 3–5× the graphite case — and would require either thicker foam, larger per-cell envelopes, or active pressure management to stay within safe compression ratios.
What foam thickness should I specify if I don’t have my own pressure-compression curve data?
Don’t guess. The key finding here is that 1.2 mm foam, which might seem like it provides more cushioning, actually produces higher compression ratios (up to 0.42 at 100% SOC) and leaves less margin for end-of-life swelling than the 1.1 mm option within the same 9.3 mm envelope. The counterintuitive result — thinner foam, safer pressure margin — only makes sense when you run the equilibrium calculation. Require your foam supplier to provide the full pressure-compression characteristic curve before finalizing the module design.
Published by compactbess.com Technical Team | Request a sourcing quote


