

TL;DR #
Battery modules subjected to high-speed impact (7 m/s) develop internal short circuits at significantly lower intrusion depths than under quasi-static loading — in the X direction, the failure intrusion threshold drops from 41.666 mm at low speed to 29.715 mm at high speed, a 29% reduction in damage tolerance. This means modules that pass standard quasi-static crush tests may still fail catastrophically in real crash scenarios, and buyers specifying modules for EV or mobile energy applications must demand high-speed impact data, not just static test compliance. Before finalizing a module design or qualifying a supplier, request drop-weight impact test results at ≥7 m/s across all three loading axes alongside the standard low-speed squeeze data.
Overview #
Most procurement teams evaluate battery module mechanical safety almost entirely through quasi-static crush compliance — and that’s a costly blind spot. The research underpinning this article was conducted at an automotive engineering research center using a structured series of both quasi-static (9 mm/min hydraulic press) and dynamic drop-weight impact tests (200 kg hammer, 7 m/s) on 8-cell lithium-ion prismatic modules. The test matrix covered all three spatial loading axes — frontal (X), lateral (Y), and vertical (Z) — with load cells, high-speed cameras, non-contact displacement measurement, and individual cell voltage monitoring running simultaneously. That combination of mechanical and electrical data capture is what separates this dataset from most supplier-provided test reports, which typically show force-displacement curves but omit real-time voltage collapse signatures.
Each module in the test program contained 8 prismatic aluminum-cased cells arranged in a 2P4S configuration, with a nominal module voltage of 10 V and a capacity of 6 Ah. The individual cells had a rated voltage of 2.5 V and a capacity of 1.5 Ah each. Low-speed tests used fully charged (high-SOC) modules; high-speed impact tests used low-SOC modules — a deliberate design choice to isolate the speed variable while managing fire risk during testing.
For buyers sourcing lithium-ion cell formats and form factors for integration into vehicular, portable, or stationary energy applications, the directional mechanical behavior documented here has direct implications for pack orientation, enclosure design, and the safety margins you should be demanding from your module suppliers.
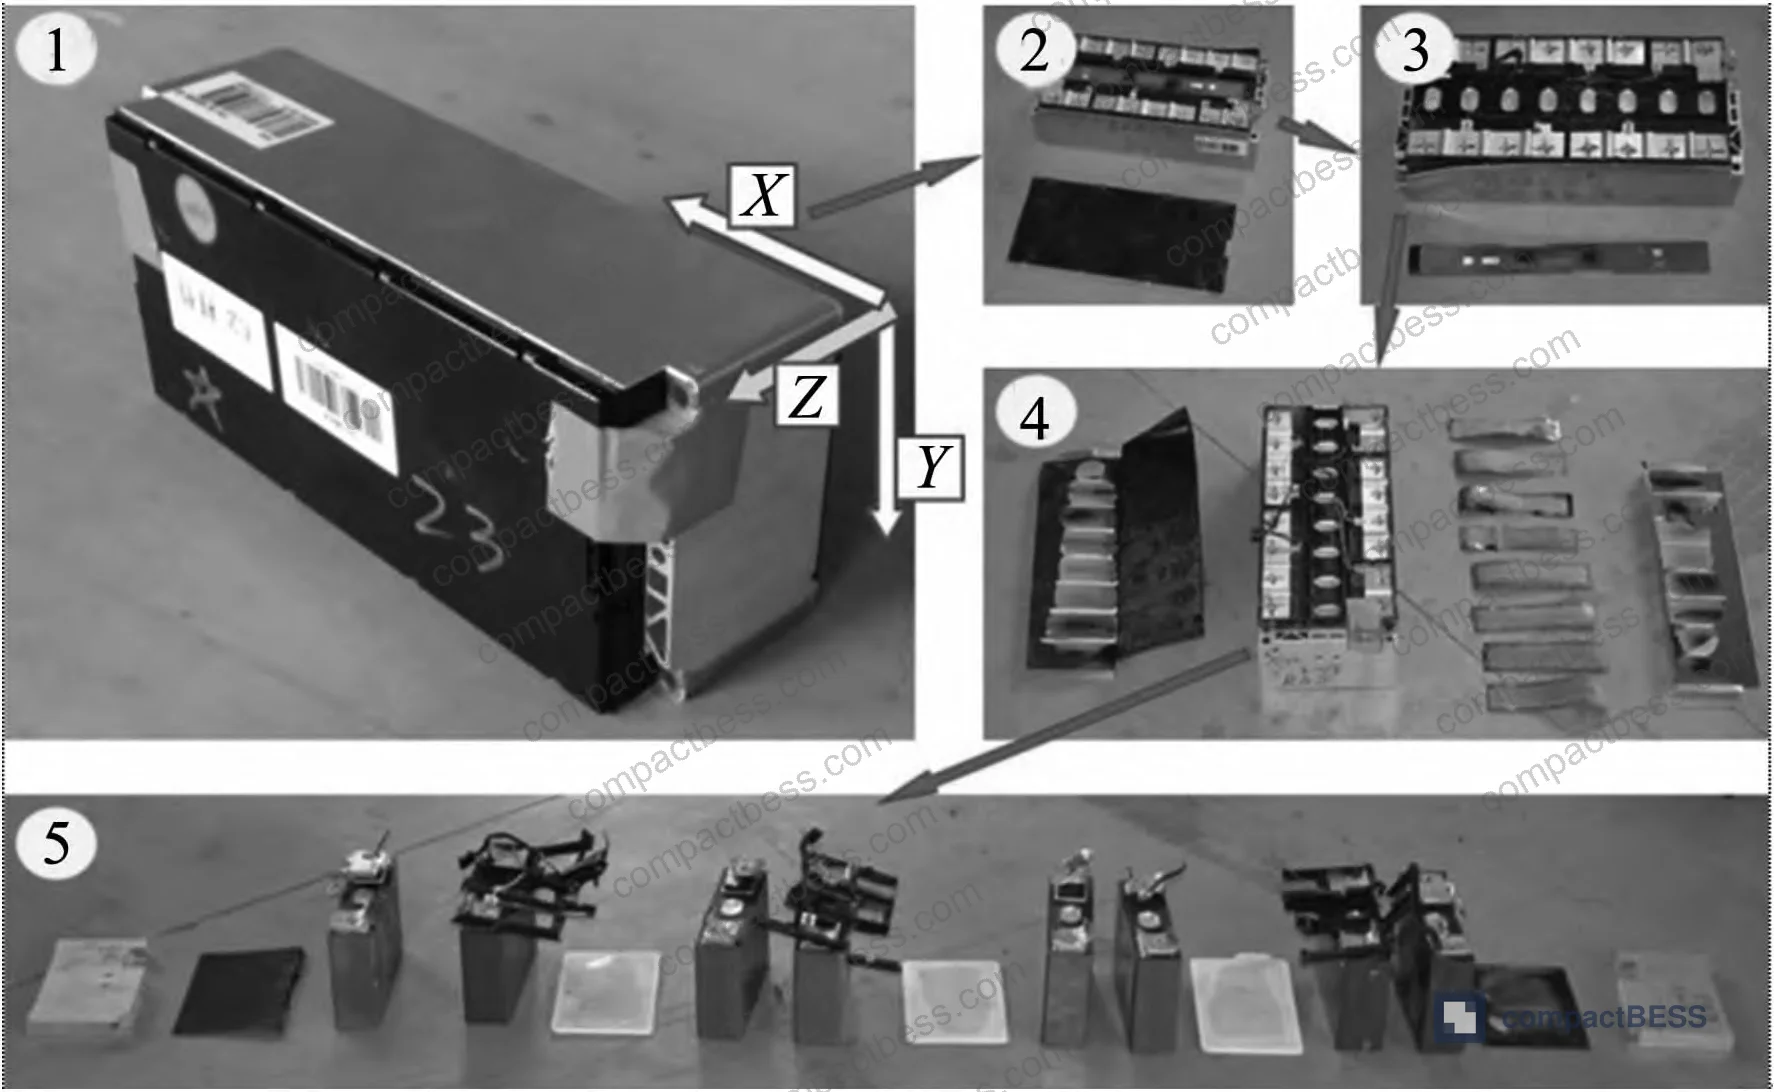
Directional Impact Behavior and Internal Short Circuit Thresholds #
The most important finding from the full test series is that battery module failure behavior is strongly direction-dependent, and the axis that looks strongest mechanically is not necessarily the safest thermally. Let me walk through what the data actually shows.
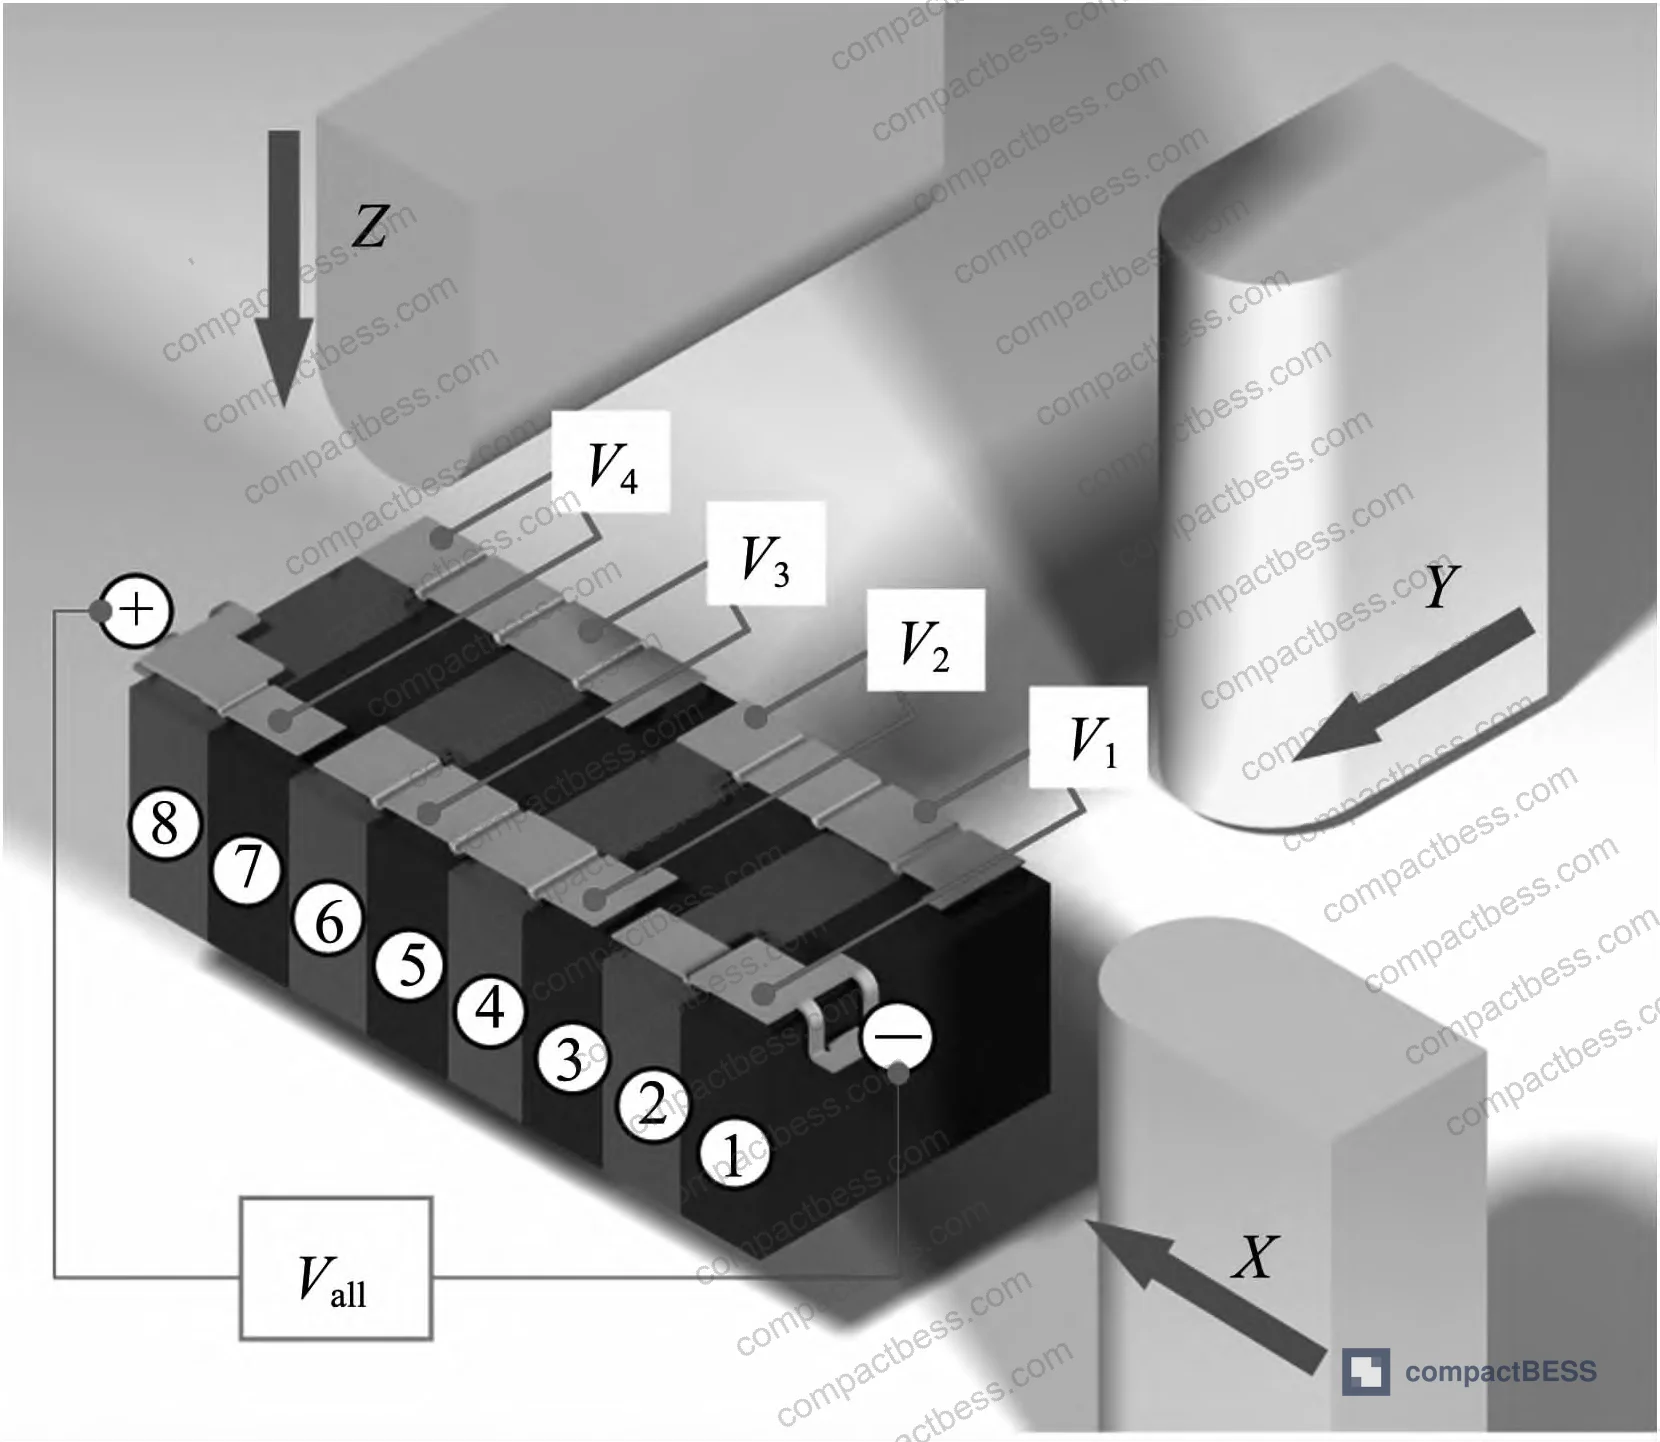
Low-speed quasi-static loading (9 mm/min):
Under slow frontal (X-direction) compression, module voltage drops from 10 V to 7.5 V as the first cell (cell #1) reaches internal short circuit. The intrusion displacement at that failure point is 41.666 mm, with a corresponding load of 43.980 kN. In the Y direction (lateral), failure develops more gradually — the voltage signal steps down incrementally, with cell #3 shorting at 41.163 mm intrusion, then total voltage collapsing to zero by 64.916 mm. The Z direction (vertical) shows the weakest resistance: failure occurs at 23.079 mm intrusion with only 11.657 kN load, the lowest of any configuration tested.
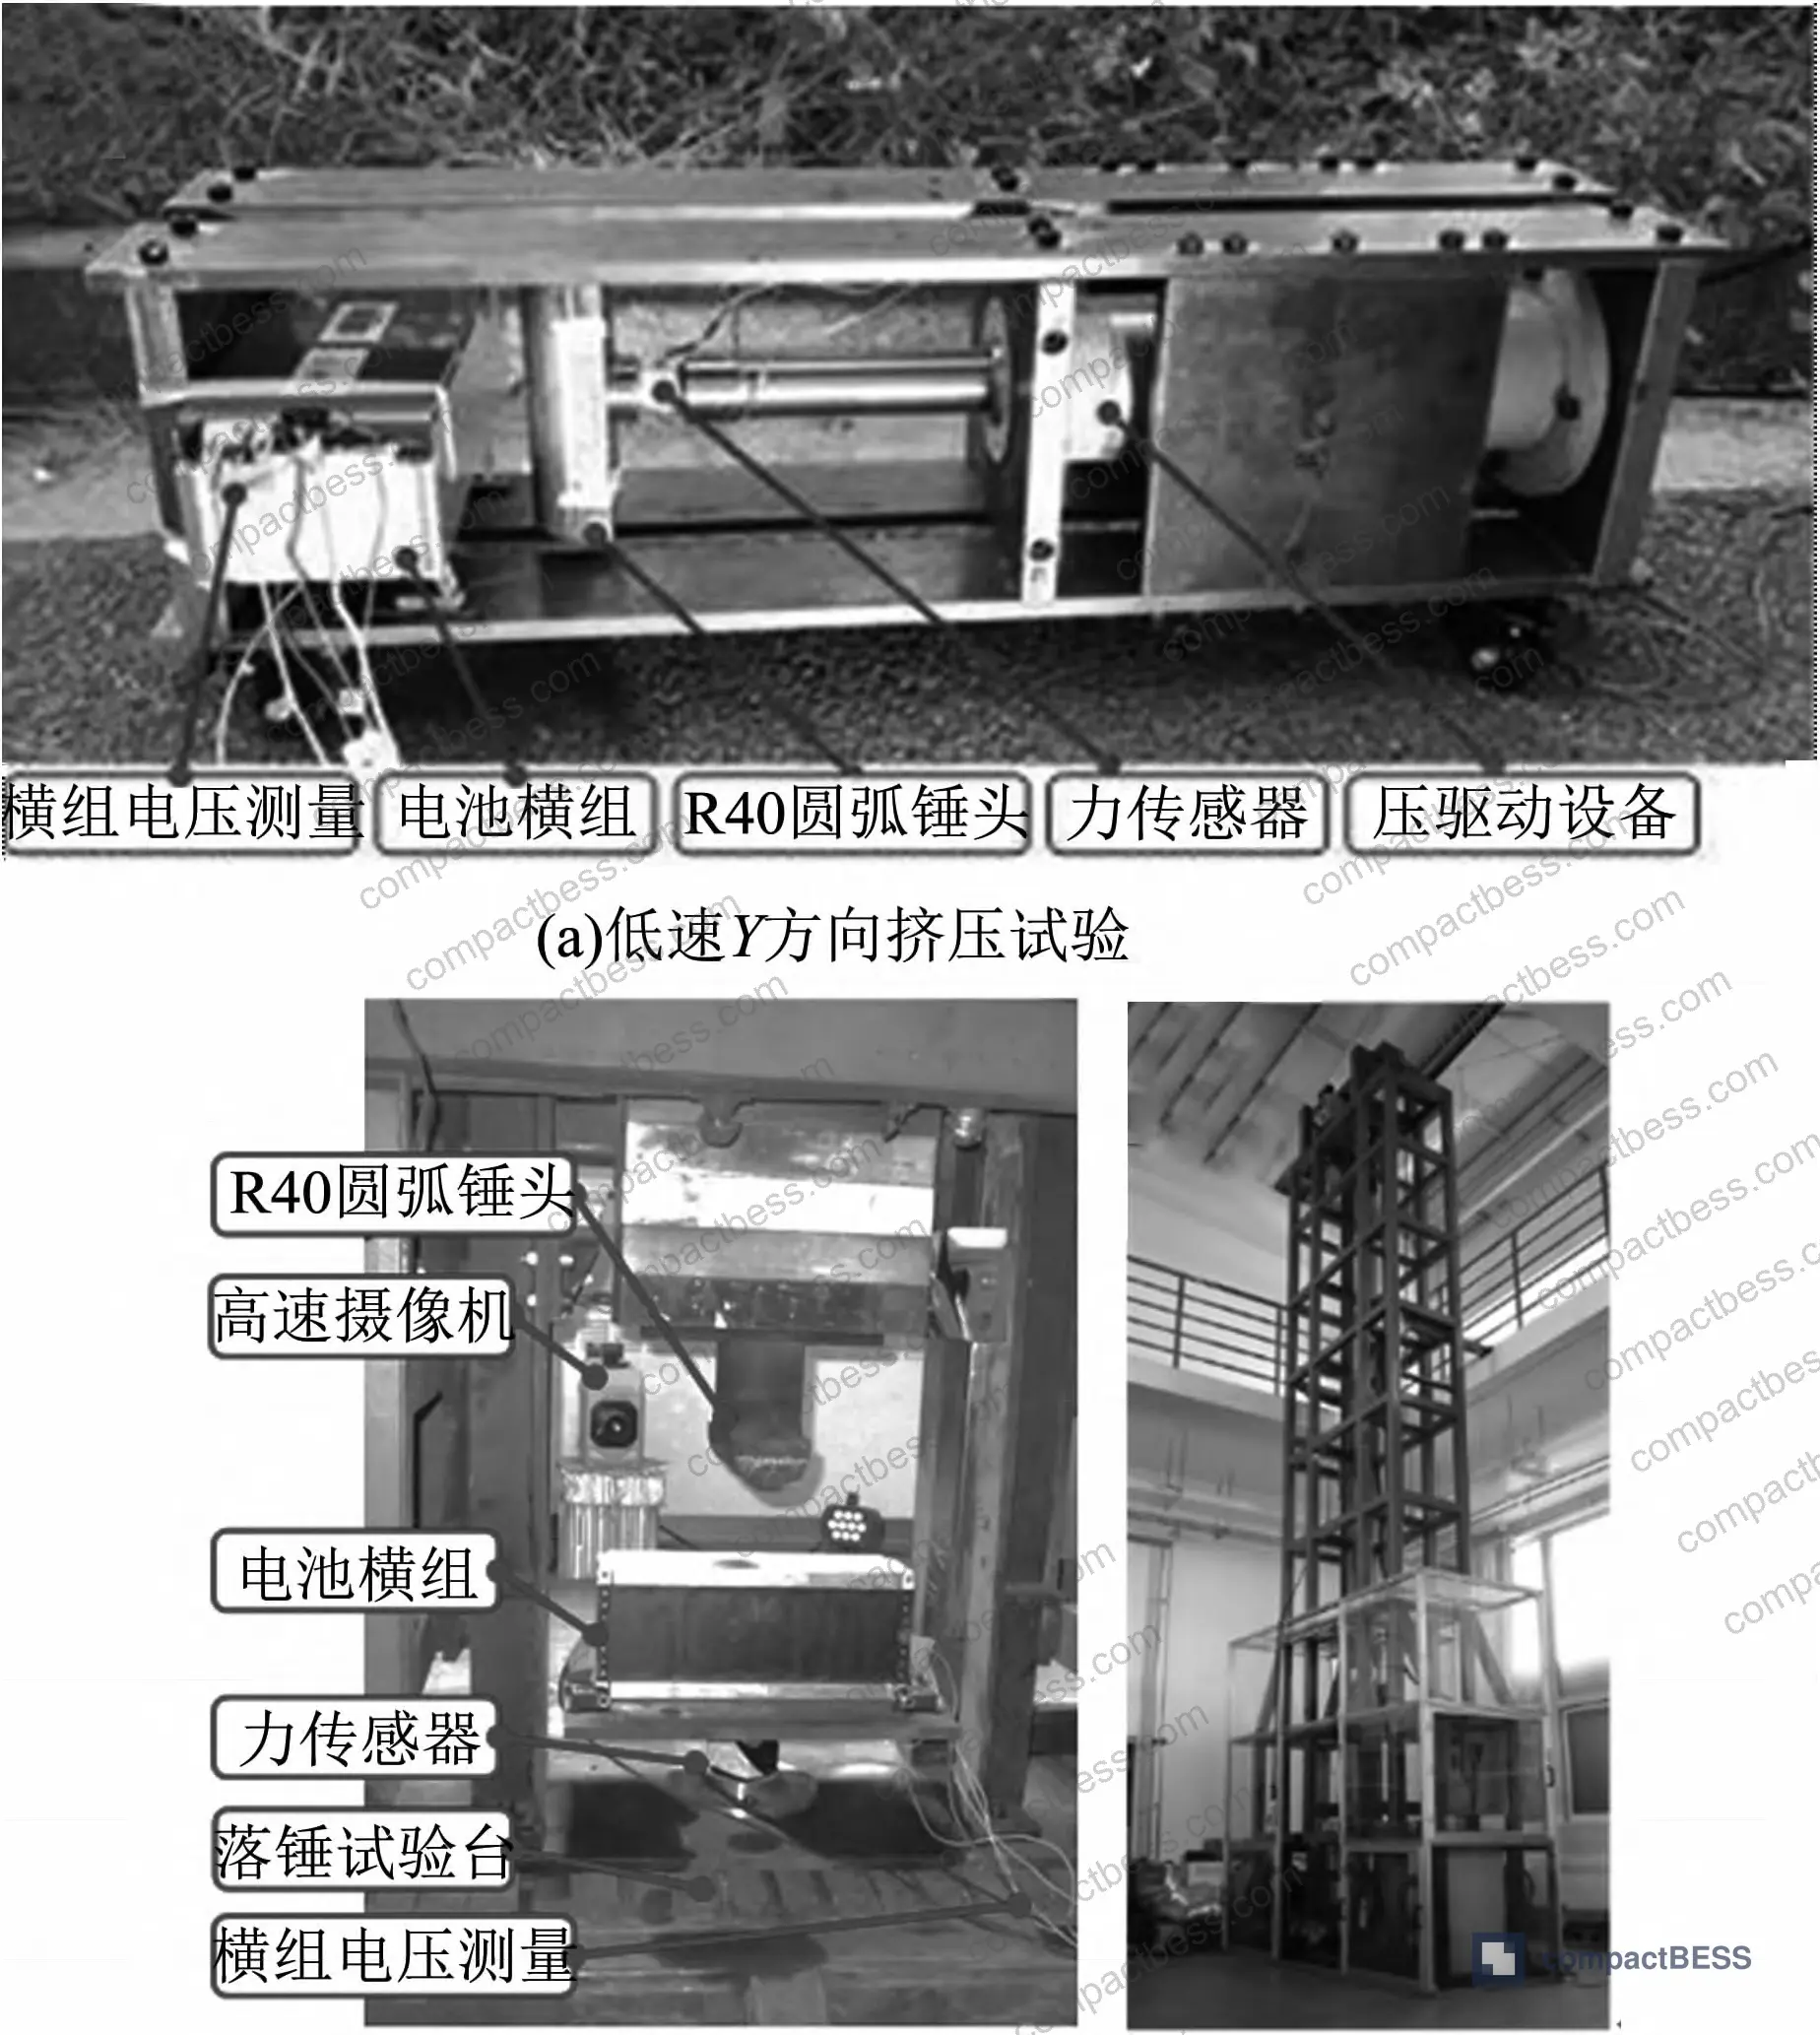
High-speed impact loading (200 kg hammer at 7 m/s):
This is where the data gets uncomfortable for anyone relying solely on standard test compliance. Under high-speed frontal (X) impact, internal short circuit occurs at only 29.715 mm intrusion — a 29% drop compared to quasi-static loading — while the peak load at failure jumps to 173.700 kN. The Y direction shows the most dramatic intrusion tolerance collapse: failure occurs at just 12.345 mm of penetration, down from 41.163 mm under quasi-static conditions. The Z direction peak load at failure under high-speed conditions is only 7.530 kN, the weakest load-bearing response across all configurations.
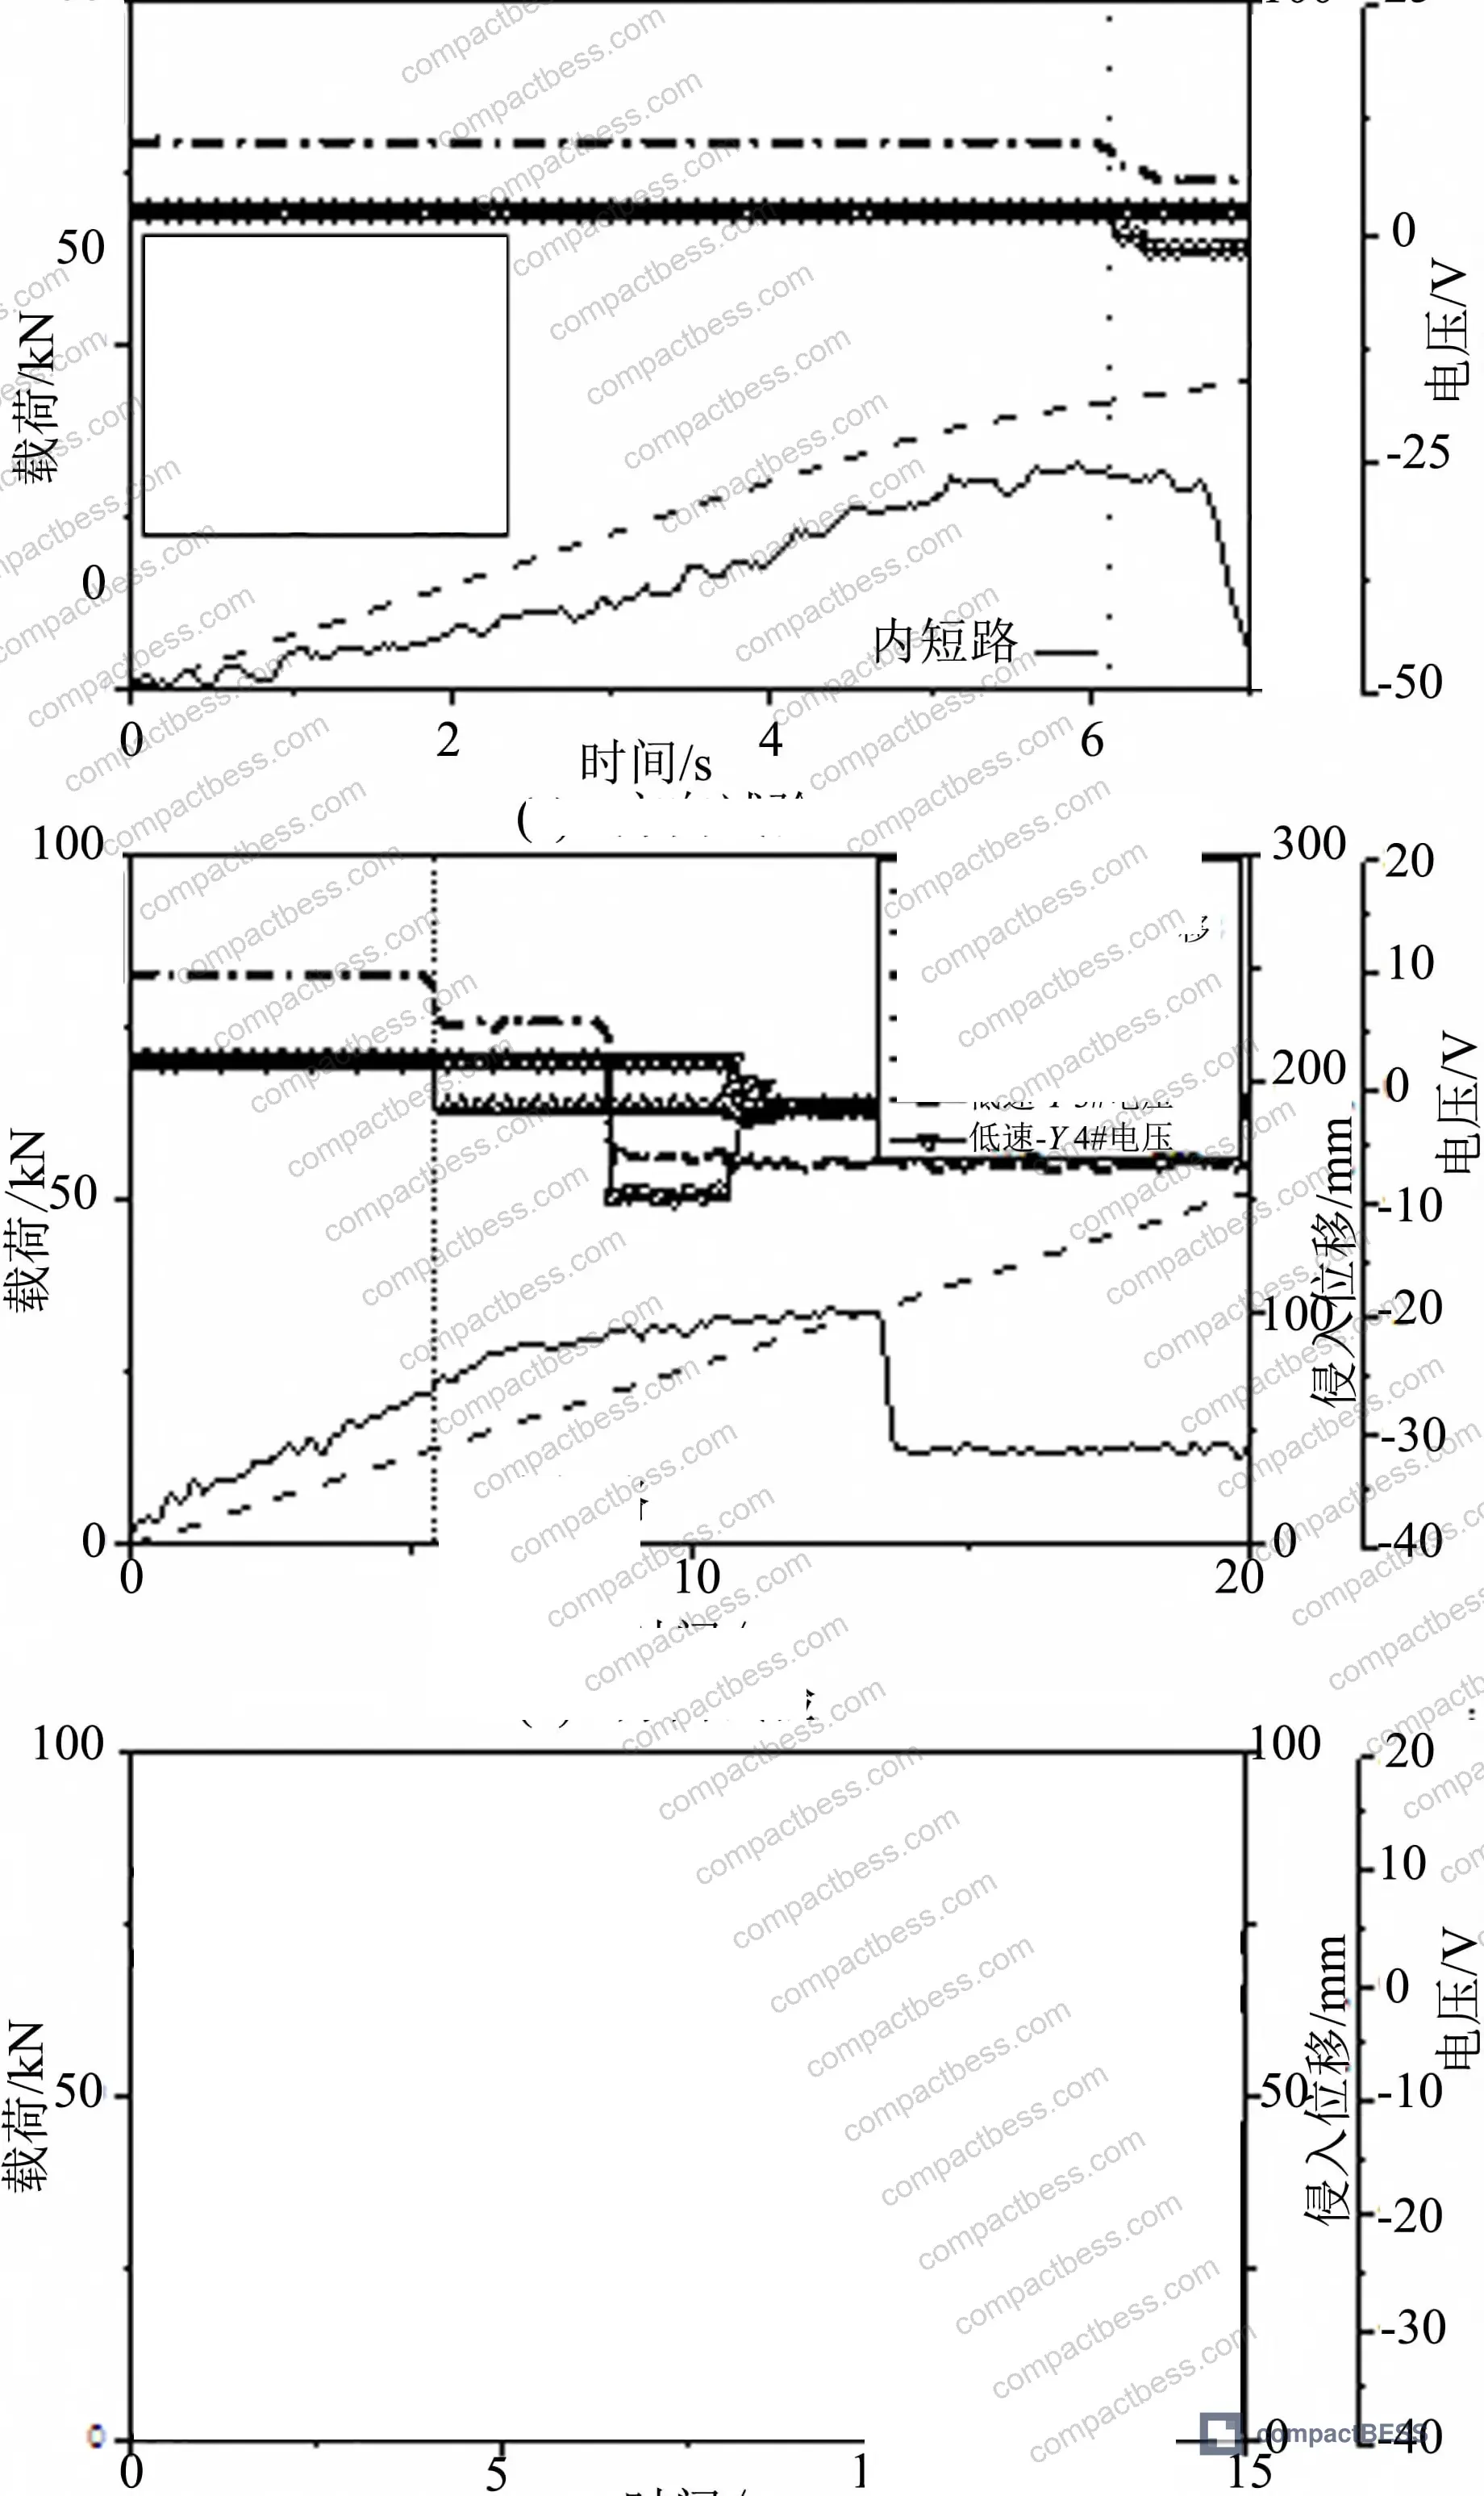
Comparison across directions and loading speeds:
| Loading Condition | Axis | Intrusion at Short Circuit (mm) | Load at Failure (kN) |
|---|---|---|---|
| Low speed (9 mm/min) | X | 41.666 | 43.980 |
| High speed (7 m/s) | X | 29.715 | 173.700 |
| Low speed (9 mm/min) | Y | 41.163 | 31.950 |
| High speed (7 m/s) | Y | 12.345 | 65.520 |
| Low speed (9 mm/min) | Z | 23.079 | 11.657 |
| High speed (7 m/s) | Z | — | 7.530 |
The directional pattern holds across both speed regimes: X-axis loading produces the highest energy absorption before failure, while Z-axis loading is consistently the weakest. That said, the X direction carries a specific thermal risk that the load data alone doesn’t reveal.

SOC, Thermal Runaway Severity, and the Combustion Risk You Can’t See in a Load Cell #
Here’s where the structural test data intersects with actual fire hazard, and where most procurement conversations fall short.
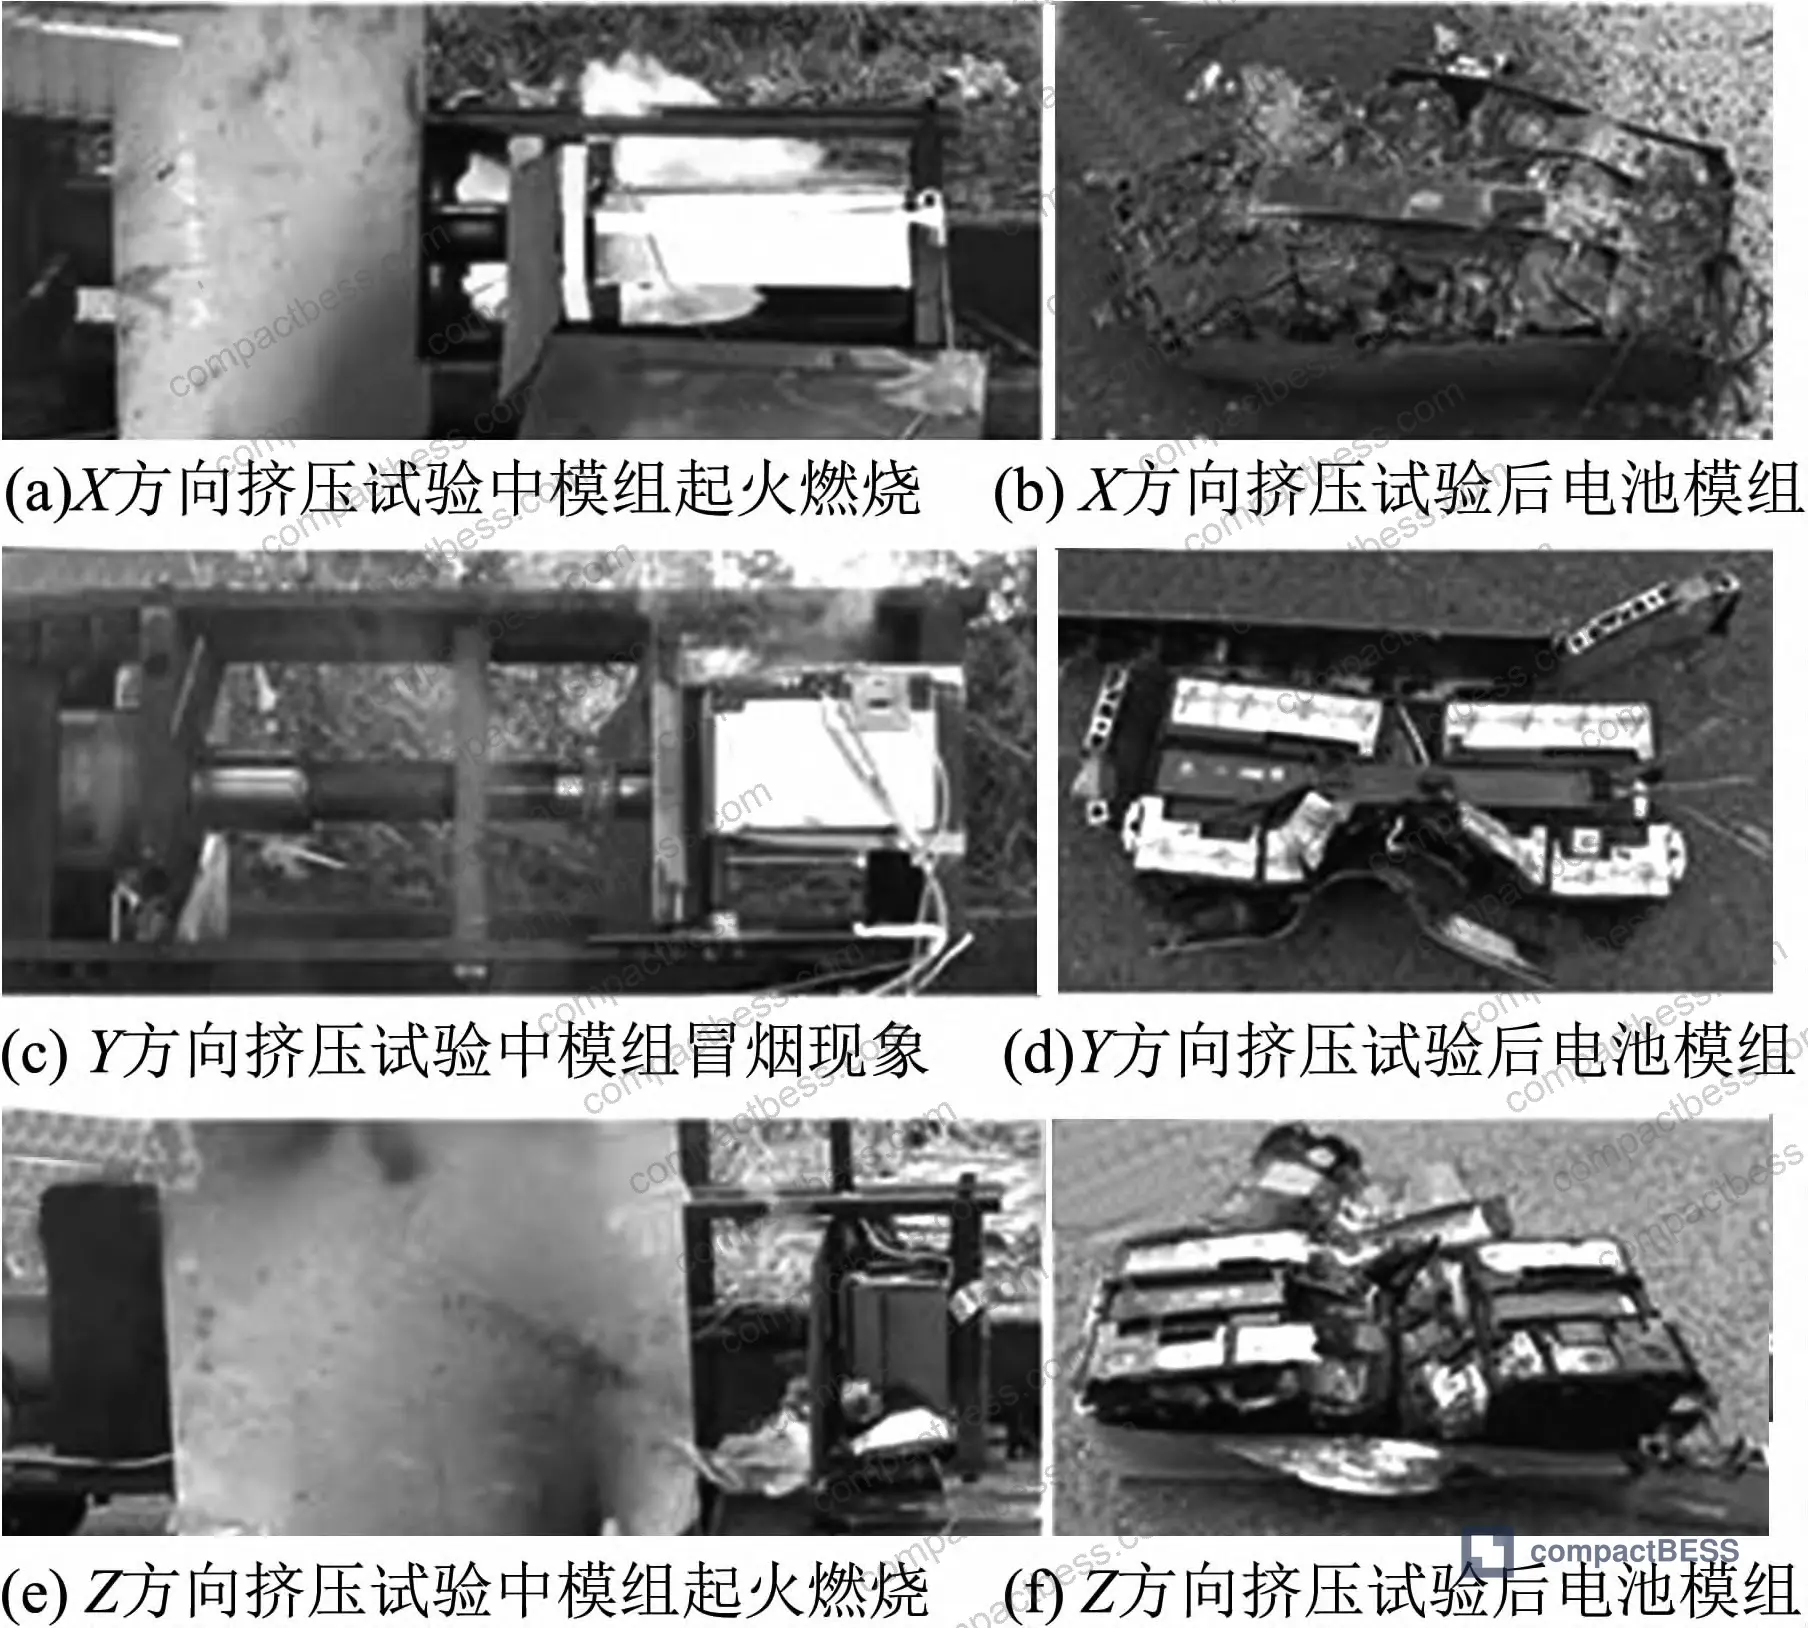
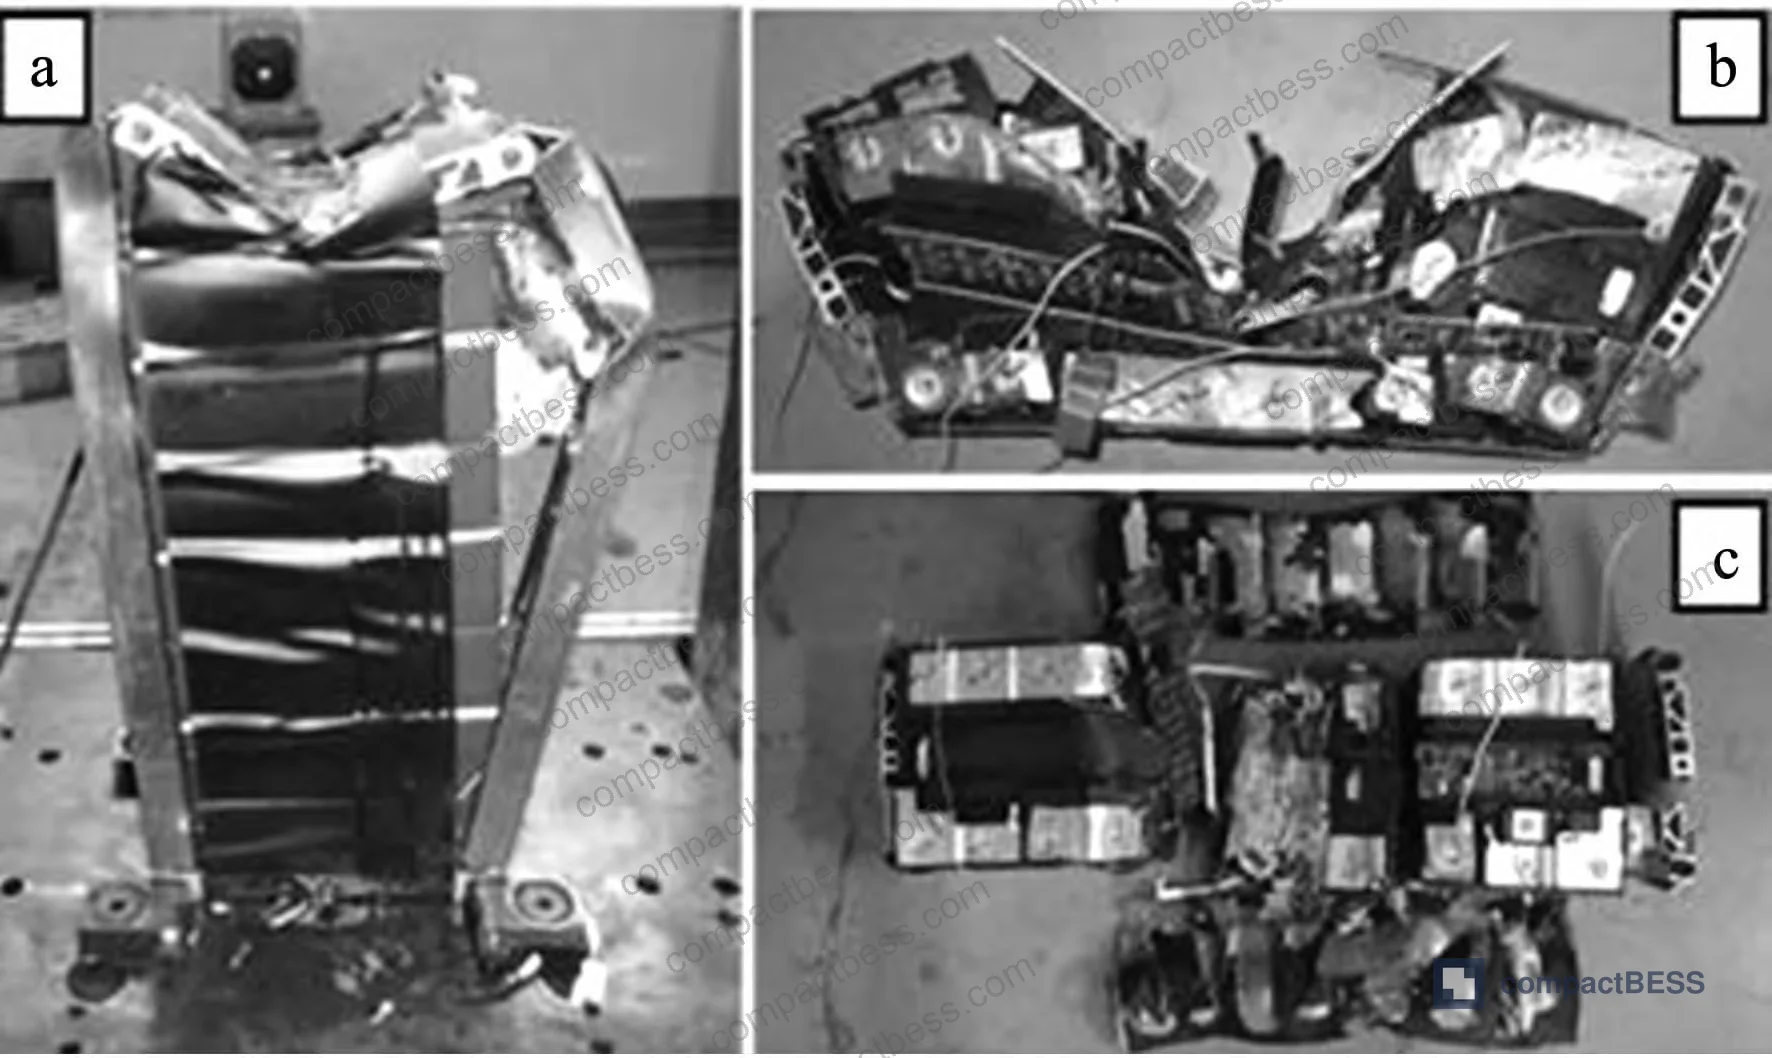
In every quasi-static test — X, Y, and Z directions — internal short circuits triggered thermal runaway. The X-direction tests produced the most severe combustion: all cells in the module participated in the burn. The Y and Z direction tests produced smoke and smaller fires, a result of the hammer effectively splitting the module along its midplane, which facilitated heat dissipation to the surroundings rather than concentrating it.
The high-speed impact tests used low-SOC modules specifically because the engineering team needed to control the experiment — but this also illustrates the real-world risk: in those high-speed tests, all three directions showed sustained smoke generation but no ignition. The reduced energy stored in low-SOC cells was insufficient to sustain combustion after the internal short. Flip that scenario to a high-SOC pack during a collision and the outcome changes significantly.
This SOC-combustion dependency is not a theoretical extrapolation. In supplier qualification testing we’ve reviewed, the failure pattern is consistent: higher state of charge correlates directly with more severe post-short-circuit fire, regardless of loading direction. High-SOC modules are more likely to ignite after thermal runaway than low-SOC modules under identical mechanical abuse conditions.
Honestly, most buyers over-specify structural crush resistance and under-specify thermal management requirements. A module that can absorb 173.700 kN in a frontal impact but has no mechanism to interrupt the thermal cascade after internal short circuit is still a fire waiting to happen. The cycle life and degradation of cells at high SOC under repeated mechanical stress compounds this risk in field-deployed packs.
Most procurement teams don’t realize that safety standards like IEC 62619:2022 — the primary international safety benchmark for secondary lithium cells and batteries used in industrial applications — include mechanical abuse requirements, but those tests are defined at quasi-static rates. The gap between standard test conditions and real crash dynamics is exactly what the data above quantifies. A module that passes IEC 62619 crush testing may still fail at the much lower intrusion thresholds measured under dynamic loading.
The thermal runaway propagation risk in high-speed X-direction impacts is specifically tied to module geometry: when cells are stacked in aligned rows, heat generated by the initially shorting cell transfers efficiently to adjacent cells through the contact surfaces. Y and Z direction impacts physically separate the cell stack, creating structural gaps that interrupt that heat transfer pathway. This is a geometry-driven safety mechanism, and it needs to be part of your supplier qualification conversation.
For systems where UL 9540A Test Method for Evaluating Thermal Runaway Fire Propagation compliance is relevant — particularly for stationary energy storage deployments — the propagation behavior observed in X-direction loading directly informs how a module would perform in an inter-cell thermal runaway cascade scenario.
Loading Rate Effects on Damage Tolerance: What Standard Compliance Doesn’t Tell You #
The core structural finding deserves its own treatment because it has direct implications for how you interpret supplier test documentation.
As loading rate increases from 9 mm/min to 7 m/s, the intrusion displacement at which internal short circuit occurs decreases substantially across all three axes. In the X direction, that’s a 29% reduction. In the Y direction, it’s a 70% reduction — from 41.163 mm down to 12.345 mm. The module that looks robust in a static press test becomes vulnerable at collision speeds.
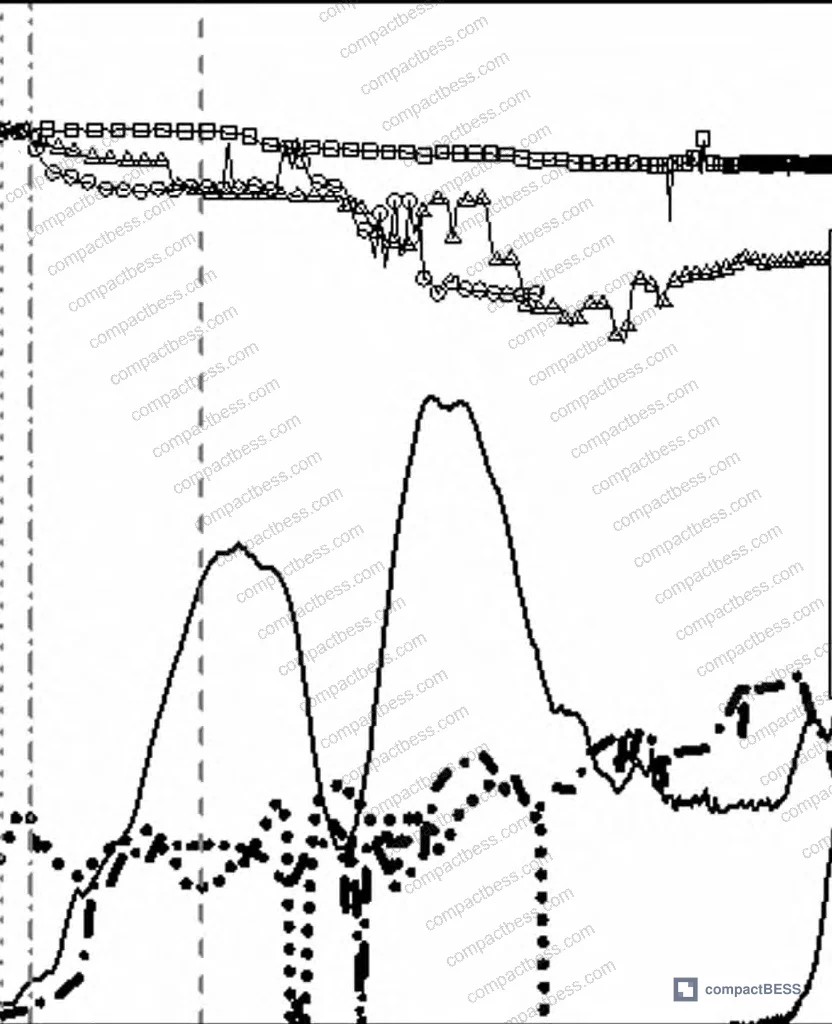
At the same time, the peak load at failure increases with loading rate. This is consistent with the rate-dependent mechanical behavior of the aluminum alloy housing and the internal cell stack materials — they stiffen under rapid deformation. But that higher load doesn’t protect you; it means the force required to reach the (now lower) failure threshold is higher, but the module still fails sooner in displacement terms. In a real crash scenario, intrusion depth is what determines whether the cells deform enough to short circuit.

The practical implication: a supplier who shows you quasi-static crush test data and quotes an intrusion tolerance of 41 mm is not telling you the full story. Under collision-speed loading, that tolerance may be closer to 12–30 mm depending on loading axis.
Emerging research in this area consistently confirms that the relationship between loading rate and damage tolerance is non-linear and direction-dependent. Buyers sourcing modules for applications involving any dynamic loading — vehicle integration, marine deployments, industrial mobile equipment — should treat quasi-static test data as a minimum baseline, not an adequate safety specification.
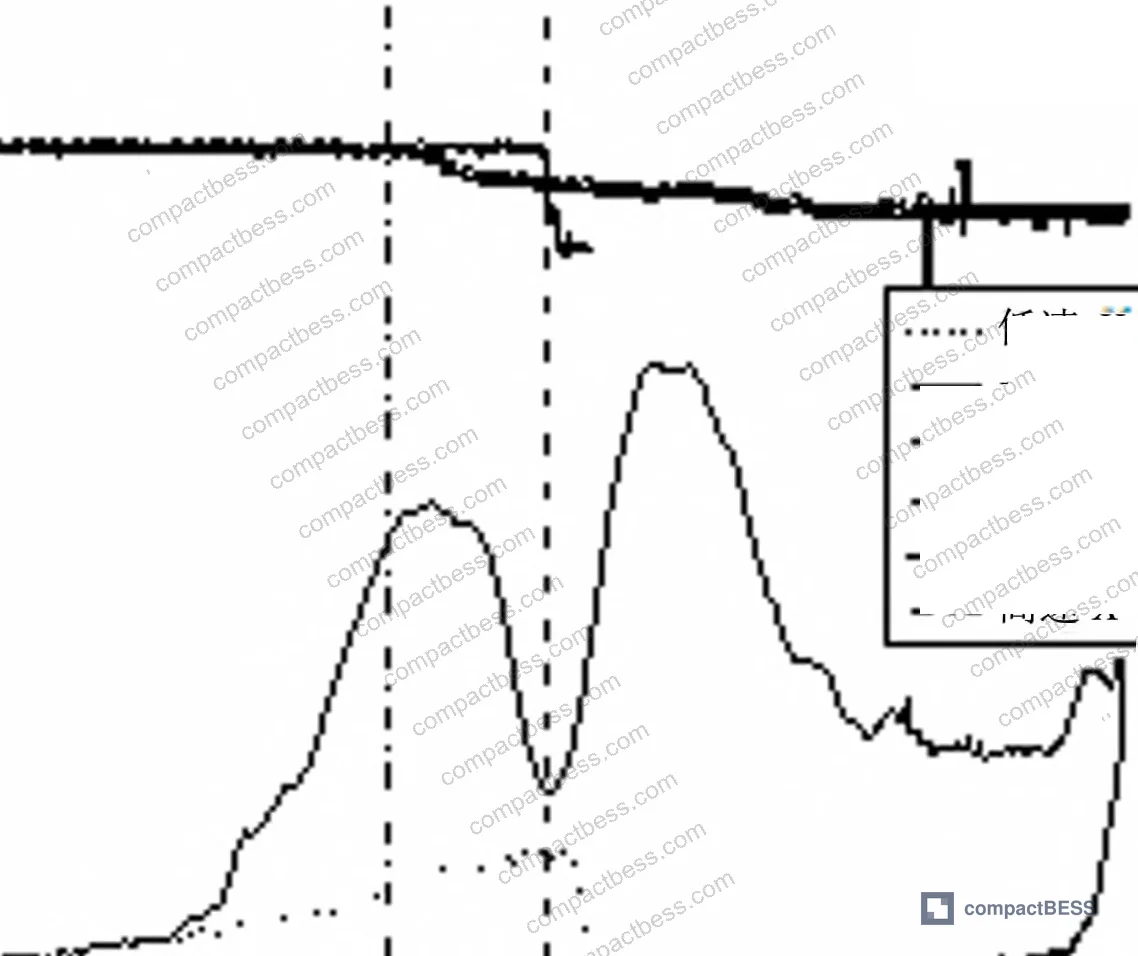
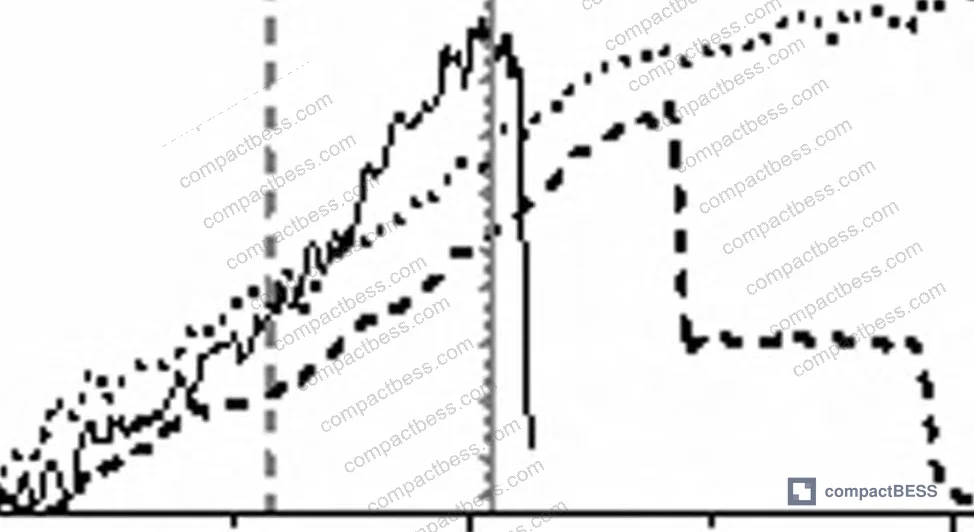
The aluminum alloy frame behavior follows a predictable pattern in both speed regimes: initial loading is carried primarily by the outer frame, producing a rising load curve until the frame yields. After frame failure, load redistributes to the individual cell casings as primary load-bearing elements, producing a secondary peak. Once cells are extruded from the aluminum casing — as documented in the X-direction high-speed test — the load curve drops off. That two-peak behavior in the load-displacement curve is a diagnostic signature that a technically competent supplier should be able to identify and explain in their own test data.
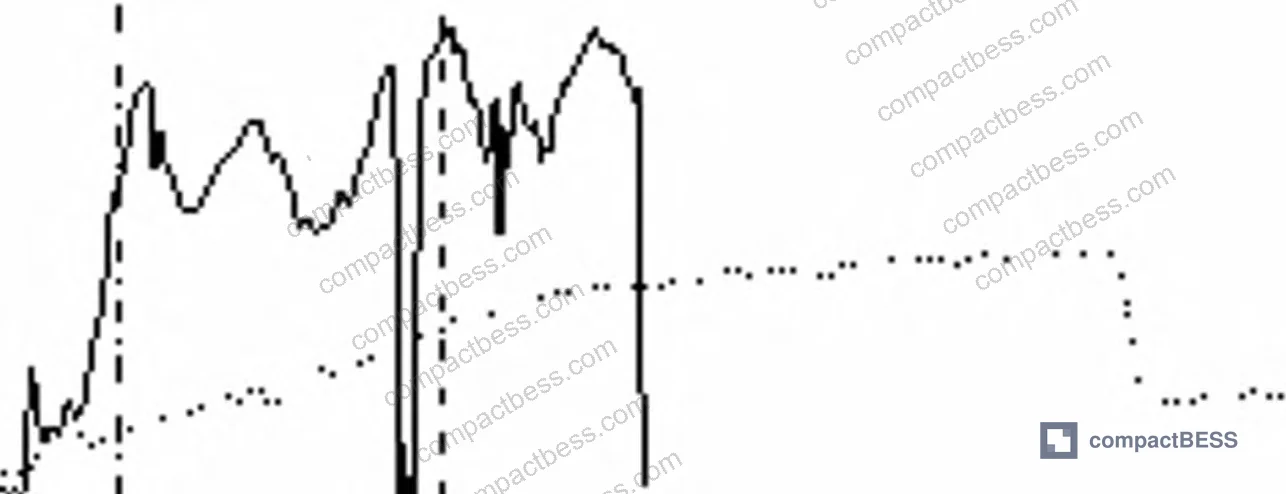
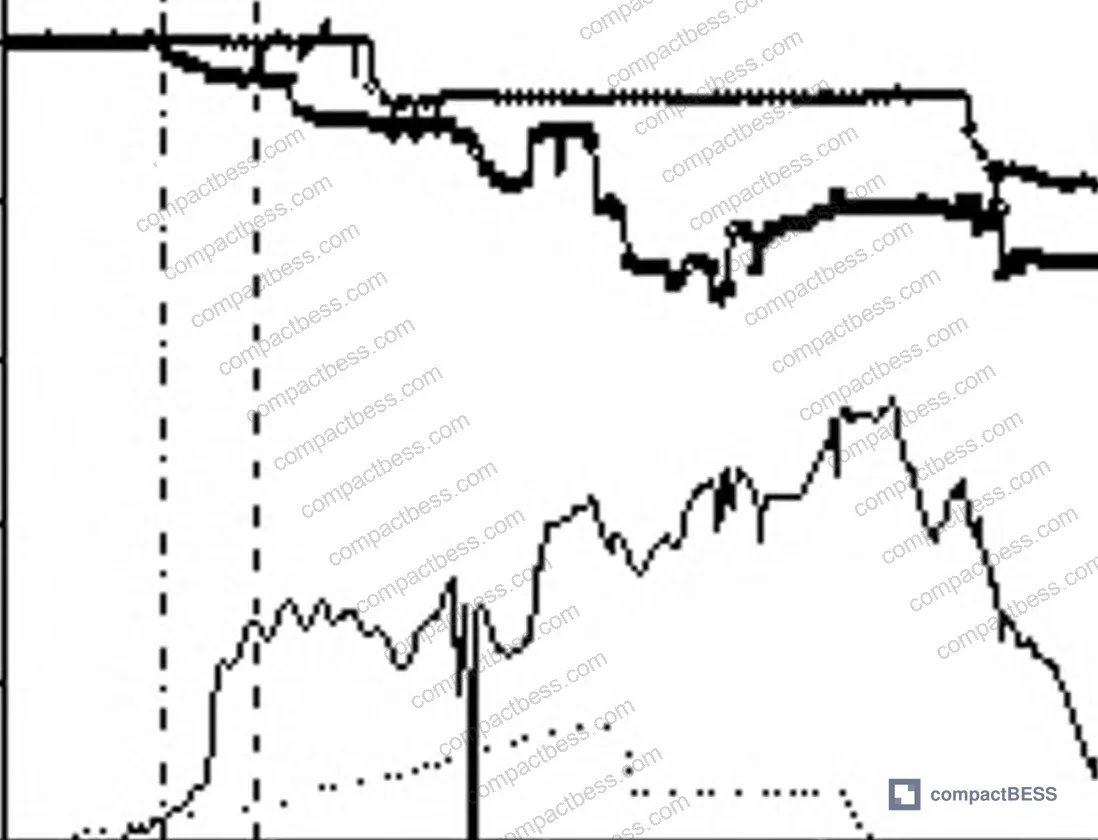
Compliance with UN 38.3 transport testing covers shock and vibration for shipping conditions, but the impact energies involved in vehicle collision scenarios are orders of magnitude higher. Don’t conflate transport certification with crash safety performance.
Practical Guidance for Buyers #
If you’re sourcing lithium-ion battery modules for applications where mechanical abuse is a credible risk — EVs, e-mobility, industrial vehicles, marine, or even portable power stations subject to drop loads — the dataset presented here should change how you qualify suppliers.
First, request dynamic impact test data alongside quasi-static crush data. The two tell different stories. A module with a 41 mm quasi-static intrusion tolerance may fail at 12 mm under collision-speed loading in the Y direction. That’s a safety margin of nearly zero in a real-world side-impact scenario.
Second, ask specifically about loading direction. X-direction frontal impact produces the strongest structural resistance but the worst thermal runaway outcome due to aligned cell stacking geometry. Y and Z impacts are mechanically weaker but thermally more self-limiting. Your supplier needs to understand this tradeoff and be able to explain how their enclosure design addresses it.
Third, don’t ignore SOC at the time of mechanical abuse testing. High-SOC modules are more likely to ignite after internal short circuit. If your application keeps modules near full charge under normal operating conditions, your safety margin is lower than a test conducted on low-SOC samples suggests.
At CompactBESS, we work directly with verified Chinese manufacturers of battery modules and pack assemblies, connecting overseas OEM buyers and energy storage integrators with suppliers who can provide the right test documentation — not just static compliance certificates. If you’re evaluating module formats for a new product design or qualifying a new supply chain, our sourcing team can help you identify manufacturers who conduct dynamic impact testing and can provide full mechanical-electrical characterization data.
Need help identifying qualified suppliers for battery module mechanical safety testing? Talk to our sourcing team →
Supplier Qualification Questions #
- Can you provide drop-weight impact test data at ≥7 m/s for your module in all three loading axes (X, Y, Z), and what is the intrusion displacement at internal short circuit onset in each direction?
- In your dynamic impact test results, does the X-direction intrusion tolerance at internal short circuit fall below 30 mm — and if so, what enclosure or frame design modifications have been made to improve that threshold?
- What is the peak load at failure for your module under high-speed Y-direction loading, and can you confirm whether the intrusion-to-short-circuit displacement is greater than 12.345 mm?
- At what SOC level were your mechanical abuse test samples charged, and do you have comparative fire/thermal runaway outcome data between high-SOC (≥80%) and low-SOC (≤30%) test samples under identical crush conditions?
- Does your module exhibit the two-peak load-displacement signature (outer frame yielding followed by cell casing load redistribution) in crush testing, and can you provide the load-displacement curve with the internal short circuit onset point marked?
Sourcing Checklist #
- ☐ Supplier provides dynamic impact test data at ≥7 m/s (not only quasi-static at 9 mm/min), covering all three loading axes
- ☐ X-direction intrusion threshold at internal short circuit is documented and exceeds 29.715 mm under high-speed loading
- ☐ Y-direction damage tolerance under high-speed impact is documented with intrusion-to-failure exceeding 12.345 mm
- ☐ Thermal runaway outcome data is provided for high-SOC (≥80% SOC) mechanical abuse tests, not only low-SOC samples
- ☐ Module-level voltage monitoring data (individual cell channels) is included in crush test reports to confirm short circuit onset identification method (≥10% voltage drop criterion)
- ☐ Enclosure material is specified as aluminum alloy frame with buffering/protective inter-cell layer, consistent with test configuration
- ☐ Module meets IEC 62619:2022 mechanical abuse requirements, with test report available and test rate conditions documented
- ☐ Supplier can explain directional asymmetry in mechanical performance (X vs Y vs Z) and how pack orientation in the final application has been optimized accordingly
Key Specifications Table #
| Parameter | Recommended Value | Verification Method |
|---|---|---|
| X-direction quasi-static intrusion tolerance (short circuit onset) | ≥41.666 mm | Hydraulic press at 9 mm/min with real-time cell voltage monitoring; ≥10% voltage drop as failure criterion |
| X-direction high-speed impact intrusion tolerance | ≥29.715 mm at 7 m/s | Drop-weight test, 200 kg hammer, with non-contact displacement measurement and simultaneous voltage logging |
| Y-direction high-speed intrusion tolerance | ≥12.345 mm at 7 m/s | Drop-weight test with individual cell voltage channels; Z-direction verified separately |
| Module peak load at high-speed X-direction failure | ≥173.700 kN | Load cell on impactor support plate; Wheatstone bridge strain gauge configuration |
| Z-direction low-speed intrusion tolerance | ≥23.079 mm | Quasi-static hydraulic press; failure confirmed by ≥10% total voltage drop |
| Module nominal voltage / capacity | 10 V / 6 Ah (2P4S, 8-cell) | Module-level OCV measurement before and after test; compare to rated 2.5 V per cell × 4S |
| Individual cell rated voltage / capacity | 2.5 V / 1.5 Ah | Cell-level voltage logging during module crush test; four channels minimum |
Can’t find a supplier meeting these specs? Submit your requirements and we’ll match you within 48 hours.
References #
Data source: Crash-Induced Failure Behavior of Lithium-Ion Battery Modules Under Multi-Directional Dynamic and Quasi-Static Loading, A. Qian et al., Journal of the Electrochemical Society, 2024
Frequently Asked Questions #
Why does internal short circuit occur at a lower intrusion depth under high-speed impact than under slow compression?
At higher loading rates, the materials in the module — particularly the aluminum alloy casing and the separator inside each cell — respond with greater stiffness and store energy differently. The impact energy is delivered so rapidly that the deformation is more localized and the separator is punctured earlier relative to overall intrusion depth. In the Y direction, this effect is especially pronounced: the high-speed failure intrusion drops from 41 mm to just over 12 mm, a 70% reduction.
Does passing a quasi-static crush test mean a battery module is safe in a vehicle collision?
No — and this is one of the most common and costly misunderstandings in battery procurement. Quasi-static tests run at 9 mm/min give you baseline structural data, but collision-speed loading produces internal short circuits at significantly lower intrusion depths. A module that passes static testing may still fail at roughly 30% to 70% less penetration under real crash conditions depending on the loading axis.
Why is X-direction impact the worst for fire severity even though it has the highest structural strength?
When a module is loaded frontally (X direction), the cells are compressed along their stacking axis. All cells remain in close contact throughout the deformation, which means heat generated by the initially shorting cell transfers efficiently to adjacent cells. This produces a cascading thermal runaway where all cells burn. In Y and Z loading, the impact effectively splits the module and creates gaps between cell groups, which interrupts the thermal conduction pathway and results in less severe combustion.
How does SOC affect fire risk after mechanical abuse?
Directly and significantly. High-SOC modules — those near full charge — are substantially more likely to ignite after thermal runaway triggered by internal short circuit. Low-SOC modules under identical mechanical conditions may produce thermal runaway and smoke without sustaining combustion. This means the SOC conditions during any mechanical safety test must be disclosed; a test conducted at low SOC is not representative of a fully charged field unit.
What standard governs mechanical abuse testing for lithium-ion battery modules and is it sufficient?
IEC 62619:2022 covers mechanical integrity requirements for secondary lithium cells and batteries in industrial use, and IEC 61960-3 addresses portable applications. Both include crush test requirements, but these are defined at quasi-static rates. They establish a compliance floor, not a full characterization of dynamic crash behavior. For applications where collision-speed loading is a real operating risk, these standards should be supplemented with dynamic impact testing at representative velocities.
Published by compactbess.com Technical Team | Request a sourcing quote


