

TL;DR #
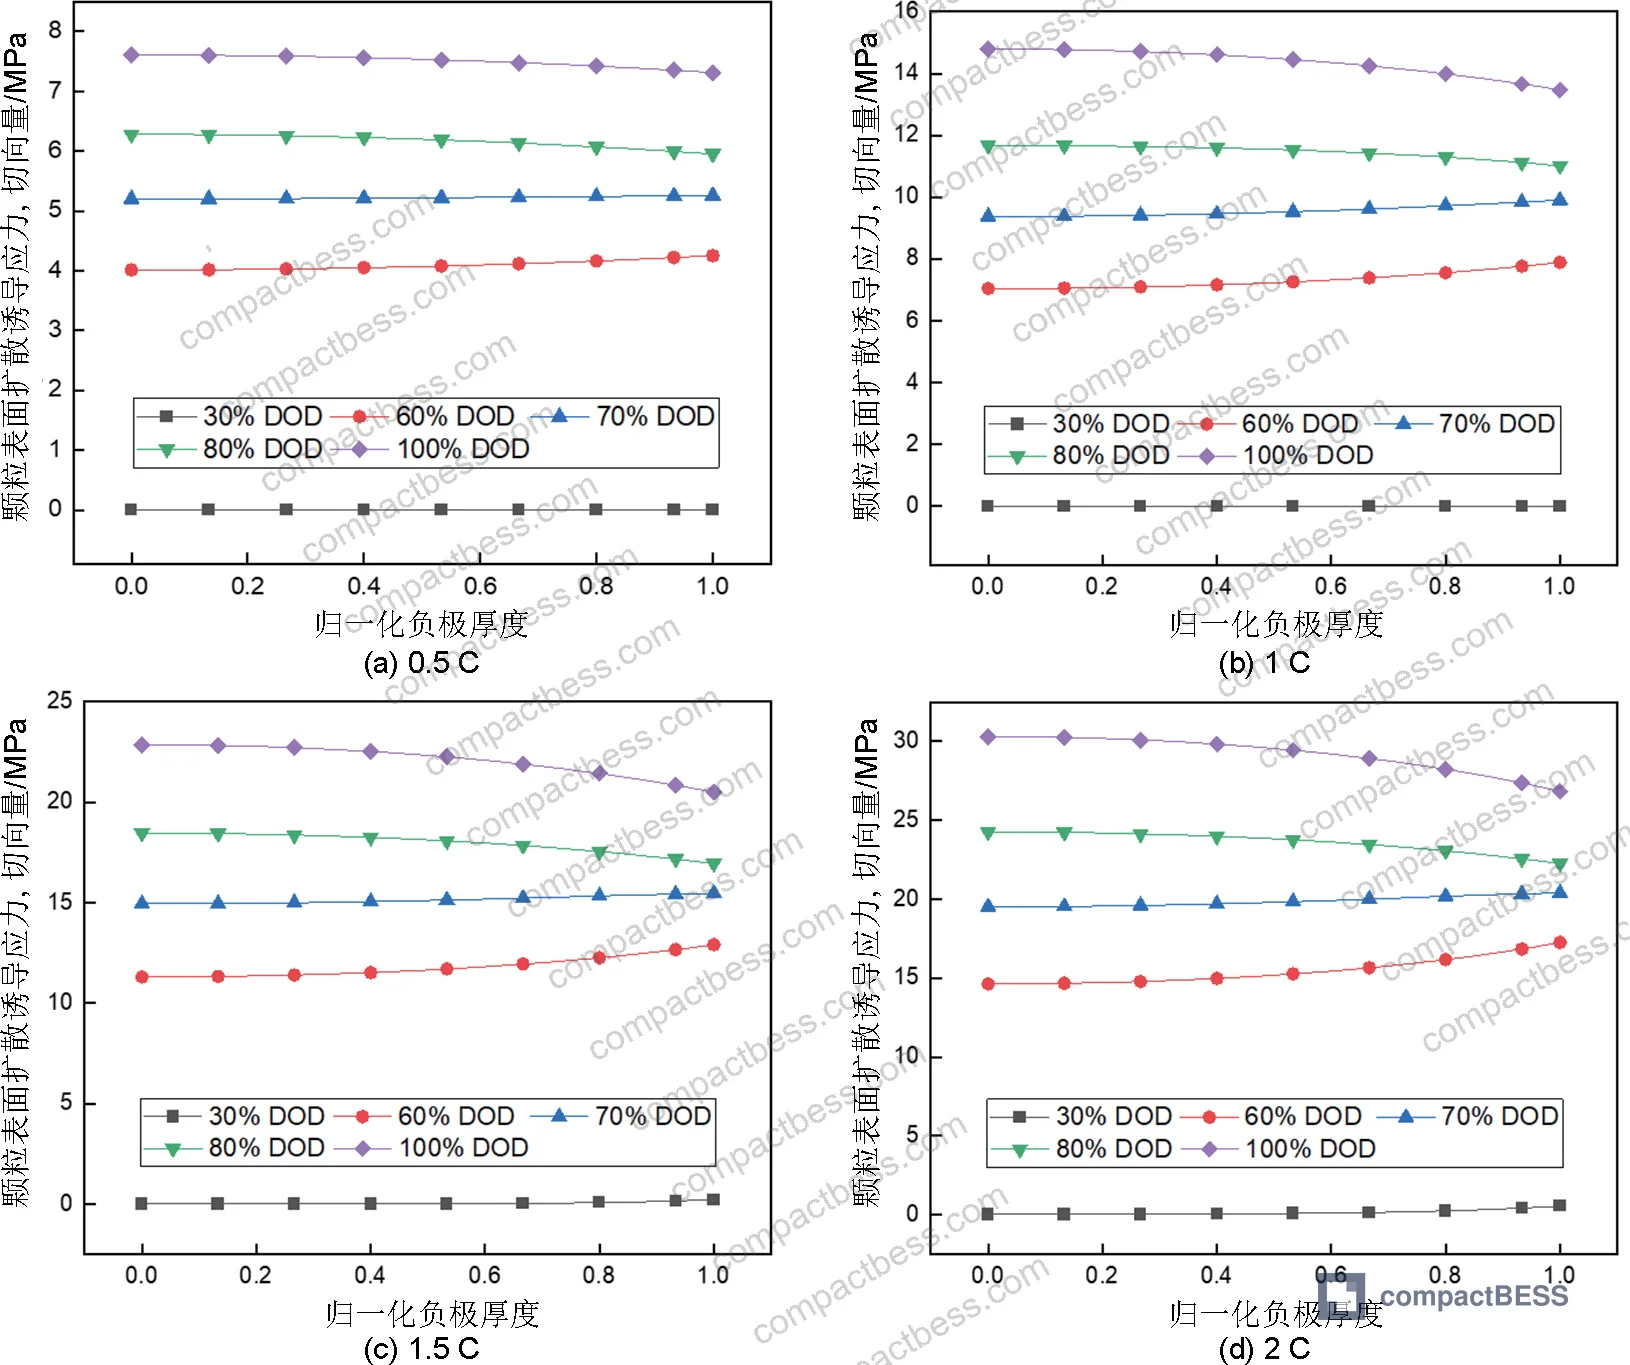
Diffusion-induced stress in the anode particles of a soft-pack NCM111 cell reaches the MPa range — roughly 3,300× greater than the kPa-level thermal stress generated at the cell body level during discharge. For procurement engineers evaluating pouch cell format durability, this means mechanical degradation risk is driven almost entirely by internal particle-level stress, not surface thermal expansion — and your supplier’s stress monitoring strategy should reflect that. Before placing volume orders on 18.5 Ah-class pouch cells, ask for simulation or empirical data on anode particle stress distribution across at least two discharge rates.
Overview #
Pouch cell format selection decisions are too often made on energy density and cost per Wh alone. The structural mechanics of what happens inside those cells during discharge — and how format geometry amplifies or concentrates that stress — rarely enters the conversation at the procurement stage. That’s a mistake that shows up later as premature capacity fade, delamination, and field returns.
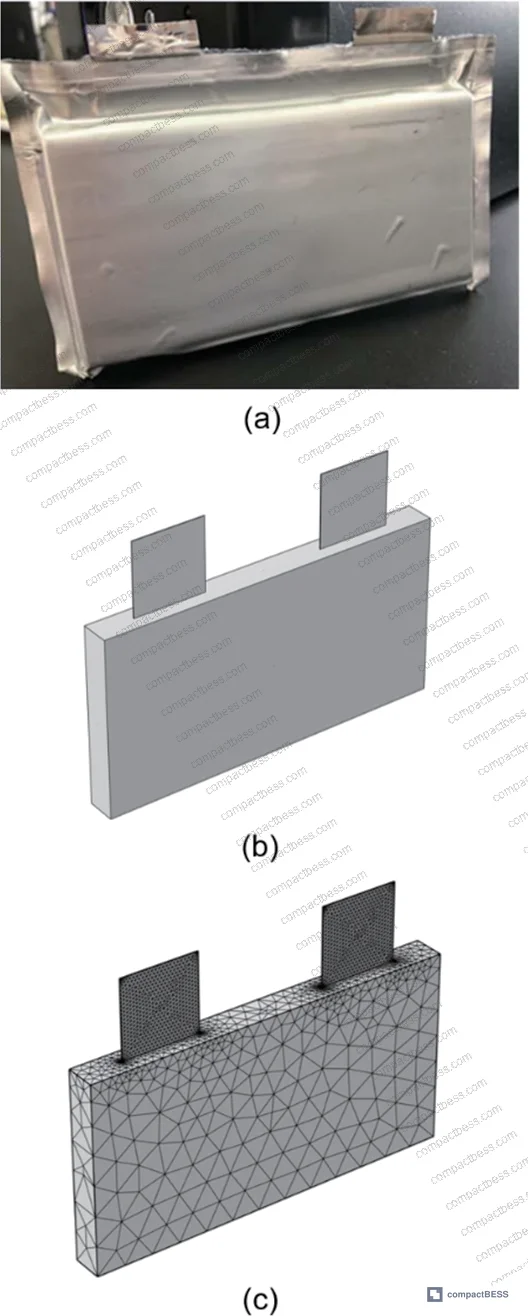
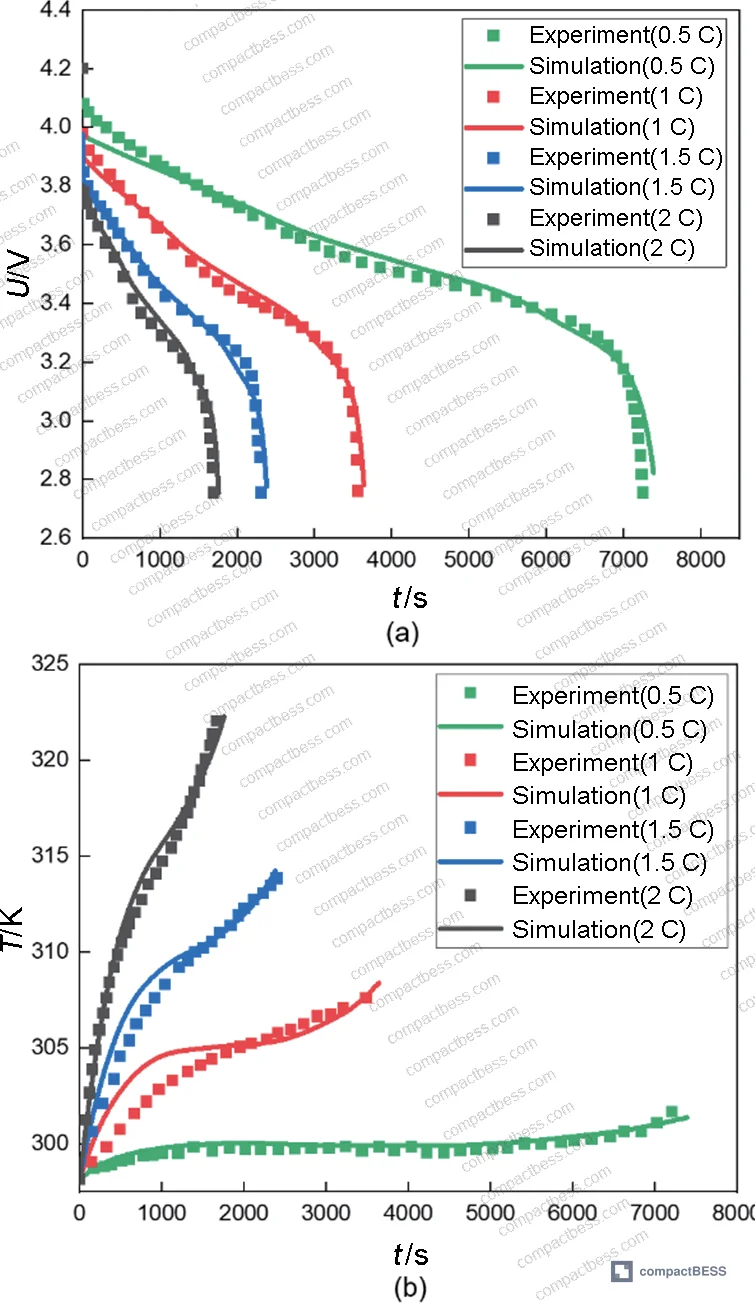
The analysis underpinning this article comes from coupled electrochemical-mechanical-thermal modeling work conducted at a research university with a dedicated industrial energy storage center — using an 18.5 Ah ternary NCM111 soft-pack cell as the test vehicle. The model resolved stress behavior from two distinct origins simultaneously: diffusion-induced stress at the anode particle level (1D electrochemical + particle dimension) and thermal stress at the full cell body level (3D solid mechanics + heat transfer). Discharge rates of 0.5 C, 1 C, 1.5 C, and 2 C were evaluated across the full depth of discharge. What came out of that work has direct implications for how you specify, test, and qualify pouch format cells from Chinese manufacturers.
For a broader foundation on how format geometry affects these mechanical outcomes, see our Cell Formats & Form Factors documentation.
Diffusion-Induced Stress in Soft-Pack Pouch Cells: Particle-Level Mechanics at Different Discharge Rates #
This is where most procurement teams are flying blind. The stress that actually damages anode particles — and drives long-term cycle life degradation — operates at the MPa scale, not the kPa scale you’d measure from thermal expansion instruments on the cell surface.
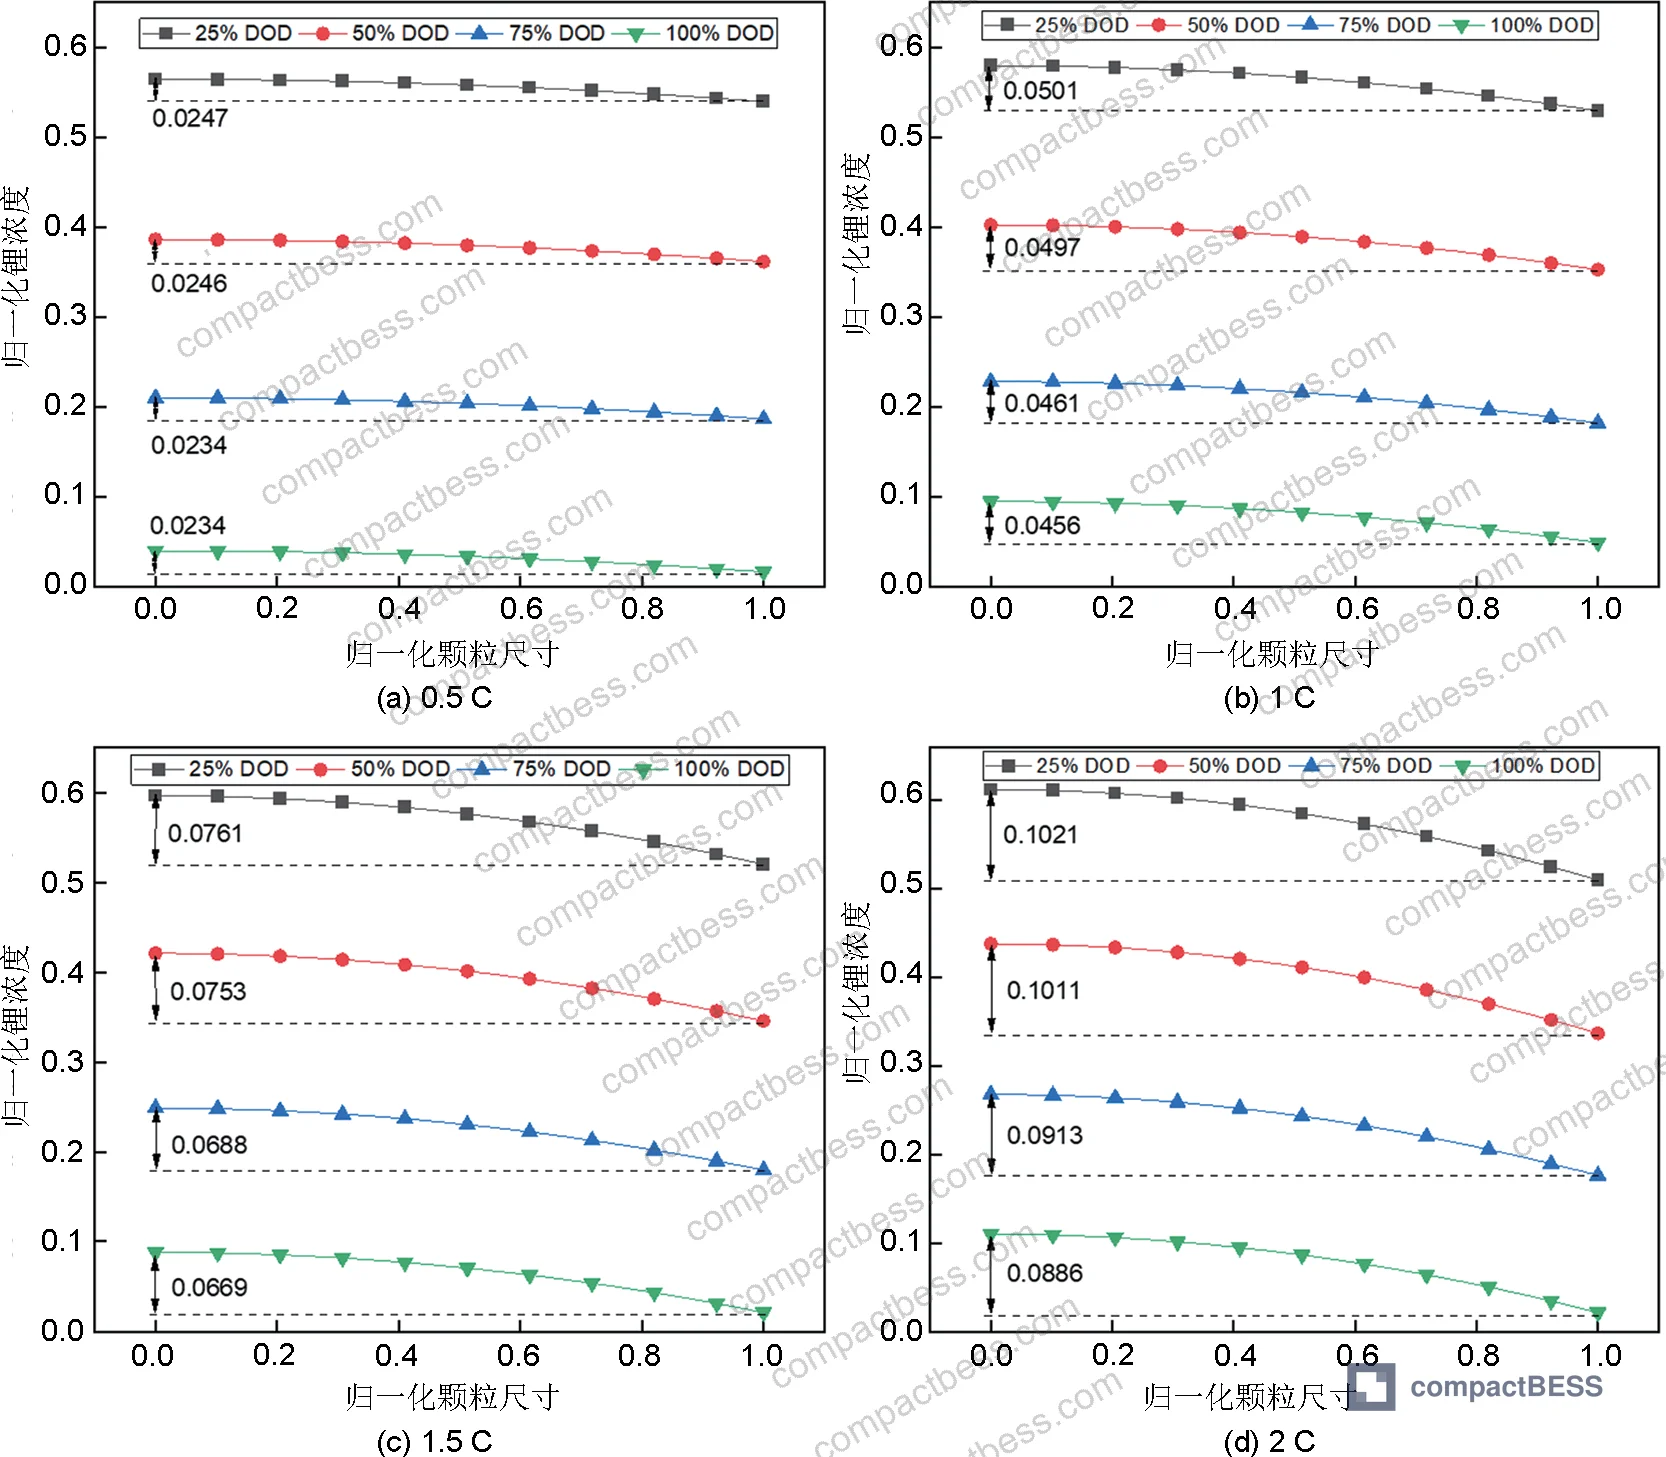
Here’s the mechanics: as lithium ions intercalate and de-intercalate from graphite anode particles during discharge, a concentration gradient builds between the particle center and surface. That gradient is the direct driver of diffusion-induced stress. At 0.5 C discharge completion, the normalized concentration difference between particle center and surface is relatively contained. Push that to 2 C and the gradient — and the resulting stress — increases substantially. At 70% depth of discharge (DOD), the diffusion-induced stress value already reaches approximately 67% of the peak maximum diffusion-induced stress recorded across the full discharge cycle.
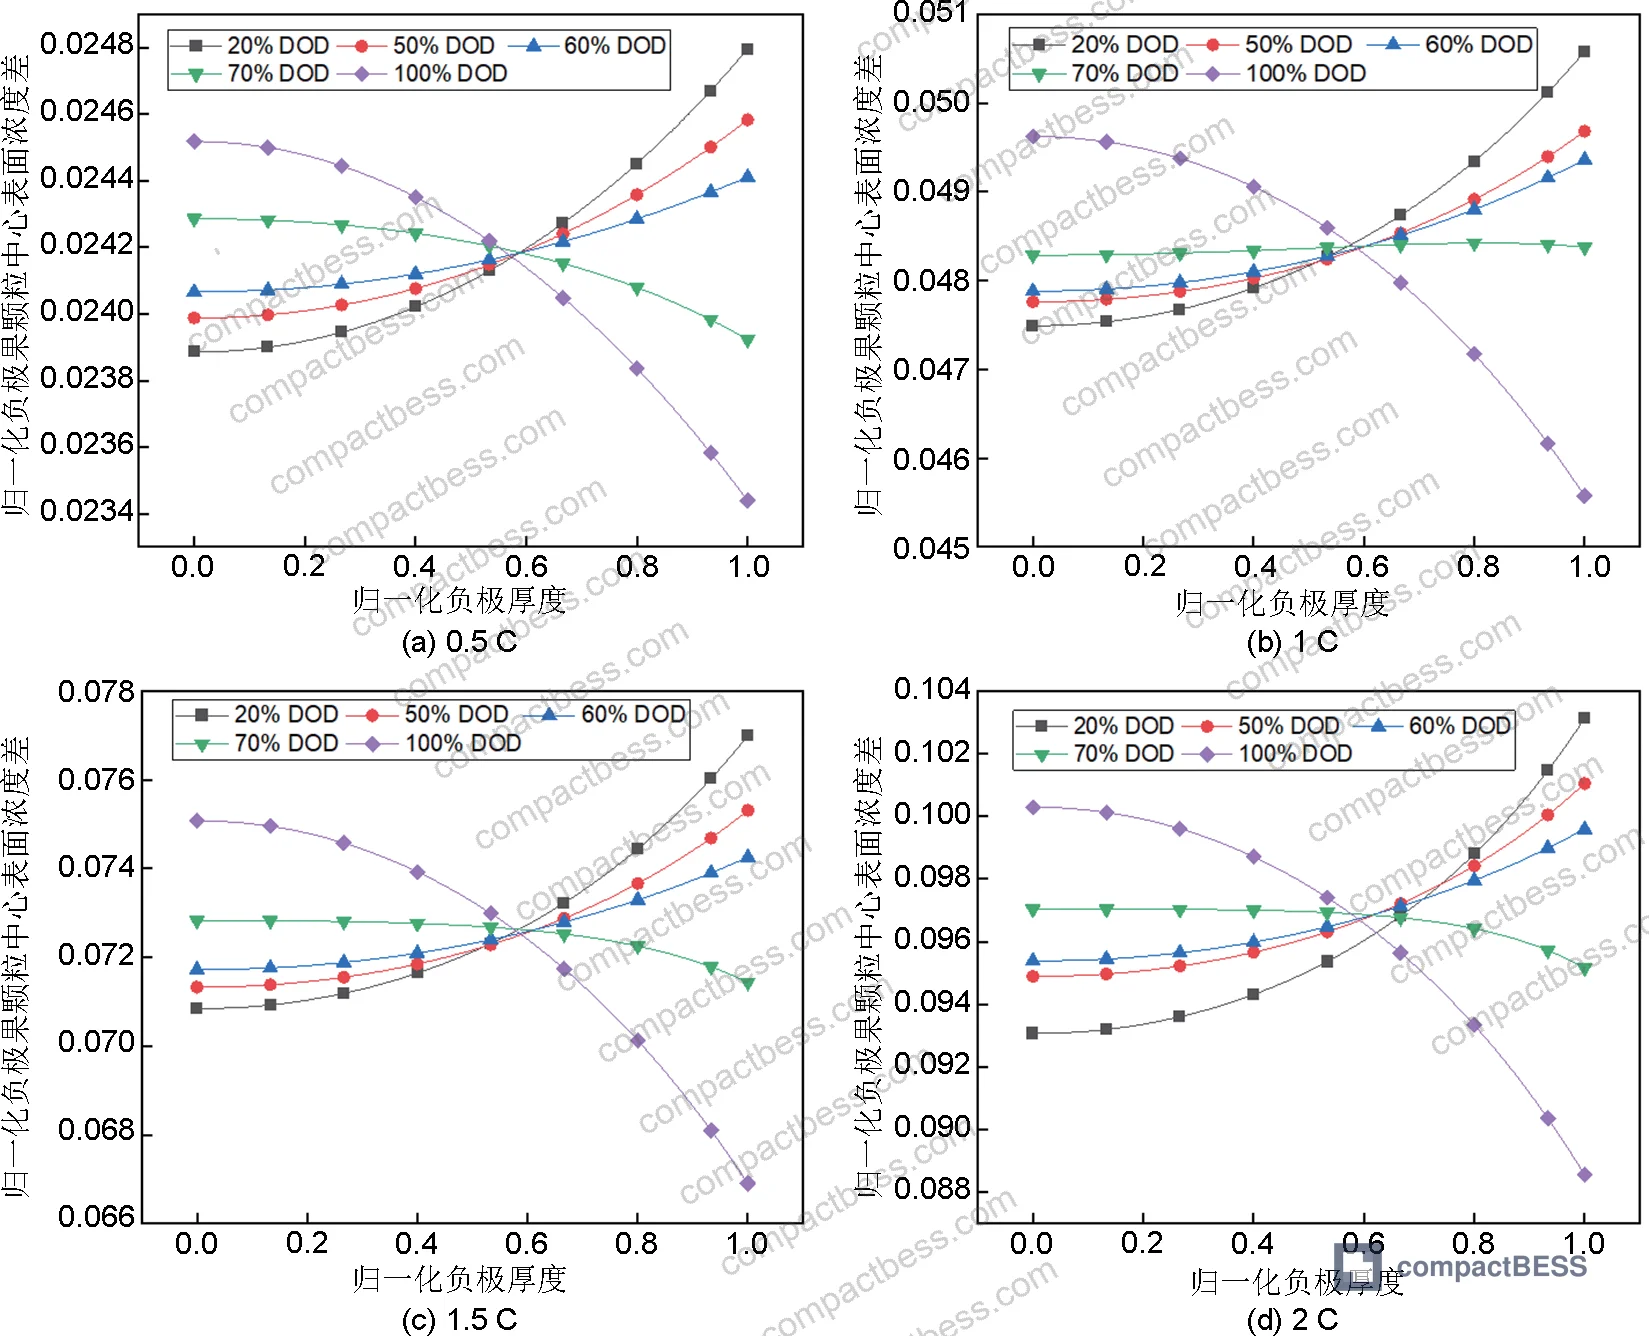
The spatial distribution across the anode thickness adds another layer of complexity that matters for electrode manufacturing specifications. In the early phase of discharge (0–60% DOD), the concentration gradient is higher near the separator end of the anode than near the current collector end. This flips between 60% and 70% DOD. After that crossover, the current collector end shows higher gradients. Practically, this means:
- Separator-side anode particles are under greater diffusion stress — and at higher fracture risk — during the first 60–70% of discharge
- Current collector-side particles take over that risk in the final 30–40% of discharge
- Any electrode manufacturing defect that increases local porosity or particle size variation near the separator will be exposed earlier in the cycle life
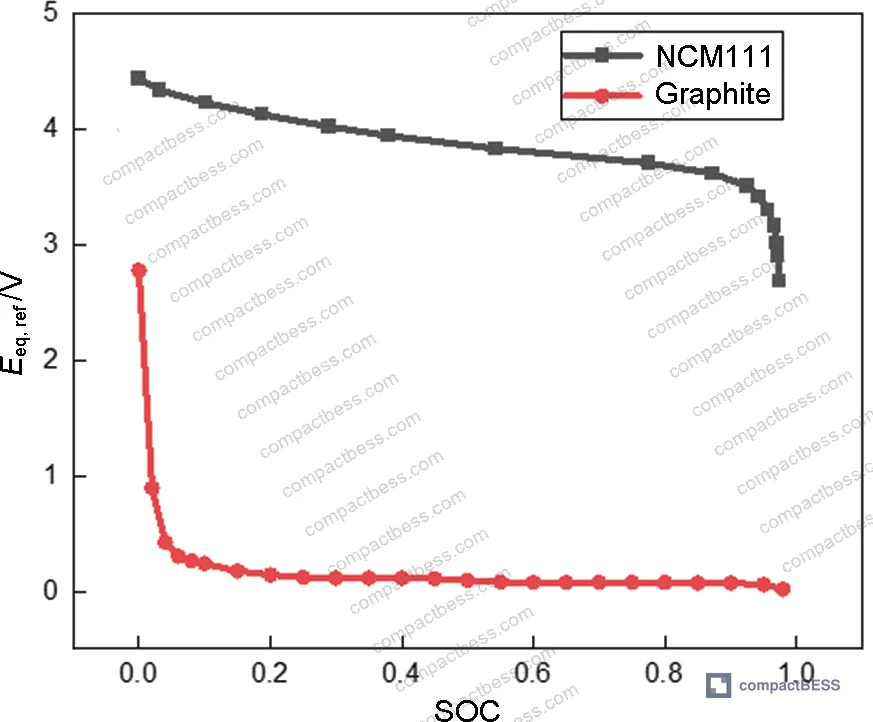
The normalized concentration differences at discharge completion across the four tested rates were measurably distinct — confirming that rate control is not just a thermal management issue but a direct mechanical stress management lever. Compliance with IEC 61960-3 Secondary lithium cells and batteries for portable applications requires capacity and cycle life benchmarking, but it does not mandate particle-level stress characterization. That gap is worth flagging to your supplier.
Honestly, most procurement teams over-specify the thermal management side of their cell qualification protocol and under-specify the mechanical side. A supplier who can only show you calorimeter data and temperature maps but cannot speak to anode particle stress modeling or electrode thickness uniformity is not a supplier who understands what limits your product’s service life.
Discharge Rate vs. Stress: Comparison Table #
| Discharge Rate | Anode Particle Diffusion-Induced Stress Order | Cell-Level Thermal Stress Order | Stress Ratio (DIS:Thermal) |
|---|---|---|---|
| 0.5 C | MPa range | kPa range | ~99.97% / ~0.03% |
| 1 C | MPa range (elevated vs. 0.5 C) | kPa range (elevated vs. 0.5 C) | ~99.97% / ~0.03% |
| 1.5 C | MPa range (further elevated) | kPa range (further elevated) | ~99.94% / ~0.05% |
| 2 C | MPa range (highest) | kPa range (highest) | ~99.94% / ~0.05% |
At both 0.5 C and 1 C, diffusion-induced stress accounts for approximately 99.97% of total mechanical stress at end of discharge, with thermal stress contributing only ~0.03%. At 1.5 C and 2 C, thermal stress rises to ~0.05% — still negligible in absolute terms but directionally significant as rate increases.
Thermal Stress Concentration at Pouch Cell Tabs: The Format-Specific Failure Mode #
This is where pouch format diverges from cylindrical — and where a lot of engineering teams get caught off guard during qualification.
In cylindrical cells, there are no exposed external tabs. The stress concentrations at current collector junctions are internal and geometrically distributed. In soft-pack pouch cells, the tabs protrude externally and connect to the cell body at a discrete interface. That junction is a mechanical stress concentration point under thermal loading.
The simulation confirmed what field data has suggested repeatedly: the tab-to-cell connection zone in soft-pack batteries generates significantly elevated thermal stress — well above the body-level kPa values observed across the main cell area. The copper negative tab exhibits higher thermal stress than the aluminum positive tab, which follows directly from the material property difference: copper has a substantially higher Young’s modulus than aluminum, meaning it resists deformation more aggressively and transmits more stress at the joint under equivalent temperature gradients.
The relationship between thermal stress magnitude and temperature differential across the cell is linear. This means the cell-level thermal stress and maximum displacement scale directly with the temperature difference the cell experiences — and that temperature difference grows with discharge rate. At 2 C, the temperature gradient across the cell is meaningfully larger than at 0.5 C, and the resulting thermal stress and dimensional change at the tab junction increases proportionally.
Most procurement teams don’t realize that this tab-junction stress mode is not tested or characterized under standard IEC cell-level qualification protocols. IEC 62619:2022 Safety requirements for secondary lithium cells and batteries covers abuse tolerance and safety thresholds, but tab-specific mechanical fatigue under cyclic thermal loading is a qualification gap that you need to close with your own incoming inspection protocol — or by requiring supplier-side simulation data on this specific geometry.
In supplier qualification work, we have seen tab delamination issues emerge in soft-pack cells from manufacturers who could not provide any documentation on tab weld strength vs. thermal cycling performance. Three of six sample lots from one qualification round showed visible tab interface degradation after 200 cycles at 1 C — not catastrophic failure, but enough to flag a systematic process control issue that a surface-level IEC compliance certificate would not have caught.
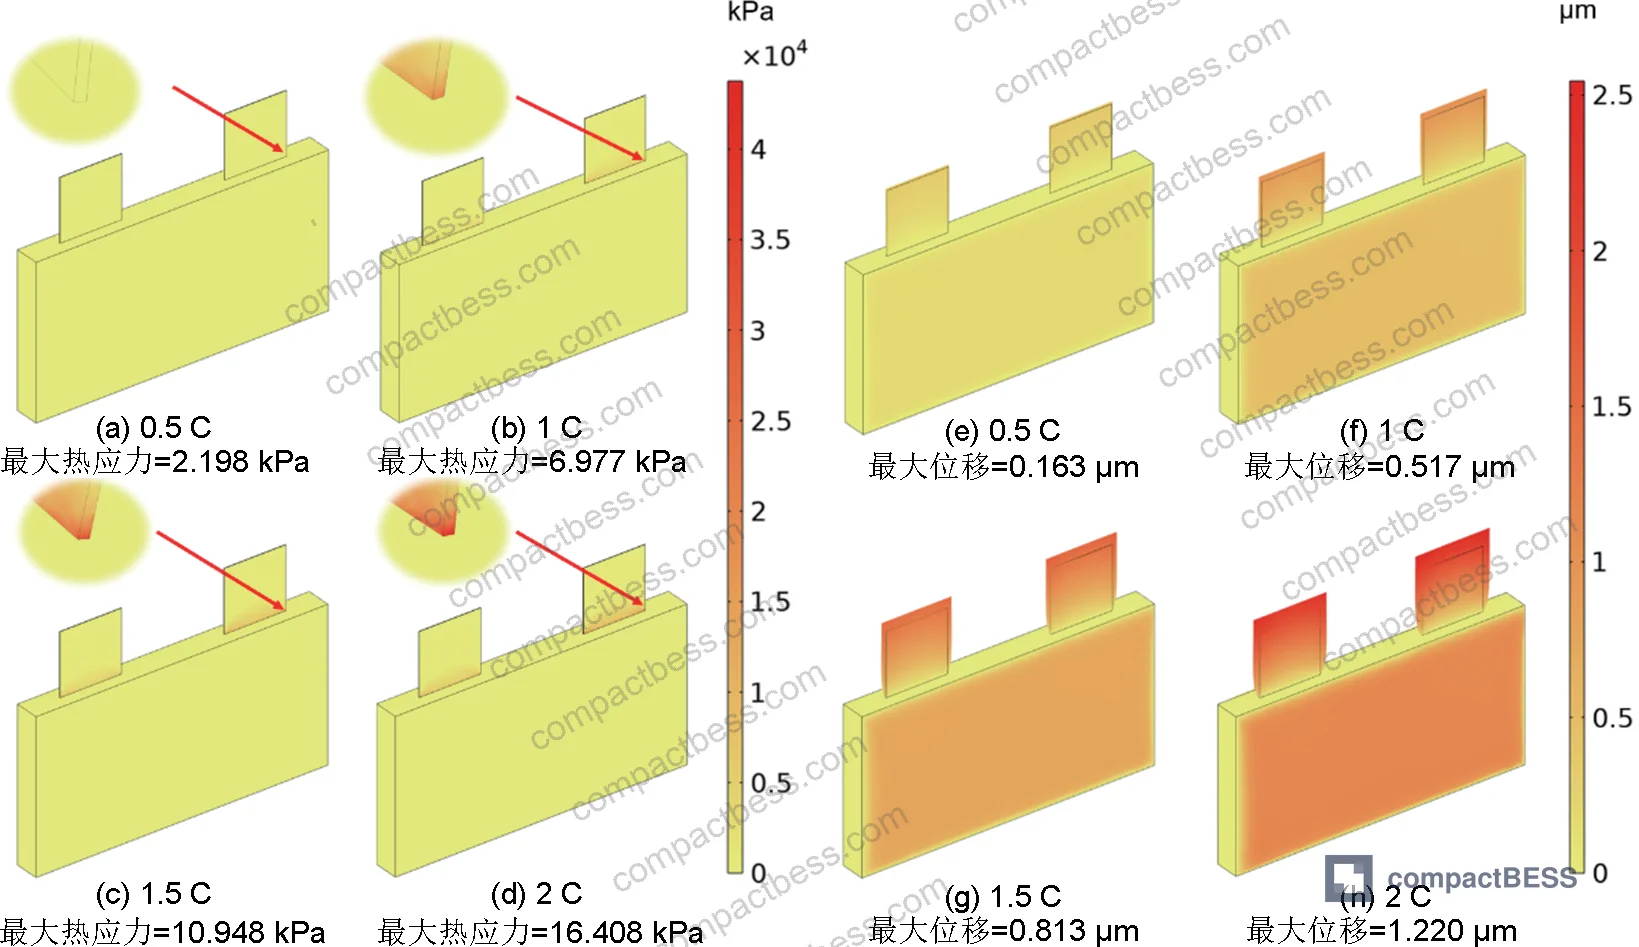
The displacement field from the simulation shows an inverse relationship between stress and displacement magnitude at the cell body level: regions of high stress exhibit lower displacement, and regions of low stress show higher displacement. This is the mechanical constraint effect — the stiffer, higher-stress zones restrict expansion of adjacent compliant zones. For pouch cell enclosure design and stack compression fixture design, this means you cannot assume uniform swelling across the cell face.
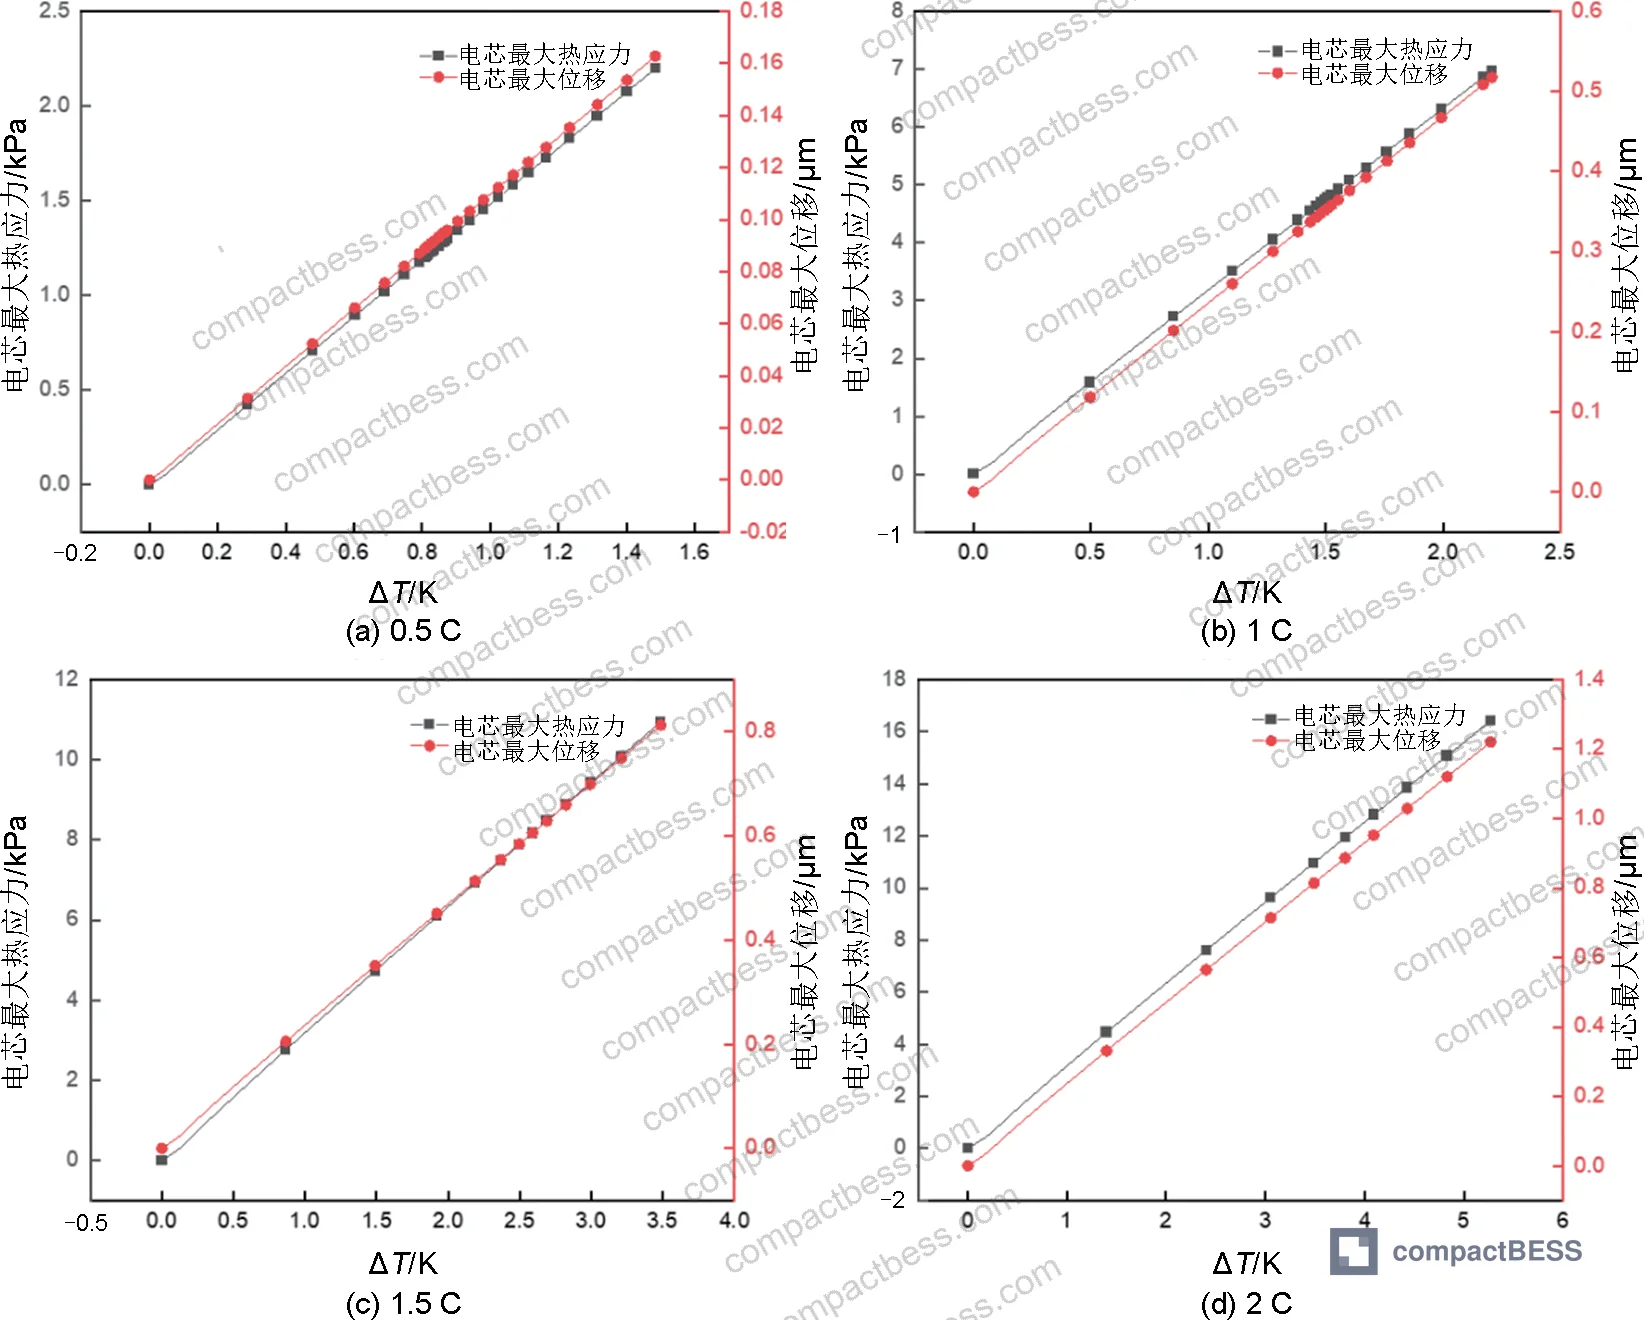
The linear correlation between maximum thermal stress, maximum displacement, and the cell’s internal temperature difference provides a practical monitoring lever: if you can instrument your cell for temperature differential measurement during discharge, you have a direct proxy for thermal stress loading. This is relevant for anyone designing BMS-integrated health monitoring into their pack. See SOH & RUL Prediction for how temperature-based stress proxies connect to state-of-health estimation methods.
For packs operating in applications with sustained high discharge rates — vehicle jump starters, high-drain UPS systems, power-intensive portable stations — the tab junction stress accumulation over service life is a non-trivial degradation pathway. Specifying tab weld quality, tab material (copper vs. nickel-plated copper), and tab thickness in your procurement documentation is not over-engineering. It’s basic.
Compliance with UL 9540A Test Method for Evaluating Thermal Runaway Fire Propagation in Battery Energy Storage Systems addresses system-level thermal propagation scenarios — but tab-level mechanical fatigue contributing to internal resistance growth sits upstream of that in the failure chain. Catch it earlier.
Practical Guidance for Buyers #
When you’re evaluating soft-pack NCM111 cells for integration into a compact energy storage product, the default tendency is to focus on capacity, voltage window, and rated cycle life. Those matter. But the mechanical stress profile at different operating rates — and specifically how your supplier controls anode particle consistency and tab weld quality — determines whether those rated numbers hold up over the actual service life of your product.
For format selection, the pouch form factor offers the best volumetric energy density and the most design flexibility — but it transfers mechanical risk to the tab connections and the pack enclosure design in ways that cylindrical and prismatic formats do not. If your application involves frequent high-rate discharge at 1.5 C or above, the tab-junction thermal stress concentration identified in this analysis should be a specific point in your supplier qualification protocol, not an afterthought.
At compactbess.com, we work with global OEM buyers and product development engineers who are sourcing compact battery systems from verified Chinese manufacturers — and the single most common gap we see in incoming procurement specifications is the absence of any mechanical stress or tab integrity requirement. If you are designing a product that will operate at 1 C or above on a regular basis, you need to specify this.
Low discharge rates — 0.5 C or below — measurably reduce both diffusion-induced stress and thermal stress simultaneously. If your application duty cycle allows it, rate-limiting through BMS configuration is one of the simplest reliability improvements available without changing the cell.
Need help identifying qualified suppliers for soft-pack NCM111 cells with documented tab weld strength and anode consistency specifications? Talk to our sourcing team →
Supplier Qualification Questions #
- What is your measured normalized lithium concentration difference between anode particle center and surface at end of 1 C discharge, and how does this value change at 2 C — can you provide simulation or empirical data for both conditions?
- Can you provide von Mises stress distribution data for the tab-to-cell connection zone specifically, and what is the maximum thermal stress value recorded at the copper negative tab junction under 1.5 C or 2 C discharge conditions?
- At what depth of discharge (DOD) does your anode particle stress distribution show a crossover between separator-end dominance and current-collector-end dominance — is it within the 60%–70% DOD range, and how is electrode thickness uniformity controlled to manage that crossover zone?
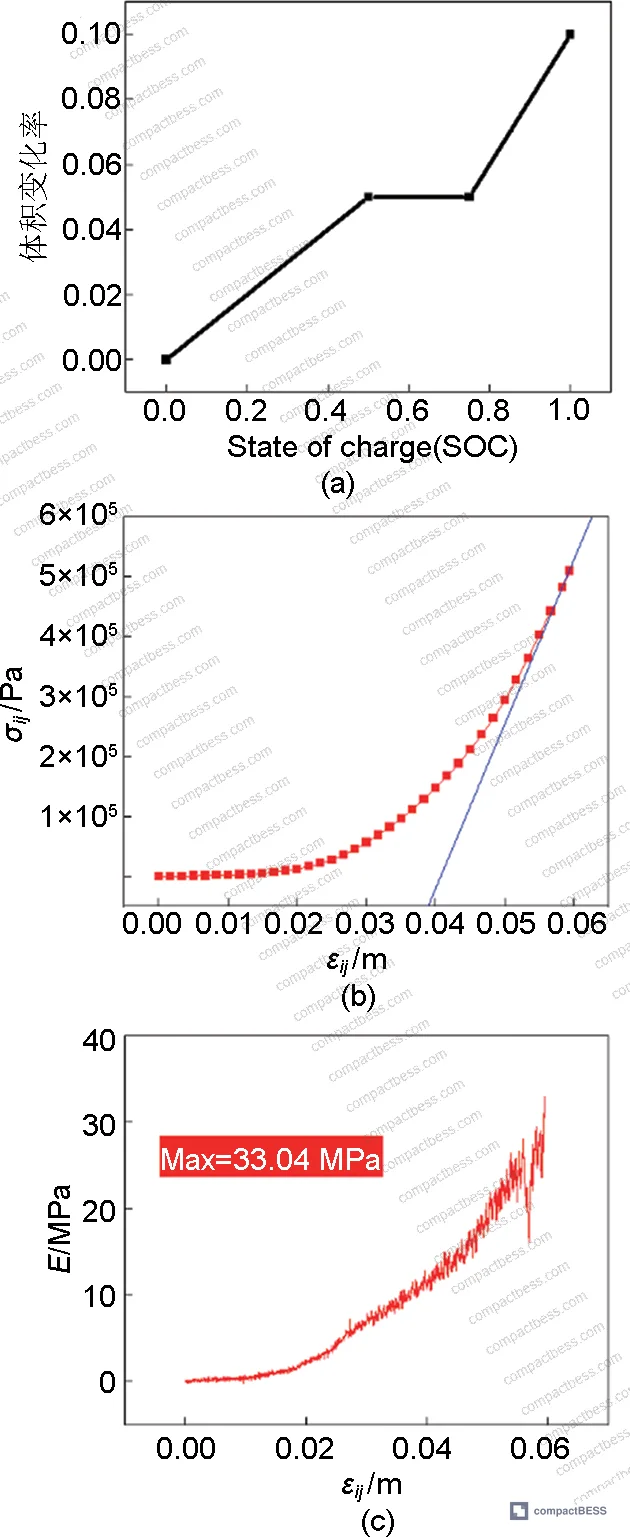
- What is the Young’s modulus value used in your electrode mechanical characterization, and can you provide stress-strain curve data for your anode material including maximum slope at end of test — how does this compare to the reference value used in your internal qualification model?
- For a cell discharged at 0.5 C and 1 C respectively, what percentage of total mechanical stress at end of discharge is attributable to diffusion-induced stress versus thermal stress — is the diffusion-induced component confirmed above 99.9% of total stress at both rates?
Sourcing Checklist #
- ☐ Supplier can provide anode particle diffusion-induced stress data (MPa scale) at minimum two discharge rates (e.g., 0.5 C and 1 C), confirmed via multiphysics simulation or direct measurement
- ☐ Tab-to-cell connection zone thermal stress has been characterized, with copper negative tab stress values documented and confirmed to be higher than aluminum positive tab due to Young’s modulus differential
- ☐ Cell-level thermal stress and maximum displacement show linear relationship with temperature differential, and supplier can provide the slope coefficient for the cell’s specific geometry
- ☐ Anode electrode thickness uniformity is controlled and documented, with specification addressing the separator-end vs. current-collector-end stress crossover point occurring between 60%–70% DOD
- ☐ Discharge rate protocol in BMS configuration limits continuous discharge to ≤1 C for longevity-critical applications, with documentation of stress impact at 1.5 C and 2 C rates
- ☐ Cell passed IEC 62619:2022 safety certification with test reports available, and supplier can explain which tab-junction mechanical failure modes are — and are not — covered by that standard
- ☐ Tab weld strength specification is documented with acceptance criteria, and supplier can provide data showing tab integrity after thermal cycling equivalent to ≥200 charge-discharge cycles at 1 C
- ☐ Supplier can confirm the cell format (soft-pack/pouch) design addresses the specific stress concentration mode at exposed tab junctions that is absent in cylindrical cell formats
Key Specifications Table #
| Parameter | Recommended Value | Verification Method |
|---|---|---|
| Anode particle diffusion-induced stress magnitude | MPa order (~3,300× higher than thermal stress) | Multiphysics simulation (electrochemical-mechanical coupled model) or in-situ strain measurement |
| Cell-level thermal stress magnitude | kPa order; diffusion stress share ≥99.94% of total at ≤2 C | Coupled 3D solid mechanics + heat transfer simulation; verified against temperature differential data |
| DOD crossover point for anode stress distribution | 60%–70% DOD | Simulation of normalized Li concentration difference: separator-end vs. current-collector-end |
| Maximum diffusion-induced stress at 70% DOD | ~67% of peak maximum diffusion-induced stress value | Electrochemical-particle dimension model output at each tested discharge rate |
| Thermal stress vs. temperature differential relationship | Linear; slope increases with discharge rate | Regression of max thermal stress and max displacement vs. cell ΔT at 0.5 C, 1 C, 1.5 C, 2 C |
| Tab junction thermal stress (copper negative tab) | Higher than aluminum positive tab; MPa-level at tab zone vs. kPa at cell body | 3D thermal-mechanical simulation with material-specific Young’s modulus values |
Can’t find a supplier meeting these specs? Submit your requirements and we’ll match you within 48 hours.
References #
Data source: Diffusion-Induced Stress and Thermal Stress During Discharge of Ternary Soft-Pack Lithium-Ion Batteries: A Coupled Electrochemical-Mechanical-Thermal Analysis, Q.-T. Fang et al., Journal of the Electrochemical Society, 2025
Frequently Asked Questions #
Why is diffusion-induced stress so much larger than thermal stress in pouch cells during discharge?
Diffusion-induced stress originates at the anode particle level — microscopic volumes with steep lithium concentration gradients between particle center and surface. The stress is proportional to that gradient, which intensifies with discharge rate. Thermal stress at the cell body level involves much larger, more compliant geometric structures with distributed temperature fields, so the absolute stress values are orders of magnitude lower. At 0.5 C and 1 C, diffusion-induced stress accounts for approximately 99.97% of total mechanical stress at end of discharge.
Does discharge rate affect both stress types proportionally?
Both stress types increase with discharge rate, but not proportionally. Diffusion-induced stress rises because the lithium concentration gradient between anode particle center and surface increases faster at higher rates. Thermal stress rises because the cell’s internal temperature differential grows with rate, and the relationship between temperature differential and thermal stress is linear. However, because diffusion-induced stress starts from such a higher baseline, the gap between the two stress magnitudes remains large even at 2 C.
What makes pouch cells structurally different from cylindrical cells regarding thermal stress?
The exposed tab design. Cylindrical cells have no external tabs — current collection happens through internal geometry, distributing mechanical loads more uniformly. Pouch cells have copper (negative) and aluminum (positive) tabs that protrude from the cell body, creating a discrete mechanical joint where thermal stress concentrates. Copper’s higher Young’s modulus relative to aluminum means the negative tab generates higher thermal stress than the positive tab under identical temperature conditions. This is a pouch-format-specific failure pathway with no direct cylindrical equivalent.
At what point in the discharge cycle is the separator-end of the anode under the greatest mechanical risk?
During the first 60%–70% of discharge, the lithium concentration difference is higher near the separator end of the anode than near the current collector end — meaning the separator-side particles are under greater diffusion-induced stress and face higher fracture probability during this phase. After the 60%–70% DOD crossover point, the current collector end takes over as the higher-stress zone. Any electrode manufacturing defect concentrated near the separator will be stressed earliest and most persistently.
Can temperature monitoring serve as a proxy for mechanical stress assessment during service?
Yes, with an important qualification. The relationship between the cell’s internal temperature differential and both maximum thermal stress and maximum displacement is confirmed to be linear — so temperature differential is a valid proxy for cell-body thermal stress loading. However, diffusion-induced stress at the particle level is not directly accessible via temperature monitoring; it requires electrochemical state estimation (lithium concentration gradient) or indirect indicators like impedance spectroscopy. For BMS-integrated monitoring, temperature differential is a useful but incomplete mechanical health indicator. See SOC Estimation Methods for approaches that can complement temperature-based monitoring.
Published by compactbess.com Technical Team | Request a sourcing quote


