

TL;DR #
Polarization — specifically the interplay between ohmic, electrochemical, and concentration polarization — is the single most reliable predictor of pouch cell performance degradation across temperature and rate conditions, with high-polarization cells showing measurably lower discharge voltage platforms at –20 °C compared to standard cells. For procurement engineers, this means internal resistance data alone is insufficient: you need suppliers who can report DCIR at 1C/1s alongside post-discharge equilibrium voltage relaxation curves to distinguish genuinely low-polarization designs from cells that simply pass initial capacity checks. Before committing to a pouch cell supplier, require polarization characterization data under at least two C-rate conditions and one low-temperature discharge profile (–20 °C minimum).
Overview #
Pouch cell polarization is one of those topics that separates battery engineers from battery salespeople — and most procurement teams are still asking the wrong questions when they evaluate soft-pack lithium-ion cells. Research conducted by a product engineering team at a major Chinese lithium-ion cell manufacturer examined internal resistance evolution and low-temperature discharge behavior through the lens of three polarization components: ohmic, concentration, and electrochemical. The study combined physical discharge curve analysis, DCIR measurement at –20 °C, and voltage relaxation modeling across calendar-aged and cycle-aged cell groups — with aging comparisons extended to over 300 charge-discharge cycles.
The findings are directly applicable to any buyer sourcing pouch cells for portable power stations, energy storage modules, or industrial backup systems. Understanding how polarization manifests in discharge curves, DCIR readings, and post-discharge equilibrium voltage recovery gives procurement engineers a concrete framework for qualifying suppliers beyond datasheet capacity ratings.
For buyers new to cell format selection and sourcing decisions, the pouch (soft-pack) format is particularly sensitive to polarization effects because electrode thickness, electrolyte saturation uniformity, and jig-pressing during formation all directly influence interface resistance — and none of those variables show up in a standard capacity spec sheet.
Polarization Mechanisms in Lithium-Ion Pouch Cells: What the Discharge Curve Actually Tells You #
Three distinct polarization types govern pouch cell voltage behavior, and they operate on different timescales. Understanding this is essential for interpreting any discharge data a supplier gives you.
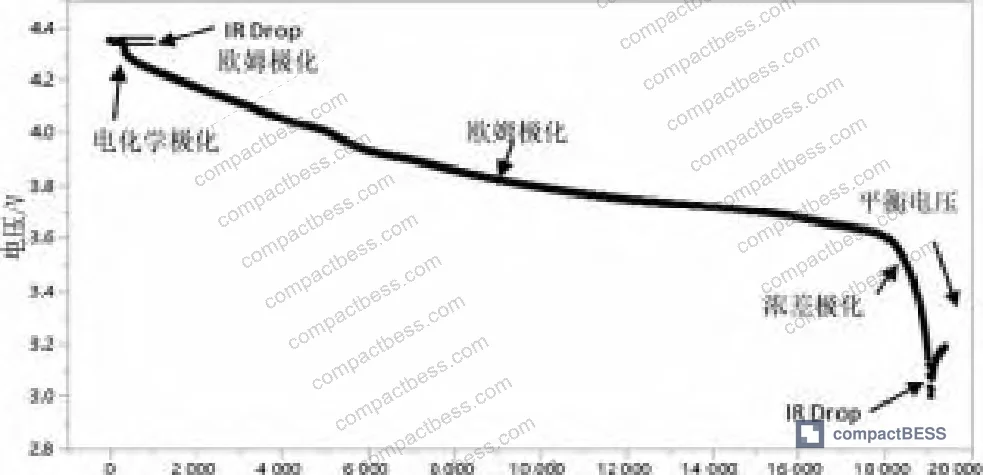
Ohmic polarization responds fastest — it appears as the instantaneous voltage drop (IR drop) the moment current begins to flow. It reflects the combined resistance of electrode materials, current collectors, electrolyte conductivity, and contact interfaces. Electrochemical polarization develops more slowly and is tied to the kinetics of the lithiation/delithiation reaction at electrode surfaces. Concentration polarization is the slowest, driven by lithium-ion diffusion gradients through both the solid phase (within electrode particles) and the liquid phase (electrolyte in separator and electrode pores).
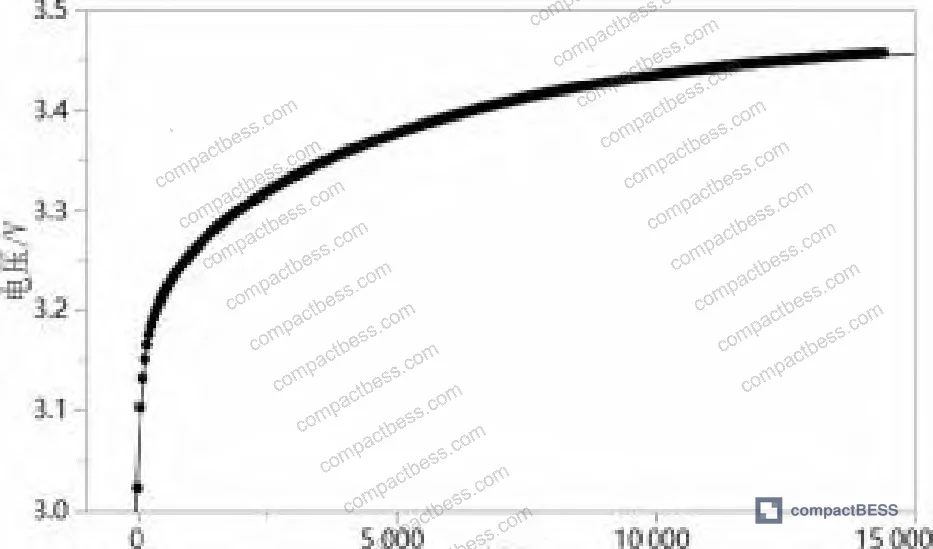
The discharge curve maps all three sequentially. At discharge initiation, ohmic polarization causes an immediate voltage step-down. As discharge continues, electrochemical polarization dominates the mid-plateau region. Toward end-of-discharge, concentration polarization accelerates voltage collapse as lithium-ion transport through the electrode stack becomes rate-limiting. After discharge terminates, the voltage rebounds instantly — that’s ohmic polarization recovering — then continues rising along an exponential relaxation curve as concentration gradients dissipate. The cell eventually stabilizes at an equilibrium voltage that reflects its true electrochemical state.
This four-stage discharge behavior is what makes the pouch format both high-performance and difficult to qualify. Because electrode thickness directly affects solid-phase diffusion path length, a cathode that’s even slightly over-spec in thickness will show disproportionately elevated concentration polarization at high rates and low temperatures.
Temperature Dependence of Polarization #
Temperature is the most aggressive amplifier of polarization in pouch cells. At low temperatures, lithium-ion migration resistance through both electrode particles and electrolyte increases sharply, elevating all three polarization types simultaneously — but concentration polarization is hit hardest. The practical result: the discharge voltage platform drops relative to room-temperature operation, and the cell reaches its cutoff voltage earlier, reducing deliverable capacity.
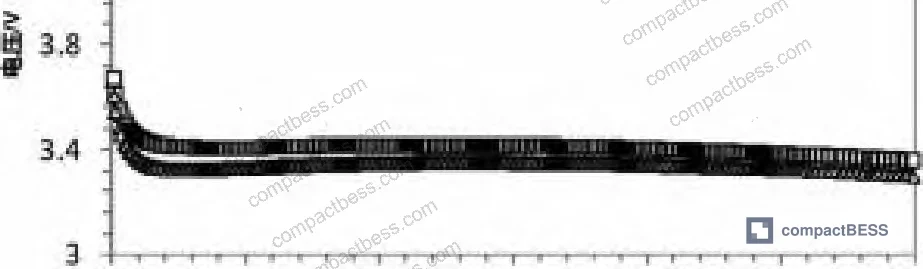
The research compared standard-process cells against deliberately high-polarization cells (processed with a jig-bake formation step that increases interface resistance) under –20 °C discharge. The high-polarization cells showed a lower discharge voltage platform, and their equilibrium voltage after discharge was below 3.4 V. Because the equilibrium voltage was already below the 3.4 V inflection point, low-temperature discharge capacity from these cells was severely limited even before rate effects compounded the problem.
At room temperature, the situation reverses slightly: elevated temperature improves ion mobility, reduces polarization, and can produce marginally higher discharge capacity than the room-temperature baseline. This is well understood. What’s less appreciated is that the cell’s low-temperature performance ceiling is determined during electrode design — specifically by cathode thickness and electrolyte formulation — not by anything that can be compensated through system-level thermal management after the fact.
Rate Dependence: How C-Rate Interacts with Polarization #
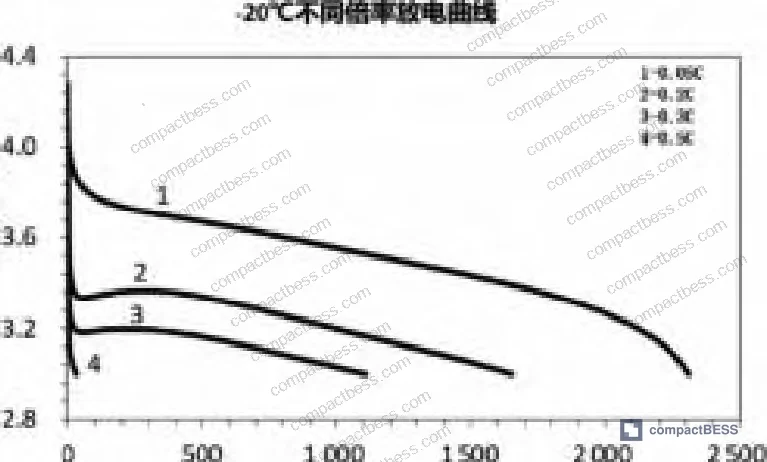
At –20 °C under 0.05C discharge, polarization is near-minimum: slow ion movement means concentration gradients remain manageable. As C-rate increases, solid-phase diffusion speed through electrode particles becomes the bottleneck. The research data shows that under high-rate discharge at –20 °C, the discharge curve shifts downward, and the proportion of residual lithium remaining trapped inside negative electrode particles at end-of-discharge increases — meaning the cell is delivering less of its theoretical capacity with each step up in C-rate.
This is a critical procurement implication. A cell rated for 1C continuous discharge at room temperature may deliver only a fraction of that capacity at –20 °C under the same 1C load — not because the capacity is “gone,” but because polarization prevents full lithium extraction before the cutoff voltage is reached.
DCIR and Overpotential Decay Modeling: The Tools That Separate Good Suppliers from Paper Suppliers #
DCIR as a Polarization Proxy #
DCIR (DC Internal Resistance) at 1C for 1 second is the standard field-accessible measurement for ohmic polarization in lithium-ion cells. The formula is straightforward: R = ΔV / I, where ΔV is the voltage drop observed when 1C current is applied. In the comparative data, standard-process pouch cells showed lower DCIR values at –20 °C than jig-baked high-polarization cells — confirming that physical interface resistance (increased by the formation process) directly translates to measurable DCIR increase and a corresponding drop in discharge voltage platform.
The correspondence between DCIR and discharge voltage platform is not coincidental. It’s a direct physical relationship: higher interface resistance means more voltage is lost as heat during discharge, leaving less driving potential for actual lithium transport. Buyers who use DCIR as a pass/fail metric are on the right track — but DCIR alone misses the concentration polarization component, which doesn’t show up until you look at post-discharge voltage relaxation.
Honestly, most procurement teams treat DCIR as a checkbox rather than a diagnostic tool. They ask for a single DCIR value at room temperature and call it done. The data here shows that DCIR differences between cell variants are most diagnostically useful at low temperature (–20 °C), where polarization spreads widen and differentiate cell quality far more clearly than at 25 °C.
Overpotential Decay Modeling and Equilibrium Voltage Analysis #
The post-discharge voltage relaxation curve contains more information about a cell’s aging state than most buyers ever extract. The research applies a two-component overpotential decay model to this relaxation:
V = b0 − b1 × exp(−t/b2) − b3 × exp(−t/b4)
Where b0 is the stable equilibrium voltage after complete relaxation, b1 and b2 are constants associated with liquid-phase (electrolyte) diffusion, and b3 and b4 are associated with solid-phase (electrode particle) diffusion. The two exponential terms run in series, representing the two physically distinct diffusion processes that recover on different timescales after discharge.
Fitting this model to aging data produces a clear picture of degradation mechanism. In the calendar-aged cell group, the aging trajectory breaks into three distinct phases:
- Early phase: Equilibrium voltage decreases as the electrolyte wets more completely into the electrode stack. Liquid-phase parameter b1 stays constant; solid-phase parameter b3 decreases — indicating reduced electrode particle resistance as saturation improves.
- Mid phase: Equilibrium voltage increases linearly. Capacity fades, electrolyte is consumed by side reactions, b1 increases linearly while b3 slowly plateaus. The electrode/separator stack is now fully wetted; further electrolyte consumption directly impairs liquid-phase transport.
- Late phase: Growth rate of equilibrium voltage slows. Both b1 and b3 stabilize, suggesting the electrolyte supply/demand reaches a dynamic equilibrium and electrode degradation rate levels off.
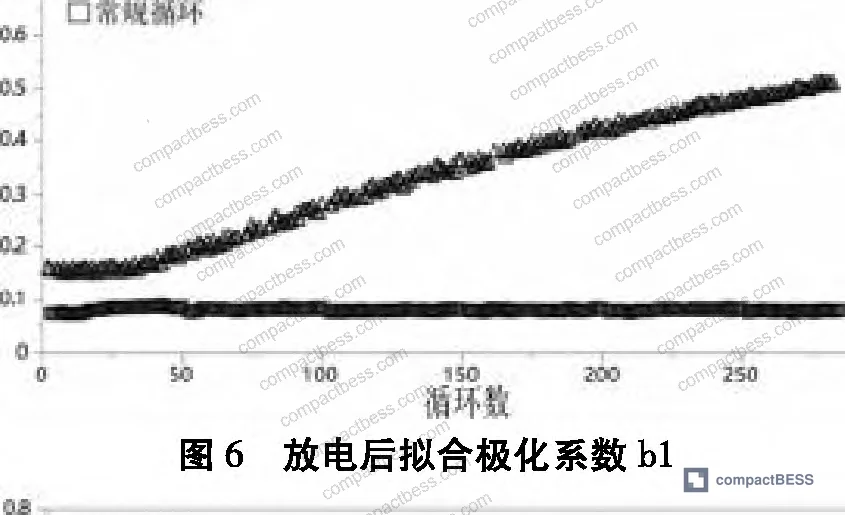
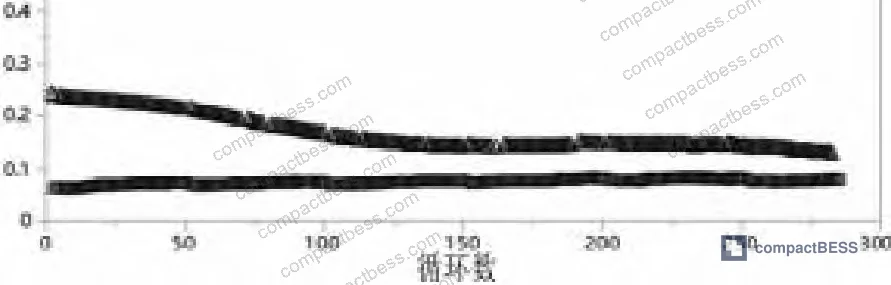
The critical comparative finding: standard cycled cells (no calendar aging exposure) show no significant increase in b1 or b3 within 300 cycles. Calendar-aged cells reach equivalent b1/b3 values in far fewer equivalent cycles. This means calendar aging is a materially different and more aggressive degradation pathway than pure cycling — a point most buyers don’t factor into their product lifetime specifications.
Practical Guidance for Buyers #
When you’re evaluating pouch cell suppliers for applications that see any combination of low-temperature operation, high discharge rates, or extended calendar life requirements — which is most real-world applications — polarization data should be a non-negotiable part of your technical package request.
At minimum, ask for: discharge curves at 25 °C and –20 °C under 0.2C and 1C; DCIR measured at 1C/1s at both temperatures; and post-discharge voltage relaxation curves with the fitted b0 equilibrium voltage values at a reference SOC. If a supplier can’t provide the –20 °C data, that’s a red flag. If they can’t explain the difference between their DCIR and their equilibrium voltage behavior, they’re probably not running the diagnostics internally.
The IEC 62619:2022 Safety requirements for secondary lithium cells and batteries and IEC 61960-3 Secondary lithium cells and batteries for portable applications both provide test frameworks, but neither mandates the depth of polarization characterization that field performance actually requires. For applications where discharge performance below 0 °C matters, you need to go beyond compliance minimums.
Pay particular attention to electrode design disclosures. Cathode thickness is the key variable for solid-phase diffusion performance — thinner cathodes show lower concentration polarization at high rates but reduce volumetric energy density. This is a design tradeoff, and qualified suppliers should be able to tell you where they sit on that curve. For deeper background on how cell formats and dimensional specifications interact with electrical performance, our documentation covers the critical tolerances.
At compactbess.com, our team connects global OEM brands and energy storage integrators with verified Chinese pouch cell manufacturers who can provide full polarization characterization data — not just datasheet capacity numbers. If your sourcing inquiry requires specific low-temperature performance thresholds or calendar life targets, we can match you to suppliers whose internal qualification protocols actually cover these parameters.
Need help identifying qualified suppliers for pouch cells with documented low-temperature polarization performance? Talk to our sourcing team →
Supplier Qualification Questions #
- Can you provide discharge voltage curves at –20 °C under both 0.2C and 1C conditions, showing the voltage platform values for your standard production cells versus any high-internal-resistance variants?
- What is the 1C/1s DCIR value for your pouch cells at –20 °C, and how does it compare to the room-temperature DCIR — specifically, what is the DCIR ratio between –20 °C and 25 °C for your current production batch?
- Do you perform post-discharge voltage relaxation analysis, and can you provide fitted equilibrium voltage (b0) values along with liquid-phase diffusion coefficient (b1) and solid-phase diffusion coefficient (b3) from your overpotential decay model at end-of-formation and after 300 cycles?
- What is your cathode electrode thickness specification, and how does your design balance solid-phase diffusion path length against volumetric energy density — specifically, what concentration polarization increase have you measured when cathode thickness exceeds your nominal spec by 10%?
- How do calendar-aged cells in your qualification program compare to standard cycled cells at equivalent cycle counts in terms of b1 (liquid-phase diffusion) growth rate, and at what cycle number does your calendar-aged population show significant b3 (solid-phase diffusion) deviation from the standard cycle baseline?
Sourcing Checklist #
- ☐ Supplier provides discharge voltage curves at –20 °C under at least two C-rates (0.2C and 1C), with documented voltage platform values
- ☐ DCIR data available at 1C/1s measurement condition for both 25 °C and –20 °C, confirming room-temperature DCIR below supplier’s specified threshold
- ☐ Post-discharge equilibrium voltage (b0) data available from relaxation curve fitting, with b1 and b3 parameters reported for both fresh and aged cells
- ☐ Formation process documented — jig-bake or compression parameters specified, with corresponding DCIR impact quantified and within acceptance limits
- ☐ Cell meets applicable safety and performance requirements per IEC 62133-2:2017 Safety requirements for portable sealed secondary lithium cells, with test certificates available for review
- ☐ Supplier can distinguish calendar aging degradation pathway from pure cycle aging, with b1 linear growth rate data available for calendar-aged samples beyond 100 storage-cycle equivalent events
- ☐ Electrolyte saturation (wetting) process is documented, with evidence that early-cycle equilibrium voltage decrease (b3 reduction phase) has been characterized and used to set formation protocol endpoints
- ☐ Low-temperature discharge capacity at –20 °C/1C is specified as a percentage of room-temperature rated capacity, with a minimum threshold of ≥70% confirmed against UN 38.3 Recommendations on the Transport of Dangerous Goods — Lithium Battery Testing conditioning protocols
Key Specifications Table #
| Parameter | Recommended Value | Verification Method |
|---|---|---|
| DCIR at 25 °C (1C/1s) | ≤ supplier’s nominal spec; verify ratio vs. –20 °C value | Apply 1C pulse for 1 second, measure ΔV, calculate R = ΔV/I |
| DCIR at –20 °C (1C/1s) | ≤ 2× room-temperature DCIR for standard-process cells | Same 1C/1s method, cell pre-conditioned at –20 °C for ≥4 hours |
| Discharge voltage platform at –20 °C / 1C | Equilibrium voltage b0 ≥ 3.4 V post-discharge | Post-discharge relaxation curve fitting using two-component decay model |
| Liquid-phase diffusion coefficient b1 (fresh cell) | Low baseline; linear growth rate should be near-zero within first 300 cycles for standard cycle aging | Fit V = b0 − b1×exp(−t/b2) − b3×exp(−t/b4) to relaxation curves at each cycle check |
| Solid-phase diffusion coefficient b3 | Should decrease in early formation phase (wetting improvement), then stabilize | Same relaxation curve fitting; decreasing b3 in first 50 cycles is expected and acceptable |
| Low-temperature capacity retention at –20 °C / 0.2C | ≥ 80% of rated room-temperature capacity | Full discharge at 0.2C from 100% SOC at –20 °C, compare to 25 °C baseline |
| Calendar aging equilibrium voltage growth rate (b1 slope) | Linear growth onset should occur after ≥100 cycle equivalents | Plot b1 vs. cycle number; compare calendar-aged vs. standard cycled populations |
Can’t find a supplier meeting these specs? Submit your requirements and we’ll match you within 48 hours.
References #
Data source: Polarization Analysis and Degradation Mechanism Characterization of Lithium-Ion Pouch Cells Under Low-Temperature and Variable Rate Conditions, F. Li et al., Journal of the Electrochemical Society, 2023
Frequently Asked Questions #
What is the practical difference between ohmic polarization and concentration polarization in pouch cells, and why does it matter for procurement?
Ohmic polarization is instantaneous — it appears as the IR drop the moment current flows and is directly tied to physical interface resistance (electrode contacts, electrolyte conductivity, SEI film). Concentration polarization is slow-building, driven by lithium-ion diffusion gradients through electrode particles and electrolyte. For procurement, the distinction matters because DCIR measurements capture ohmic polarization well but underestimate concentration polarization effects. A cell can show acceptable DCIR at room temperature and still fail badly at low temperature due to high concentration polarization — which is exactly the failure mode that catches buyers off-guard when products are deployed in cold climates.
Why does the jig-bake formation process increase polarization, and should I avoid suppliers who use it?
Jig-baking (pressing cells with fixtures during formation) is used to control thickness uniformity and electrode adhesion — both legitimate quality objectives. The tradeoff is that it increases interface resistance, raising DCIR and lowering the discharge voltage platform. Whether this is acceptable depends on your application: for thickness-sensitive applications where dimensional tolerance matters more than low-temperature peak performance, jig-baking is standard and appropriate. The key is that the supplier quantifies the DCIR impact and designs the electrode stack to keep polarization within spec despite the process. Don’t disqualify jig-bake suppliers — disqualify those who can’t tell you what the DCIR penalty is.
How should I interpret the three-phase equilibrium voltage aging curve when evaluating a cell supplier’s lifecycle data?
The three phases — decreasing, linear-increasing, then plateauing equilibrium voltage — are a characteristic signature of a healthy lithium-ion pouch cell aging trajectory. The initial decrease reflects improving electrolyte wetting (good); the linear increase reflects electrolyte consumption accelerating with cycling (expected, but rate matters); the plateau indicates the system approaching dynamic equilibrium. A supplier who can show you this three-phase curve for their cells has actually run the testing. A supplier who shows a straight-line capacity fade curve without equilibrium voltage data almost certainly hasn’t done this level of characterization.
What’s the difference in aging rate between calendar-aged and cycle-aged pouch cells, and how does it affect warranty or lifetime specs?
Standard cycled cells showed no significant increase in liquid-phase diffusion parameter b1 or solid-phase parameter b3 within 300 cycles. Calendar-aged cells (stored at elevated SOC between cycling events) reached equivalent polarization increases in far fewer cycles. In practice, this means products that spend significant time at high SOC between uses — emergency backup systems, seasonal equipment — degrade faster than pure cycle count would predict. If your application involves intermittent use at sustained high SOC, demand calendar aging test data specifically, not just cycle life data.
Is the IEC 62619:2022 certification sufficient to confirm a pouch cell’s low-temperature polarization performance?
No. IEC 62619 covers safety requirements — thermal runaway, short circuit, overcharge — not performance characterization under polarization-relevant conditions. It doesn’t mandate low-temperature discharge curves, DCIR at –20 °C, or post-discharge relaxation analysis. Compliance with IEC 62619 tells you the cell won’t catch fire under defined abuse conditions. It says nothing about whether the voltage platform at –20 °C is adequate for your application. For cycle life and degradation evaluation, you need supplementary test data beyond what any safety standard requires.
Published by compactbess.com Technical Team | Request a sourcing quote


