

TL;DR #
In structured testing across three vehicle duty cycles at 25 °C and 0 °C, aluminum busbar-mounted sensors tracked cell body temperature within a maximum delta of 2.7 °C — well inside the ≤5 °C BMS threshold required for production battery systems. For buyers specifying temperature monitoring architecture in prismatic or cylindrical cell modules, this validates busbar placement as the engineering-optimal position, eliminating long-term sensor damage from cell swelling. When qualifying a BMS supplier, require them to demonstrate cell-to-busbar temperature deviation data under high-current discharge rather than accepting general claims about sensor accuracy.
Overview #
Temperature monitoring placement is one of those specification details that procurement teams routinely under-scrutinize — and then pay for in warranty claims. The engineering question is not whether to monitor cell temperature, but where exactly to position the sensor so that it survives thousands of charge-discharge cycles while still accurately representing what the cell is actually doing thermally.
This analysis draws on controlled laboratory validation conducted by an automotive-grade battery engineering team at a major Chinese EV manufacturer. The experiment used a 2P8S module — 16 prismatic NMC cells connected through 1060-O series aluminum busbars — and ran three representative vehicle duty cycles at both 25 °C and 0 °C ambient. Ten temperature collection points (T1–T10) were distributed across two representative cell positions: Cell 8 (module center, poor thermal dissipation) and Cell 16 (module end, adjacent to aluminum end plate, faster dissipation). Five sensors were placed on cell body surfaces; two reference points (T5, T10) were mounted on the high-voltage aluminum busbars.
The dataset is clean enough to draw engineering conclusions, and those conclusions have direct implications for how buyers should specify BMS sensor placement in pack-level procurement.
The module parameters are worth stating explicitly: single cell capacity of 113.5 A·h at 1C (115.9 A·h at 0.33C), nominal voltage of 3.67 V, energy per cell of 414.7 W·h at 1C. The module assembled to 227 A·h / 6.66 kW·h at 1C, with an operating voltage range of 22.4–34.8 V. Cell operating temperature ranged from −30 °C to 55 °C on discharge, with charging restricted to −20 °C and above. The aluminum busbar cross-section was 1.5 mm × 55 mm — sized to meet 1.1× overcurrent capacity for standard EV peak current demand.
Understanding Cell Formats & Form Factors is prerequisite context here, because the optimal sensor placement differs fundamentally between prismatic, cylindrical, and pouch cells — and the data from this test program confirms that distinction with measurable margins.
Temperature Sensor Placement by Cell Format: What the Test Data Actually Shows #
The core finding from three duty cycles across two ambient temperatures is straightforward: for prismatic (square-shell) and cylindrical cells, mounting temperature sensors on the aluminum busbar is not a compromise — it is the correct engineering choice. The measured temperature difference between busbar-mounted sensors and cell body sensors stayed within 2.7 °C across all test conditions, satisfying the production BMS requirement of ≤5 °C deviation between acquired temperature and actual cell temperature.
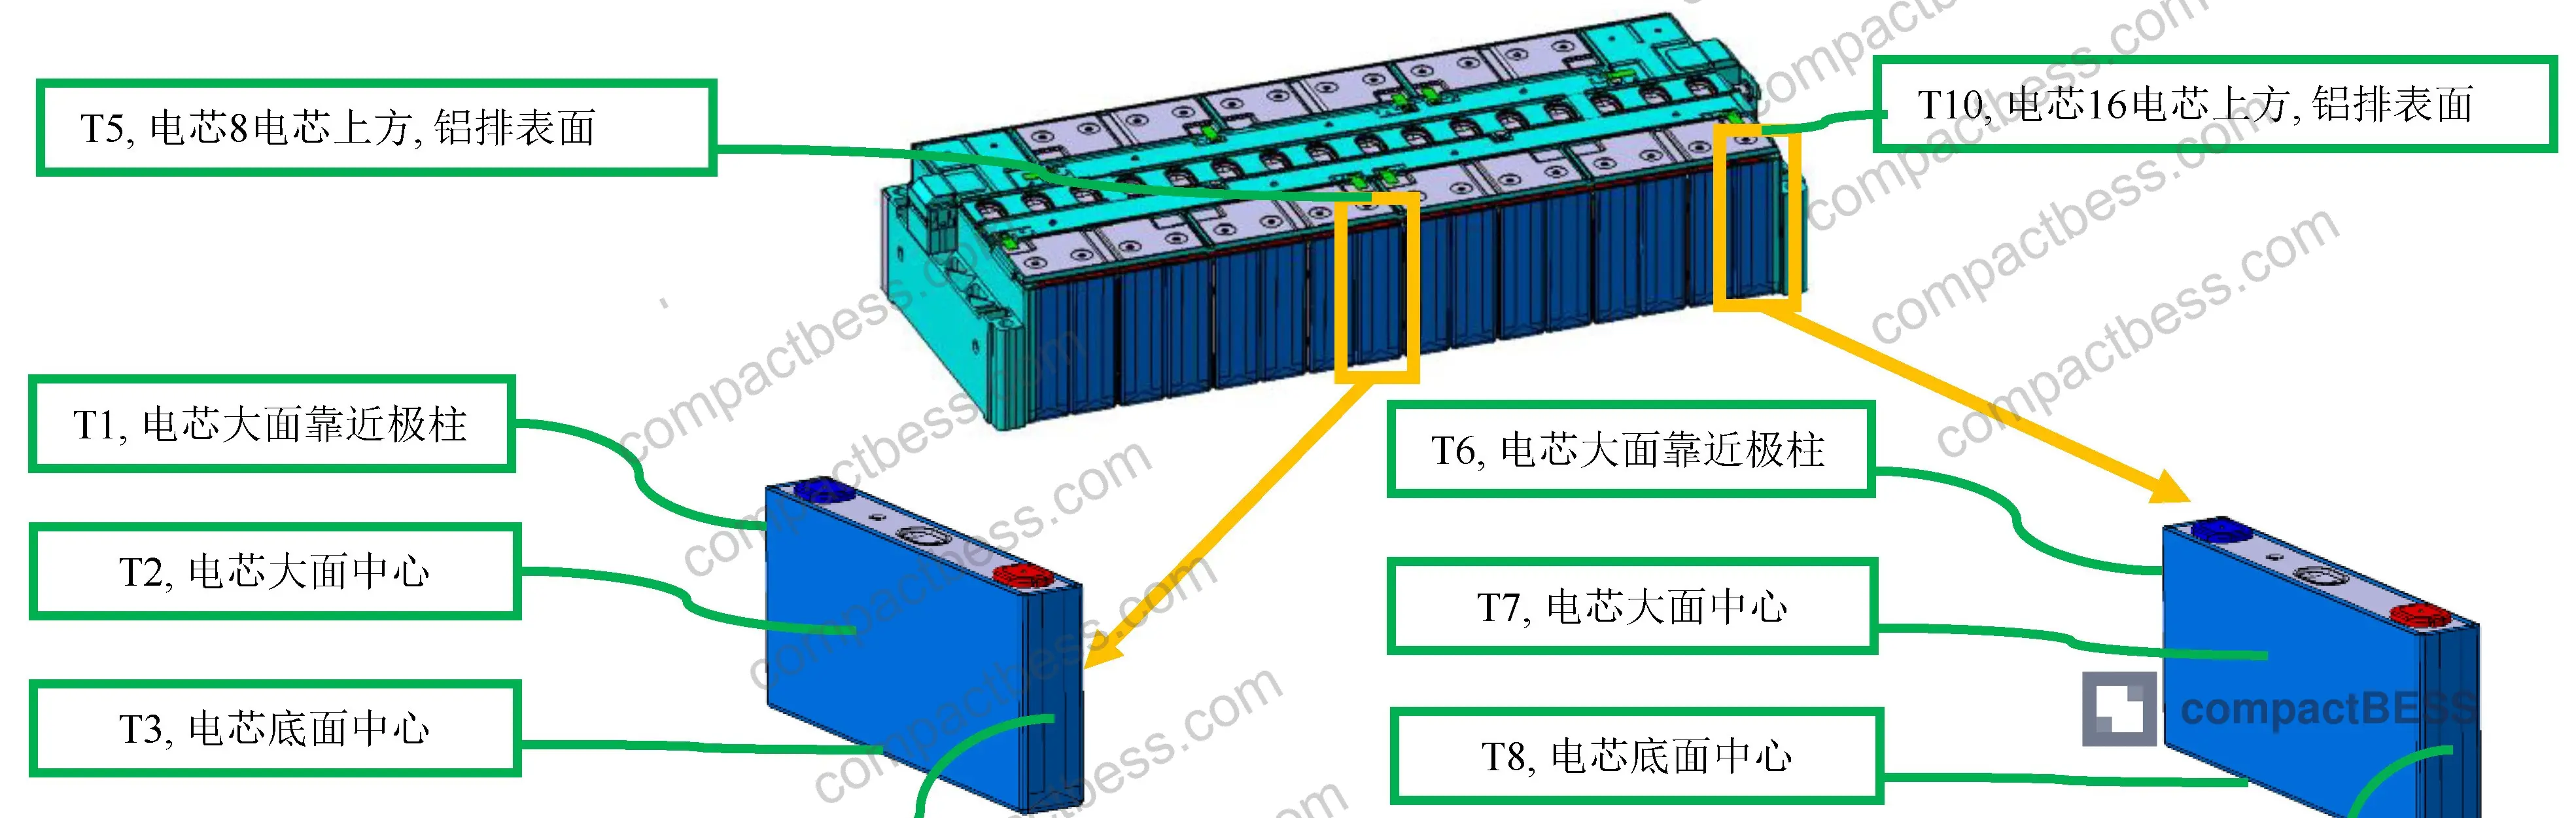
The reason busbar mounting outperforms direct cell-surface mounting as a long-term engineering solution comes down to the “breathing effect” — prismatic and cylindrical cells expand during charge and contract during discharge. This dimensional cycling is not trivial. Over thousands of cycles, a sensor bonded to the cell surface will inevitably be compressed by adjacent cells, module side plates, or end plates. In production modules with tight cell-to-cell spacing, that mechanical stress destroys the sensor bond and introduces measurement drift or complete sensor failure.
The busbar location, by contrast, has available surface area, is structurally stable relative to cell expansion, and is not subject to the same compressive forces. The thermal coupling is sufficient: heat generated at the cell tabs conducts into the busbar rapidly enough that the busbar surface temperature tracks cell temperature within the acceptable BMS window.
Format-specific placement rules confirmed by this dataset:
| Cell Format | Recommended Sensor Location | Maximum Cell-to-Sensor ΔT | Notes |
|---|---|---|---|
| Prismatic (square shell) | High-voltage aluminum busbar | 2.7 °C (drive durability, 0 °C) | Cell swelling destroys surface-mounted sensors long-term |
| Cylindrical | High-voltage aluminum busbar | 2.7 °C (comparable) | Same breathing-effect damage mechanism applies |
| Pouch (soft pack) | Cell body surface | <2 °C (typical) | Soft casing conforms under compression; sensor survives |
| Any format, high-current | Busbar near cell tab | ≤2.7 °C | Busbar temp transiently exceeds cell body under 2C+ discharge |
The pouch cell exception is worth emphasizing: soft-pack cells have flexible casings that deform rather than rigidly compressing the sensor. The sensor can be mounted directly on the cell body without long-term damage risk, and direct surface mounting gives marginally better thermal fidelity than busbar mounting in low-current applications.
Honestly, most procurement teams over-specify sensor count and under-specify sensor placement. Two well-positioned busbar sensors per module will outperform five poorly-positioned cell-surface sensors that have degraded after 500 cycles. That distinction does not show up in a typical BMS datasheet — you have to ask for it specifically.
Thermal Behavior Across Duty Cycles: Key Data Points for Specification Writers #
The test program covered three operating profiles relevant to production EV applications: fast charge / 0.33C discharge, drive durability, and comprehensive durability. Each was run at both 25 °C and 0 °C ambient, with data sampled at 1–2 second intervals.

Fast charge / 0.33C discharge (25 °C ambient):
- Cell 8 max temperature: 33.2 °C (T2, near tab)
- Cell 16 max temperature: 32.1 °C (T7)
- Maximum cell-to-busbar ΔT across all points: <2 °C
- Temperature pattern: rise → plateau → secondary rise, driven by polarization resistance behavior at low and high SOC states
Fast charge / 0.33C discharge (0 °C ambient):
- Cell 8 max temperature: 10.7 °C (T2)
- Cell 16 max temperature: 9.3 °C (T7)
- At 0 °C, the plateau phase is less pronounced — lower ambient temperature increases the temperature gradient between module and environment, enhancing convective and conductive heat dissipation, which flattens the mid-cycle temperature curve
Drive durability (0 °C ambient, most demanding condition):
- This cycle involves intermittent 2C high-current charge/discharge pulses
- Busbar temperature (T5) peaked at 15.7 °C vs. cell body T2 peak of 15.0 °C — busbar ran slightly hotter than cell body
- Maximum T4–T9 differential: 2.7 °C (these points are on the bottom cell surface and against the module aluminum side plate respectively, which have different convective exposure)
- This 2.7 °C figure is the worst-case measurement across the entire test program
Comprehensive durability (0 °C ambient):
- Average current consistently at or below 0.33C — similar behavior to slow discharge
- Maximum cell-to-busbar ΔT: <2 °C across all collection points
- Starting temperatures in this condition ranged from −1.2 °C to −0.9 °C, confirming the experiment was conducted at genuine cold-temperature conditions
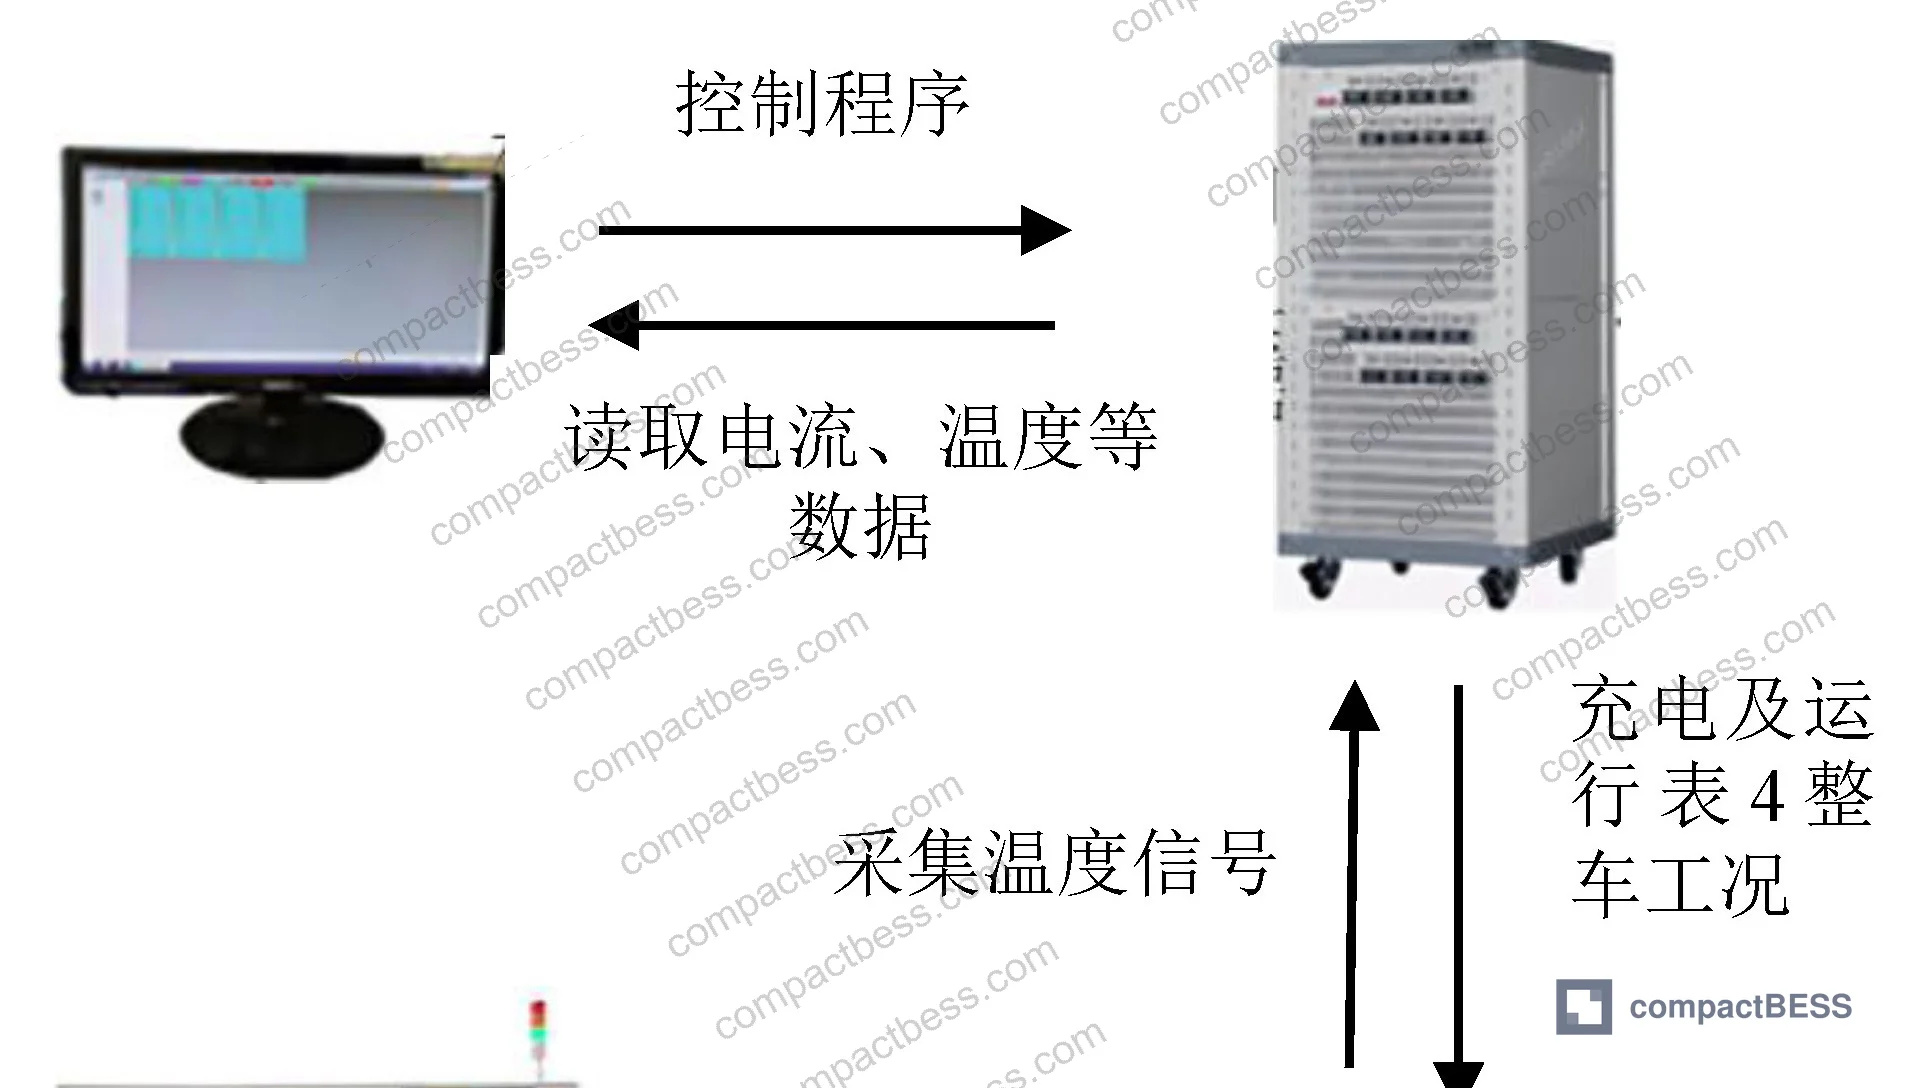
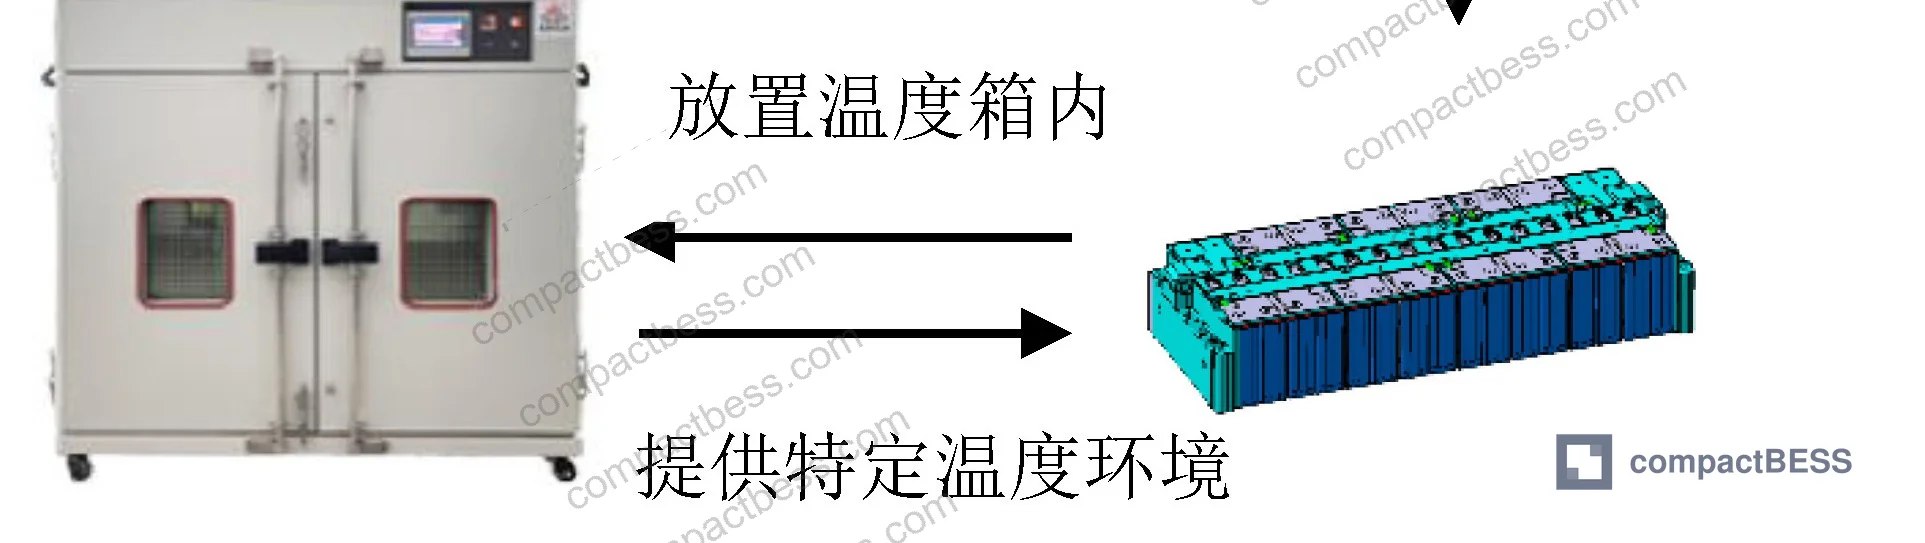
The test chamber maintained temperature uniformity of ±2 °C with fluctuation held to ±0.5 °C. The power test cabinet provided voltage range 8–100 V and current range −1,200 to +1,200 A, covering the full demand envelope for the 2P8S module.
The uncertainty analysis is worth reviewing before you accept a supplier’s sensor accuracy claims. The study computed total measurement uncertainty (combining sensor repeatability and instrument error) as uc = 1.57 °C — derived from a worst-case standard deviation of ±0.4 °C under 0 °C drive durability conditions combined with the sensor’s ±1 °C accuracy in the −20 °C to 65 °C range. This 1.57 °C total uncertainty fits comfortably within the ≤5 °C BMS production requirement, providing roughly 3.4 °C of remaining margin.
In supplier qualification, we have seen modules where the stated BMS temperature accuracy was ±2 °C but no uncertainty budget had been compiled — meaning no one had verified that sensor positioning, wiring, and ADC resolution combined to stay within spec. When the modules went into thermal cycling testing, three of six samples showed temperature readings drifting beyond the 5 °C threshold within 200 cycles, triggered by sensor bond degradation on cell surfaces. That failure mode is entirely avoidable with busbar placement, but it requires the supplier to have thought through the problem rather than just meeting a datasheet spec.
Most procurement teams don’t realize that BMS temperature acquisition requirements vary significantly between cell-to-pack (CTP) and cell-to-chassis (CTC) architectures. In CTP and CTC formats, the traditional module structure is eliminated — meaning the busbar geometry, thermal paths, and sensor access points all change. The placement conclusions from conventional module testing need to be re-validated for those architectures, and very few suppliers have done that work systematically. Require evidence, not assertions.
For compliance context, battery systems in most markets must comply with IEC 62619:2022 Safety requirements for secondary lithium cells and batteries, which includes temperature monitoring requirements as part of the safety management function. Temperature sensor placement that introduces >5 °C systematic error could compromise BMS protective function under that standard. For portable and stationary applications, IEC 61960-3 Secondary lithium cells and batteries for portable applications and IEEE 2030.2.1 Guide for Design, Operation, and Maintenance of Battery Energy Storage Systems both address temperature monitoring as a core operational parameter.
Practical Guidance for Buyers #
If you are sourcing battery modules or packs and the BMS temperature architecture is part of your technical review, the first question to ask is not “how many temperature sensors?” but “where are they mounted, and what is your justification?”
For prismatic and cylindrical cell formats, busbar placement is defensible engineering — but the supplier must be able to demonstrate that the busbar-to-cell temperature delta stays within your required tolerance across the full operating current range, including peak discharge. The ≤5 °C BMS threshold used in Chinese EV production is a reasonable benchmark; some applications will require tighter margins.
For pouch cell assemblies, direct cell-surface mounting is appropriate and will give better thermal fidelity, but require confirmation that the sensor attachment method has been validated through charge-discharge cycling to your target cycle life — adhesive delamination is a real failure mode.
At compactbess.com, our team connects global OEM buyers and product development engineers with verified Chinese manufacturers of battery modules and BMS-integrated packs across North America, Europe, and other key markets — if you need a supplier that can produce validated temperature acquisition documentation and uncertainty budgets for their modules, our sourcing team can narrow the field quickly. Temperature management ties directly into SOH & RUL Prediction as well — buyers integrating these modules into long-service-life applications should ensure their BMS thermal data quality meets predictive maintenance requirements from day one.
Need help identifying qualified suppliers for BMS-integrated prismatic cell modules with validated temperature acquisition? Talk to our sourcing team →
Supplier Qualification Questions #
- For prismatic cell modules, can you provide temperature deviation data between busbar-mounted sensors and cell body sensors under a sustained 2C discharge profile at 0 °C ambient, with maximum ΔT documented across at least three module positions?
- What is your total temperature measurement uncertainty budget (combining sensor accuracy, ADC resolution, and positional repeatability), and can you confirm the combined uc value is below 2 °C in the −20 °C to 65 °C operating range?
- Has your temperature sensor placement been validated through mechanical cycling that simulates cell breathing effect — specifically, can you show sensor bond integrity data after 500+ charge-discharge cycles for the cell format and module geometry you supply?
- For your aluminum busbar specification, what alloy series and cross-sectional dimensions are used, and has the busbar thermal conductivity been characterized to confirm its role as a temperature transfer medium between cell tabs and sensor mounting surface?
- If your module is intended for CTP or CTC integration, have temperature sensor placement positions been re-validated for the new pack architecture, and do you have experimental data showing busbar-to-cell ΔT ≤5 °C under the drive durability current profile in that configuration?
Sourcing Checklist #
- ☐ Supplier documents maximum cell-to-busbar temperature deviation ≤5 °C under worst-case duty cycle (drive durability at 0 °C ambient), matching the BMS production requirement
- ☐ Temperature sensor accuracy specification confirmed as ±1 °C in the −20 °C to 65 °C range (or better), with ±2 °C stated for the −40 °C to −20 °C and 65 °C to 125 °C ranges
- ☐ Total measurement uncertainty budget uc ≤2 °C provided, accounting for sensor repeatability and instrument error per the uncertainty propagation method used in the validation test
- ☐ Sensor placement validated for the specific cell format supplied: busbar-mounted for prismatic/cylindrical cells, surface-mounted for pouch cells, with mechanical cycling validation records available
- ☐ Busbar material specification documented as 1060-O series aluminum or equivalent, with cross-section ≥1.5 mm × 55 mm (or equivalent current-carrying capacity), verified to handle 1.1× peak module current
- ☐ Module-level temperature uniformity data available for both 25 °C and ≤0 °C ambient operating conditions, including test reports showing sensor readings from at least two representative cell positions (center module and end-of-module)
- ☐ Compliance with IEC 62619:2022 temperature monitoring requirements confirmed, with test report or certification available for review
- ☐ For modules targeting cell-to-pack (CTP) or cell-to-chassis (CTC) applications, supplier can provide updated temperature acquisition validation data specific to the new pack architecture
Key Specifications Table #
| Parameter | Recommended Value | Verification Method |
|---|---|---|
| Maximum cell-to-busbar temperature deviation | ≤5 °C (BMS production requirement); ≤2.7 °C demonstrated worst-case | Thermal logging at 10 collection points under drive durability at 0 °C ambient; 1 s data interval |
| Total temperature measurement uncertainty (uc) | ≤2 °C combined (sensor + instrument) | Uncertainty analysis per propagation formula combining standard deviation of repeated measurements with sensor accuracy |
| Temperature sensor accuracy (operating range) | ±1 °C from −20 °C to 65 °C; ±2 °C from −40 °C to −20 °C and 65 °C to 125 °C | NTC thermistor calibration; SEMI TEC 103KT1608T-1P or equivalent specification sheet |
| Aluminum busbar cross-section | ≥1.5 mm × 55 mm (for module peak current up to 1.1× rated) | Dimensional measurement; current-carrying capacity calculation at 1C and peak discharge |
| Cell operating temperature range | −30 °C to 55 °C discharge; −20 °C to 55 °C charge | Thermal chamber testing at boundary conditions with BMS protection cutoff validation |
| Temperature data acquisition interval | ≤2 s for slow charge/discharge; ≤1 s for dynamic drive profiles | BMS log file verification showing timestamped temperature records at specified intervals |
Can’t find a supplier meeting these specs? Submit your requirements and we’ll match you within 48 hours.
References #
Data source: Temperature Acquisition Optimization for Lithium-Ion Battery Modules in Automotive Applications: Sensor Placement Evaluation Across Cell Formats and Duty Cycles, K.-X. Liu et al., Journal of the Electrochemical Society, 2023
Frequently Asked Questions #
Why is aluminum busbar mounting better than direct cell-surface mounting for prismatic cells?
Prismatic cells expand and contract with each charge-discharge cycle — a phenomenon called the breathing effect. Over hundreds of cycles, sensors bonded to the cell body get progressively compressed by adjacent cells or module plates, leading to adhesive failure, bond delamination, and eventually measurement drift or total sensor loss. The aluminum busbar surface is mechanically stable, has space for sensor placement, and maintains thermal coupling to the cell tabs close enough that the measured temperature stays within the ≤5 °C BMS accuracy threshold — the worst-case deviation measured in this test program was 2.7 °C.
Does the same busbar placement rule apply to pouch cells?
No. Pouch cells have flexible casings that deform under compression rather than rigidly crushing the sensor. The soft packaging conforms around the sensor rather than shearing it, which means surface mounting on the cell body is mechanically viable long-term. Direct cell-surface mounting also gives marginally better thermal accuracy for pouch cells since there is no busbar intermediary in the thermal path. This is one area where a single universal placement rule will get you in trouble — format matters.
What is the worst operating condition for temperature measurement accuracy?
Based on this test program, the highest cell-to-sensor deviation occurred during drive durability testing at 0 °C ambient — a condition involving intermittent 2C high-current charge and discharge pulses. Under those conditions, the busbar temperature transiently exceeded the cell body temperature by up to 2.7 °C, because the busbar responds faster to large current spikes via Joule heating than the cell body does. At 25 °C ambient or under lower-current conditions, deviations were consistently below 2 °C. For specification purposes, use the 0 °C high-current case as your worst-case design point.
How many temperature sensors are needed per module?
Honestly, fewer well-placed sensors outperform many poorly placed ones. The engineering standard for production BMS is typically two sensor positions per module — one at the thermally worst-case location (module center, surrounded by cells with poor dissipation) and one at a location with better thermal coupling to the environment (module end, near the aluminum end plate). What matters is that both positions are validated across your full operating current envelope, not just at rated current. The SOC Estimation Methods and state-of-health algorithms in your BMS are only as good as the temperature data feeding them.
Does this test methodology apply to cell-to-pack or cell-to-chassis battery architectures?
The test was conducted in an explosion-proof temperature chamber with geometry comparable to a conventional liquid-cooled battery pack — small enclosed volume, no forced convection, primary heat transfer via solid conduction. The researchers conclude the results transfer well to production pack environments for that reason. However, CTP and CTC architectures eliminate the conventional module layer, which changes busbar geometry, thermal paths, and available sensor mounting surfaces. The conclusions provide directional guidance for those architectures but do not substitute for format-specific validation. Require your CTP or CTC module supplier to show you their own placement validation data.
Published by compactbess.com Technical Team | Request a sourcing quote


