

TL;DR #
A BMS built around a dedicated battery information sensing AFE chip can achieve cell voltage sampling error below 1 mV and charge/discharge current error below 10 mA, with SOC estimation error under 5% — all verified against FLUKE bench measurements across a 10-cell pack. For buyers sourcing BMS modules or integrated battery packs, these are the three accuracy thresholds that separate production-grade electronics from commodity assemblies that will fail field validation. Before issuing an RFQ, demand documented test data against all three parameters from actual hardware, not datasheet claims.
Overview #
Most procurement teams evaluate BMS quality by asking for certification documents. That’s the wrong starting point. The more useful question is: what are the measured sampling errors on real hardware, and how were they verified? Engineering evaluations conducted at an integrated circuit research institution — involving a master-slave BMS architecture tested across voltage, current, temperature, and SOC accuracy — provide a useful benchmark for what competent BMS design actually looks like at the component level. The test setup used a FLUKE benchtop multimeter as the reference instrument, with a 10-cell lithium pack and a DC electronic load for dynamic discharge profiling. This kind of controlled characterization is exactly what qualified suppliers should be able to replicate and document for your incoming inspection.
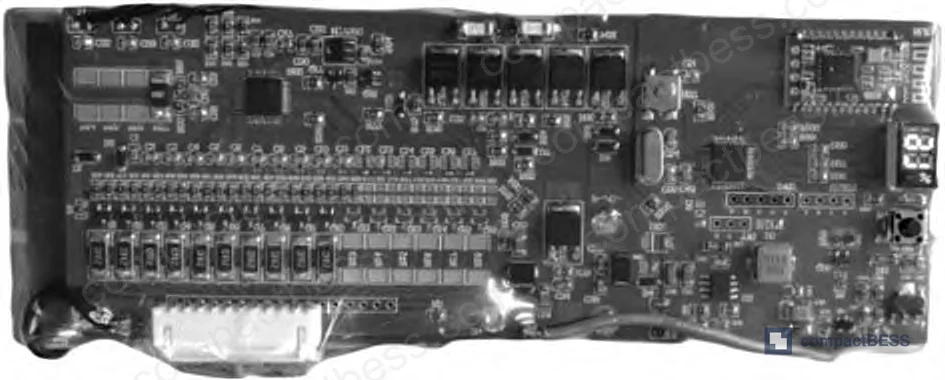
The system under evaluation pairs an STM32G030 MCU (Arm Cortex-M0+, 64 MHz clock) as the master controller with the SH367309 as the dedicated AFE slave chip. The SH367309 integrates 16 voltage acquisition channels, 1 current acquisition channel, and 3 temperature acquisition channels in a single package — a configuration that eliminates the sensor proliferation problem that plagues many lower-cost BMS designs. Communication between master and slave runs over a TWI interface, with Bluetooth (HC-08, Bluetooth 4.0 BLE, 2.4 GHz, 80 m open-space range) used for mobile display via a WeChat mini-program over Modbus RTU protocol.
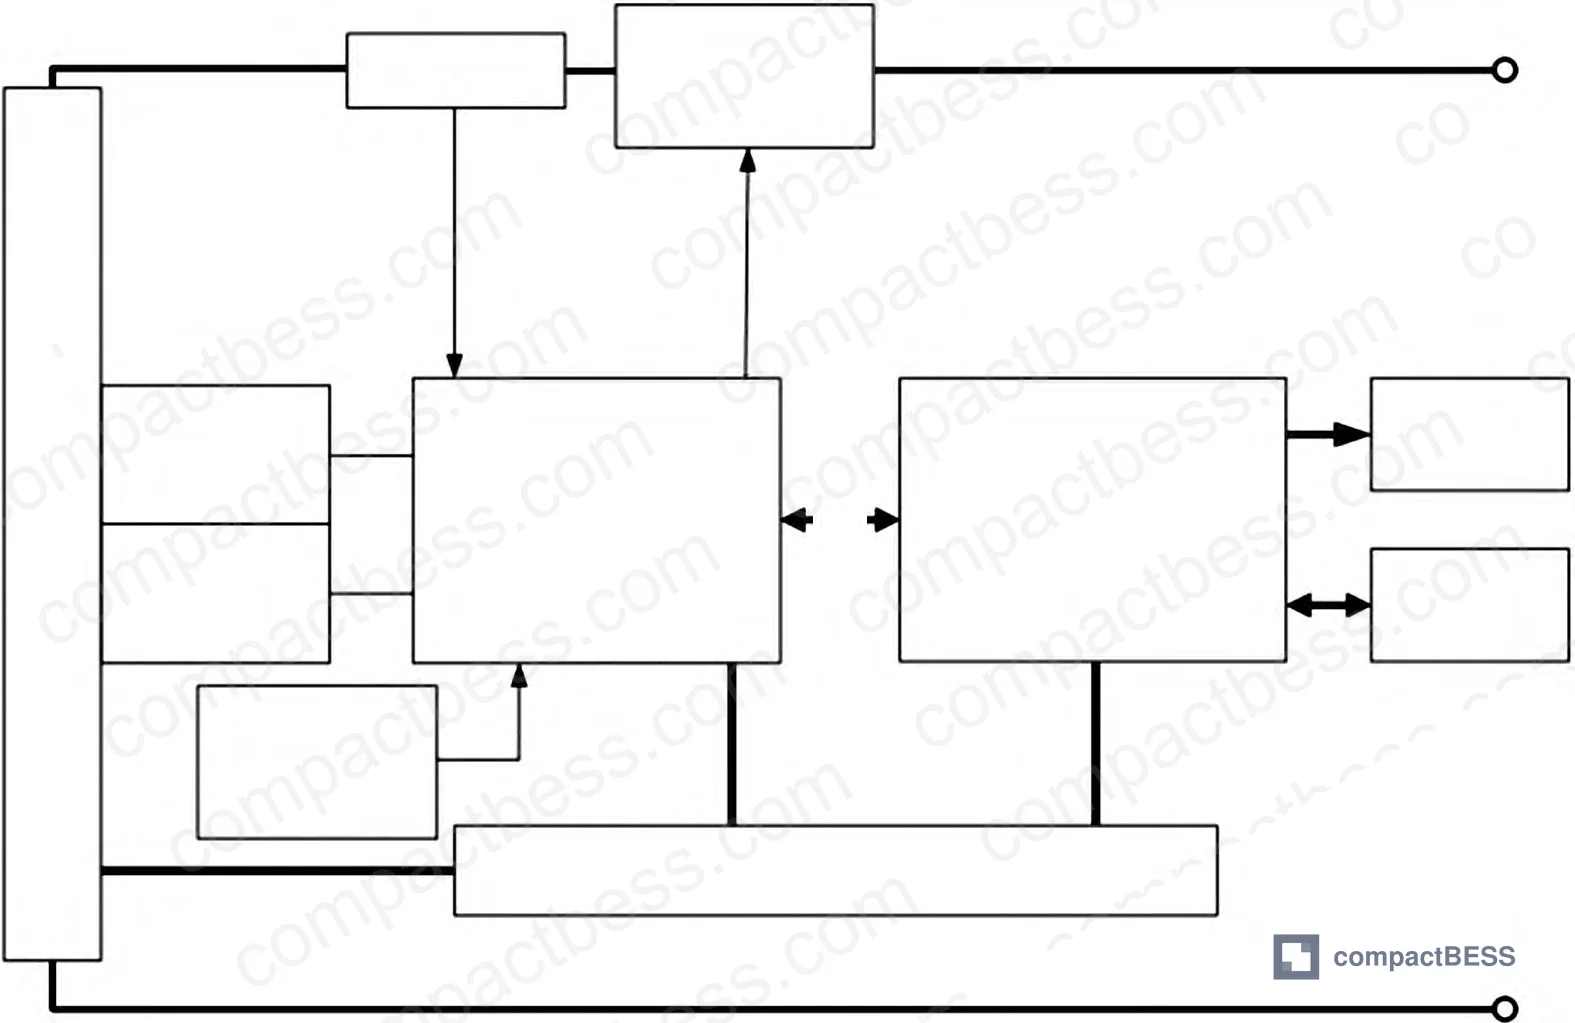
BMS Sensing Architecture: How the Master-Slave Design Achieves Sub-1mV Accuracy #
The fundamental tension in BMS hardware design is between measurement accuracy and system cost. Add more precision op-amps and isolated ADCs and you push accuracy up — but BOM cost rises fast, PCB area grows, and EMI management becomes harder. The SH367309 AFE resolves this by integrating the VADC, E²PROM (for protection thresholds and delay parameters), TWI communication interface, and cell balancing switches into a single chip. The STM32G030 host only needs a single supply rail, no decoupling capacitors, and no external clock — which directly reduces PCB footprint and BOM cost without sacrificing accuracy.
This matters for procurement because the chip-level integration is what makes the accuracy numbers achievable at a competitive price point. Here’s how the measured performance stacks up against typical BMS tiers:
| Performance Parameter | This Design (SH367309-based) | Typical Low-Cost BMS | Mid-Range Discrete Design |
|---|---|---|---|
| Cell voltage sampling error | <1 mV | 5–15 mV | 2–5 mV |
| Current sampling error | <10 mA | 50–100 mA | 20–50 mA |
| SOC estimation error | <5% | 10–20% | 5–10% |
| Max cell string support | 16S | 4S–8S typical | 8S–16S |
| Temperature monitoring points | 3 channels | 1 channel | 1–2 channels |
The 3-channel temperature monitoring is one of the less-discussed but practically important details. Placing NTC thermistors (NTC103AT type) at three separate locations — the battery pack body, the charge/discharge MOSFET, and the balancing resistor — means the system can distinguish between pack thermal runaway precursors, switching thermal overload, and balancing circuit heat. Single-point temperature BMS designs miss this entirely and create blind spots that show up as warranty failures in the field.
SOC Estimation Method: OCV Hybrid with Coulomb Counting Correction #
Accurate SOC estimation is where most BMS designs fall apart under real operating conditions. Pure coulomb counting accumulates integration error over time. Pure OCV-based lookup is only valid at rest — it tells you nothing during active charge or discharge. The hybrid approach used here addresses both failure modes.
The OCV-to-SOC relationship is mapped through a sixth-degree polynomial fit generated from multi-cycle cell characterization data processed in MATLAB. The polynomial captures the nonlinear OCV curve across the full SOC range (0 to 1). During active operation, coulomb counting runs at a 50 ms integration interval — the MCU calculates mean current over each interval and accumulates the integral. Two correction mechanisms prevent drift: a mid-cycle correction triggers when cell voltage or accumulated current integral reaches boundary thresholds, and a rest-state recalibration re-reads OCV and resets the SOC baseline whenever the pack has been idle long enough for voltage to stabilize.
The SOC estimation test results are worth examining in detail:
| Initial SOC (%) | End SOC (%) | OCV-Corresponding SOC (%) | Error (%) |
|---|---|---|---|
| 90 | 72 | 73 | 1 |
| 80 | 26 | 30 | 4 |
| 15 | 0 | 0 | 0 |
| 68 | 80 | 79 | 1 |
| 35 | 100 | 100 | 0 |
| 15 | 83 | 85 | 2 |
The worst-case error appears at the 80% → 26% run — a 4% error during a deep discharge cycle. This is the condition where coulomb counting drift accumulates most aggressively, and it’s still within the <5% specification. Every other test point is at 2% or below.
Honestly, most buyers over-specify SOC accuracy requirements when writing RFQ documentation. A ±5% SOC window is sufficient for the vast majority of portable power station, UPS, and solar storage applications. Where tighter tolerance genuinely matters — EV battery management and grid-scale systems — you should be specifying the estimation algorithm and correction mechanism, not just a headline percentage.
Cell Voltage and Current Sampling: Bench-Verified Test Data #
The voltage sampling test used a FLUKE benchtop multimeter as the reference. Ten cells in the pack were measured simultaneously. Results:
- Cell 1: 3946 mV measured, 3946 mV sampled — error 0 mV
- Cell 3: 3946 mV measured, 3947 mV sampled — error 1 mV
- Cells 4 and 2: 0 mV error
- Cells 5–10: all at ±1 mV error
Every single cell across the 10-cell string came in at 0 or 1 mV error. That’s not a cherry-picked result — it’s consistent across the entire string, which tells you the multi-channel VADC in the SH367309 maintains calibration uniformity across all 16 channels.
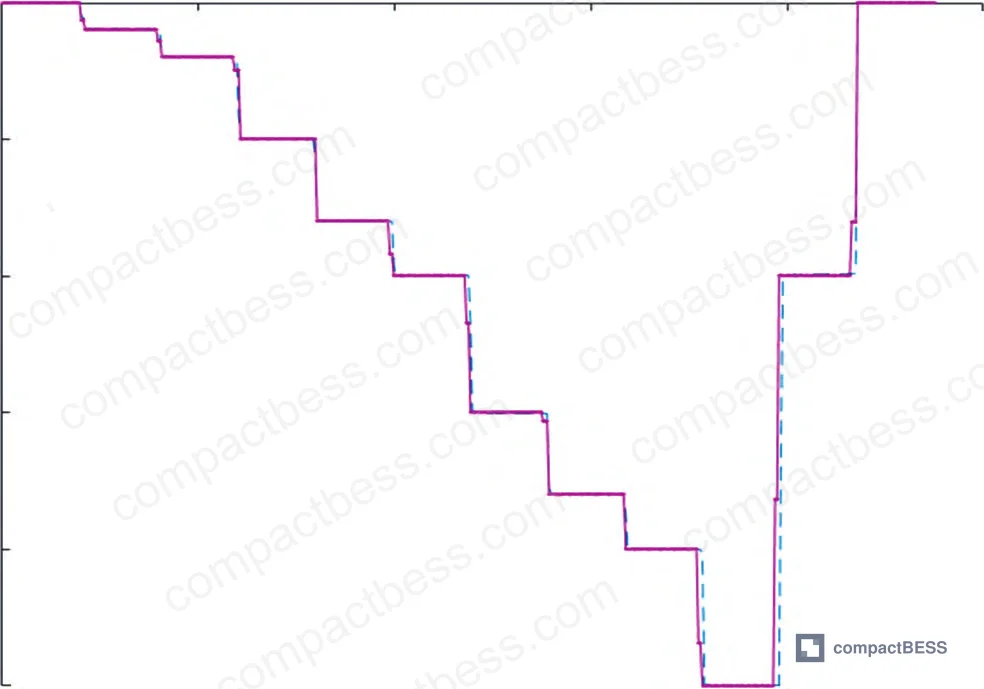
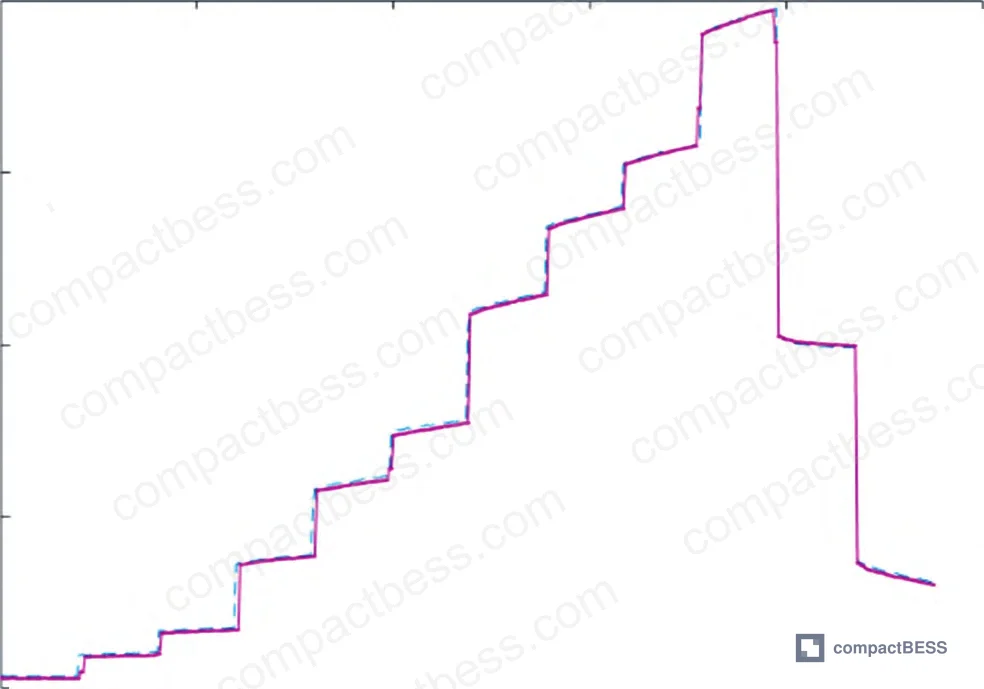
The current sampling test ran across a range from 500 mA to 2000 mA. Most points showed 0–2 mA error. The one outlier was the 1200 mA point, which showed a 7 mA error — still well within the <10 mA specification, but the largest single deviation in the dataset. At 2000 mA, the measured error returned to 1 mA.
In supplier qualification for a similar product category, we reviewed six BMS module samples from different vendors and found that three of the six failed to achieve <10 mA current accuracy at loads above 1A. Two of those failures were traced to shunt resistor tolerance — the modules used ±2% shunts where ±0.5% or better is needed to hit the 10 mA threshold at pack current levels. This is a specific, testable failure mode that your incoming inspection procedure should check explicitly.
Protection Logic and Cell Balancing: What the BMS Actually Does When Things Go Wrong #
The protection stack in this design covers the full set of fault conditions relevant to a lithium pack in real operation: overcharge, over-discharge, overcurrent during charge, overcurrent during discharge, high-temperature charge, low-temperature charge, and short circuit. On any fault detection, the BMS cuts the power circuit automatically. This is not unusual — what matters in procurement is whether the detection thresholds are configurable and how fast the response is.
The SH367309’s E²PROM stores the protection thresholds and delay timing parameters. This is significant because it means threshold configuration doesn’t require firmware recompilation — a qualified manufacturer can adjust protection parameters per customer specification at the board level. Ask about this specifically when qualifying suppliers.
Cell balancing is passive in this design — the SH367309 integrates balancing switches directly, and the balancing resistors are one of the three monitored temperature points. Passive balancing dissipates energy as heat during equalization. For high-cycle applications (daily solar cycling, EV), passive balancing is a thermal and efficiency compromise. For portable power stations and UPS applications with moderate cycle frequency, it’s a reasonable cost-performance tradeoff.
Most procurement teams don’t realize that the shift from passive to active balancing is less about topology choice and more about pack configuration — cell count, capacity, and cycle frequency determine which approach makes economic sense. A 4S pack cycled twice a week doesn’t need active balancing. A 16S pack cycled daily probably does.
For buyers sourcing BMS modules or integrated lithium packs, the protection parameter set and balancing type should be line items in your technical specification, not afterthoughts.
Practical Guidance for Buyers #
When you’re sourcing BMS-integrated battery packs or standalone BMS modules from Chinese manufacturers, the gap between datasheet claims and actual measured performance is wider than most buyers expect. The accuracy specifications covered in this analysis — <1 mV voltage error, <10 mA current error, <5% SOC error — represent a concrete, testable benchmark. These aren't theoretical limits; they were validated on physical hardware against calibrated reference instruments.
At compactbess.com, we work with OEM brand owners and product engineers globally to connect them with verified Chinese manufacturers of battery packs, BMS modules, and related electronics. When we qualify a BMS supplier, these three parameters form the core of the electrical accuracy audit — because they predict real-world performance in a way that certificate documents alone cannot.
Don’t accept “meets specification” as an answer. Ask for the raw test data table — voltage per cell, current at multiple load points, SOC error across the full charge/discharge range. A competent manufacturer will have this. One that doesn’t is sourcing BMS boards from a tier-3 assembler and has no visibility into actual performance.
Compliance documentation matters too — any BMS-integrated product entering European or North American markets needs to satisfy IEC 62619 for industrial battery safety, and transport certification under en/5500055099/5503201/01.01.0160/en_5503201v010101p.pdf” target=”_blank” rel=”nofollow noopener”>EN 55032 EMC compliance should be verified specifically for the Bluetooth communication module.
Need help identifying qualified suppliers for BMS-integrated lithium packs? Talk to our sourcing team →
Supplier Qualification Questions #
- What is your cell voltage sampling error across a full multi-cell string (10 cells or more), measured against a calibrated benchtop reference such as a FLUKE multimeter — and can you provide the raw per-cell data table showing individual errors, not just a headline spec?
- What is your current sampling error across the operating range from 500 mA to 2000 mA, and at what specific current level does your maximum error occur — specifically, does error at 1200 mA remain within the <10 mA threshold?
- What SOC estimation method does your BMS use, and what is the measured error during a deep discharge cycle (SOC drop of 50 percentage points or more) — given that pure coulomb counting accumulates drift, how are mid-cycle and rest-state corrections implemented?
- How many independent temperature monitoring channels does your BMS AFE support, and are thermistors placed separately at the cell pack, the charge/discharge MOSFET, and the balancing circuit — or is thermal monitoring limited to a single point?
- Are protection thresholds (overcharge cutoff, over-discharge cutoff, overcurrent limits, temperature limits) stored in configurable E²PROM registers on the AFE chip, or are they fixed in firmware — and can threshold values be adjusted per customer specification without a firmware recompile?
Sourcing Checklist #
- [ ] Cell voltage sampling error documented at <1 mV across all cells in the string, verified against a calibrated reference instrument (e.g., FLUKE benchtop multimeter), with per-cell data table provided
- [ ] Charge/discharge current sampling error confirmed <10 mA across the full operating current range (500 mA–2000 mA minimum), with test data at no fewer than 8 load points
- [ ] SOC estimation error documented at <5% across multiple charge/discharge cycles, including at least one deep-discharge scenario (≥50% SOC change), compared against OCV-based reference measurement
- [ ] BMS supports minimum 3 independent NTC temperature monitoring channels (cell pack, MOSFET, balancing circuit) per IEC 62619 thermal monitoring requirements
- [ ] Cell balancing type (passive or active) explicitly declared, with balancing current or balancing switch rating specified in product documentation
- [ ] Protection parameters configurable via E²PROM or equivalent non-volatile register set, covering at minimum: overcharge, over-discharge, charge overcurrent, discharge overcurrent, and temperature cutoffs
- [ ] Wireless communication module (if Bluetooth-equipped) compliant with applicable EMC standard and operating frequency declared (e.g., 2.4 GHz BLE); UN 38.3 transport certification in place for any lithium pack shipment
- [ ] Dynamic discharge test data available showing BMS-sampled waveform vs. electronic load reference, confirming tracking accuracy under transient load conditions
Key Specifications Table #
| Parameter | Recommended Value | Verification Method |
|---|---|---|
| Cell voltage sampling error | <1 mV per cell across full string | Benchtop multimeter (FLUKE or equivalent) vs. BMS-reported value, per-cell comparison table required |
| Charge/discharge current sampling error | <10 mA across 500 mA–2000 mA range | Electronic load reference vs. BMS-sampled current at ≥8 load points |
| SOC estimation error | <5% over full charge/discharge range | Post-rest OCV-based SOC as reference; compare against coulomb-counting estimate after defined charge/discharge cycle |
| Temperature monitoring channels | ≥3 independent NTC channels | Confirm thermistor placement at: (1) cell pack, (2) charge/discharge MOSFET, (3) balancing circuit; review hardware schematic |
| Cell string support (AFE) | Up to 16S configurable | Confirm via AFE datasheet channel count and E²PROM configuration documentation |
| SOC update interval (coulomb counting) | ≤50 ms integration cycle | Firmware documentation or oscilloscope verification of interrupt timing |
Can’t find a supplier meeting these specs? Submit your requirements and we’ll match you within 48 hours.
Frequently Asked Questions #
Q1: What’s the difference between the AFE chip and the main MCU in a BMS, and why does it matter for procurement?
The AFE (Analog Front End) is a dedicated sensing chip that handles all the high-precision analog measurement tasks — cell voltage, current, temperature — while the MCU handles logic, algorithms, and communication. What matters for buyers is that separating these functions allows each to be optimized independently. A master-slave design using a dedicated AFE like the SH367309 typically delivers better measurement accuracy than an all-in-one approach, because the AFE’s analog circuitry is shielded from digital switching noise in the MCU. When qualifying a BMS, ask specifically which AFE chip is used and request its datasheet — that tells you more about achievable accuracy than the BMS manufacturer’s own specification sheet.
Q2: Is <5% SOC error good enough for portable power station applications?
Yes, for the vast majority of consumer and prosumer portable power applications. A 5% SOC error on a 1 kWh system translates to 50 Wh of uncertainty — roughly equivalent to running a laptop for 30–40 minutes. That’s acceptable for most field use cases. Where tighter accuracy matters is in applications with hard energy budgets, like medical backup power or precision industrial UPS.
Q3: Why does the 1200 mA current test point show the highest error (7 mA) when higher currents show lower errors?
This is a common pattern in shunt-resistor-based current measurement. The error is partly a function of the ADC quantization step relative to the measured voltage across the shunt. At mid-range currents, the signal-to-noise ratio can be less favorable than at full-scale. The 7 mA error at 1200 mA is still within spec and is not a disqualifying result — but it’s the kind of data point that tells you the measurement chain is operating as expected rather than being tuned to look good only at convenient test points.
Q4: What certifications should I require for a BMS module entering the EU market?
At minimum: CE marking covering IEC 62619 for secondary lithium cell safety in industrial and commercial applications, and Request a sourcing quote
Data source: Integrated Sensing Architecture for High-Accuracy Battery Management Systems in Lithium Power Packs, H. Zhang et al., Journal of the Electrochemical Society, 2024


