

TL;DR #
Validated simulation data on a 1P52S semi-solid lithium pack shows that switching from bottom-only to bottom-plus-two-side liquid cooling reduces maximum cell temperature by 21.8% and improves pack-wide temperature uniformity by 68.1%. For buyers specifying large-format C&I energy storage packs, cooling layout is the single most consequential design variable — far more impactful than flow channel geometry. Before requesting any thermal management datasheet, ask suppliers specifically for global maximum temperature differential under their rated cooling configuration, not just the top-cover hot-spot figure.
Overview #
Most buyers evaluating C&I battery pack thermal management start by asking about coolant type or flow rate. That’s the wrong starting point. The variable that dominates pack longevity and safety isn’t what flows through the cooling plate — it’s where that cooling plate is positioned relative to the cell stack.
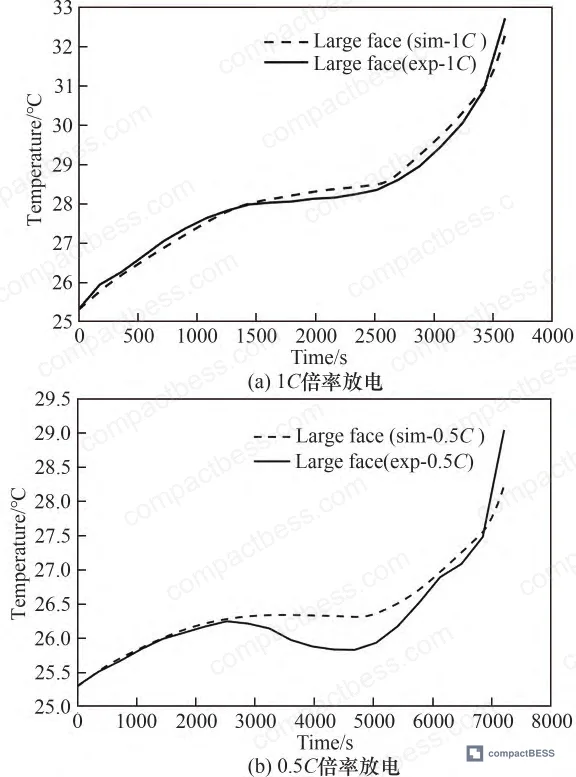
This analysis draws on calibrated numerical simulation work conducted by engineering teams at two Chinese new-energy technology companies, validating their model against physical discharge tests at both 0.5C and 1C rates before applying it to a 52-cell series production pack. The model’s maximum relative error was held to 2.9% at 0.5C conditions — within acceptable engineering simulation tolerance for thermal qualification purposes. Cell configurations tested used 280 Ah semi-solid lithium cells (173.8 mm × 71.6 mm × 207.2 mm, energy density ≥165 Wh/kg), connected in a 1P52S arrangement typical of rack-mount C&I storage modules.
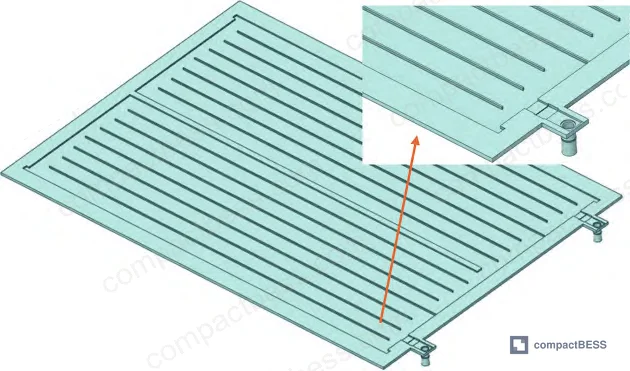
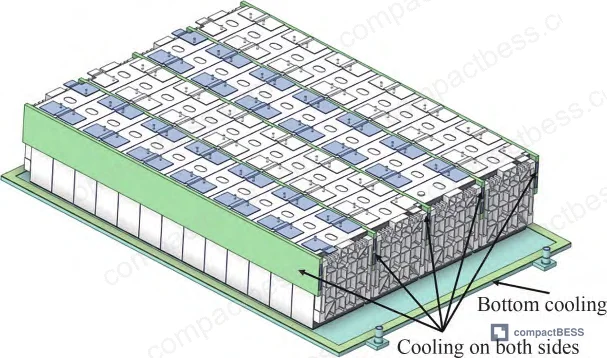
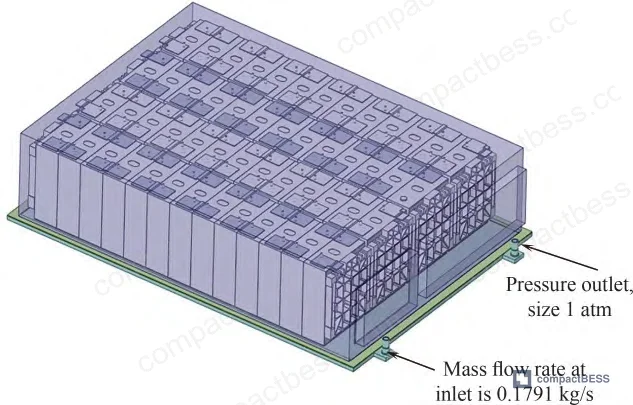
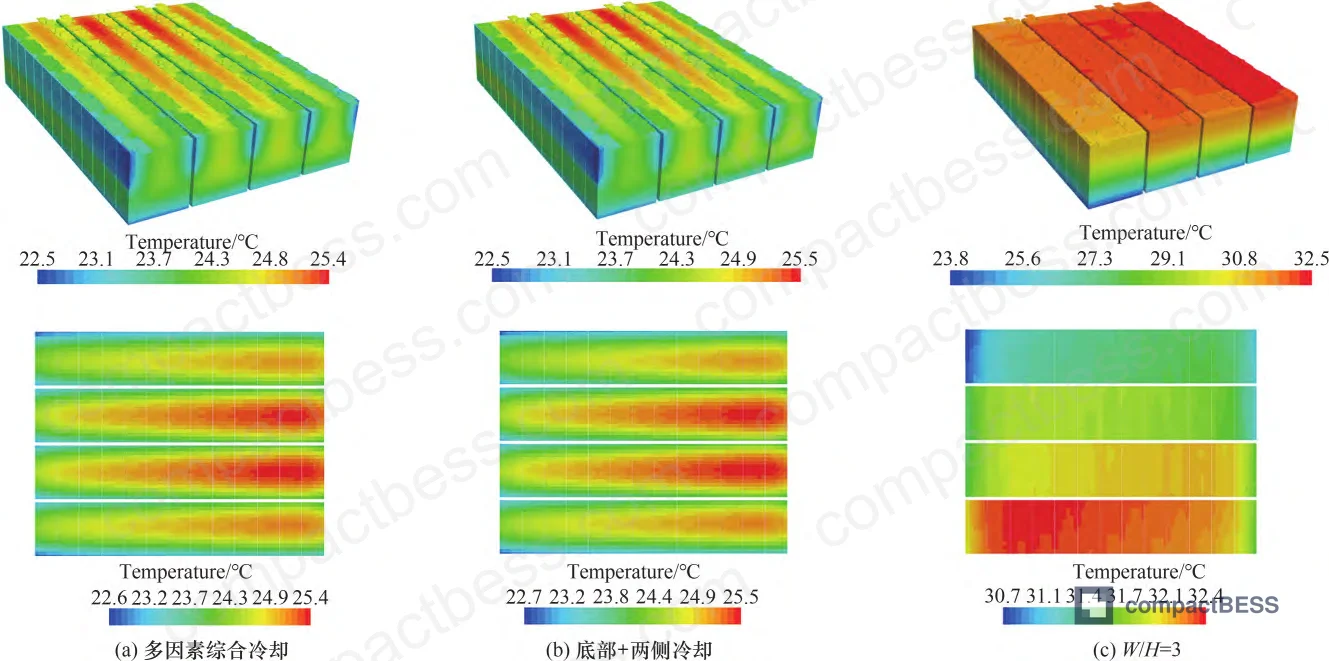
Three variables were isolated: flow channel aspect ratio (W/H = 7, 5, or 3 with fixed H = 6 mm), cooling plate layout (bottom-only vs. bottom-plus-two-sides), and inlet water flow rate (5.0 to 15.0 L/min in five steps). The findings are directly applicable to procurement decisions on large-format pack assemblies, liquid-cooled thermal management subsystems, and semi-solid or LFP cell packs intended for commercial and industrial deployment.
Liquid Cooling Plate Layout: The Cell Format Variable Buyers Consistently Underestimate #
Of the three factors studied, cooling plate layout produced results that should change how any serious buyer writes their thermal management specification.
Bottom-only cooling vs. bottom-plus-two-sides cooling — at identical 10 L/min flow rate:
| Metric | Bottom-Only Cooling | Bottom + Two-Side Cooling | Improvement |
|---|---|---|---|
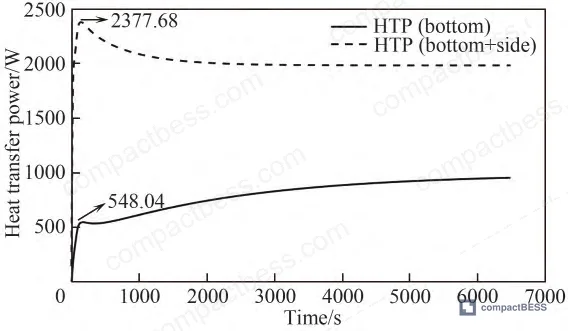
| Maximum cell temperature rise (at 6480 s) | 7.62 °C | 0.51 °C | 93.3% reduction |
| Global maximum temperature differential (pack-wide) | 8.80 °C | 3.0 °C | 65.9% improvement |
| Heat transfer power increase (within 200 s of discharge) | Baseline | +333.85% vs. baseline | — |
| Heat transfer power increase (end of discharge) | Baseline | +107.52% vs. baseline | — |
Those numbers are not marginal. A maximum temperature differential of 8.80 °C under bottom-only cooling directly violates the industry threshold of ≤5 °C inter-cell temperature difference — the point at which published research confirms capacity loss of 1.5% to 2% per cycle accumulation. By contrast, bottom-plus-two-side cooling brings the global temperature differential down to 3.0 °C, comfortably within the target range.
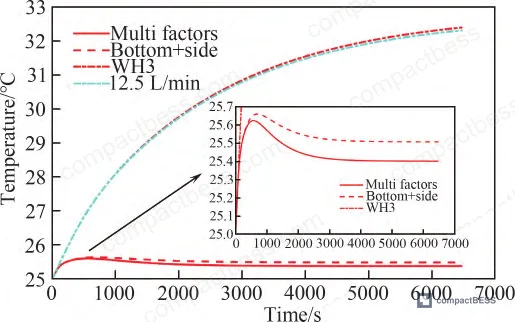
This is where single-factor multi-factor comparison becomes useful for procurement. When all three optimized parameters were combined (W/H = 3 channel geometry, bottom-plus-two-side layout, 12.5 L/min flow), the improvement over bottom-plus-two-side cooling alone was just 0.1 °C. The cooling plate layout alone is doing the heavy lifting. The other two variables are optimization, not transformation.
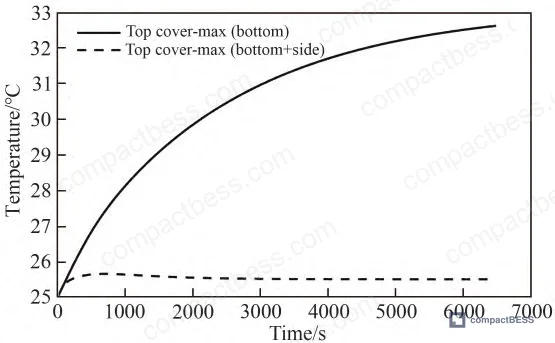
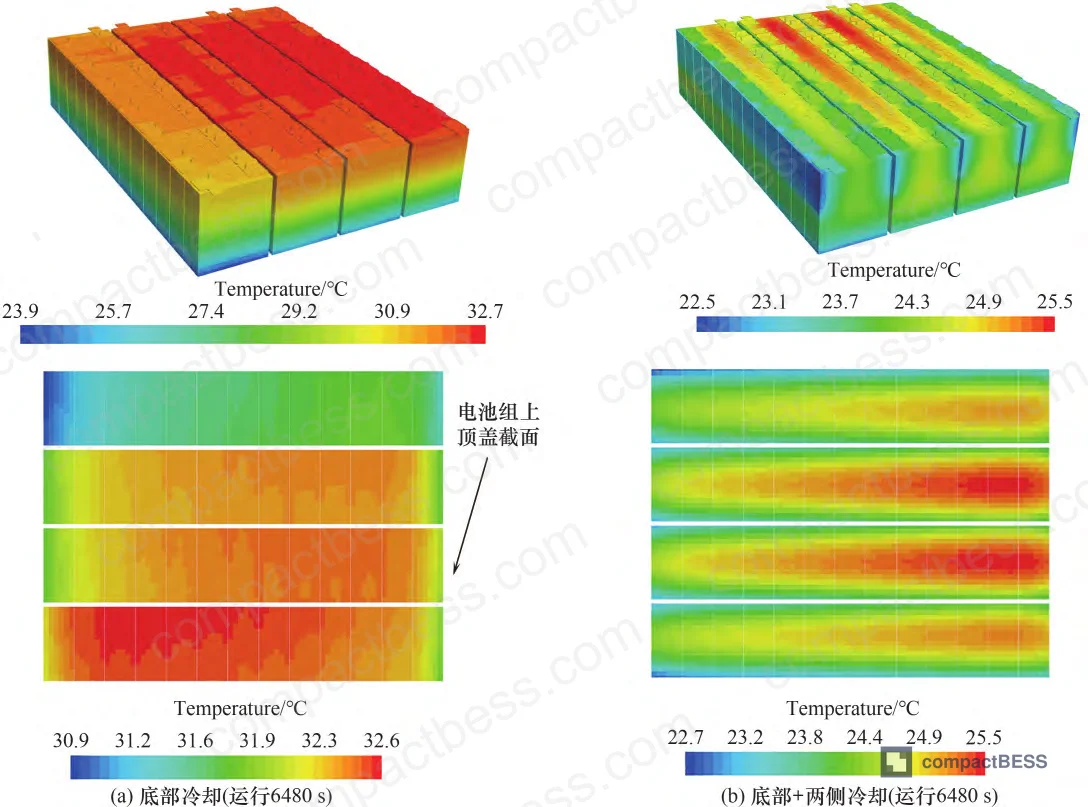
Honestly, most procurement teams don’t write cooling layout into their pack-level specifications at all. They specify inlet temperature, flow rate, and maybe maximum hot-spot temperature — and assume the supplier’s thermal design will handle the rest. That assumption is costing buyers in cycle life. The cell temperature gradient in the height direction under bottom-only cooling is severe enough that cells near the top of the stack age meaningfully faster than cells at the base. You’re building in a degradation mismatch from day one.
Flow Channel Geometry and Flow Rate: Where Spec Precision Actually Matters #
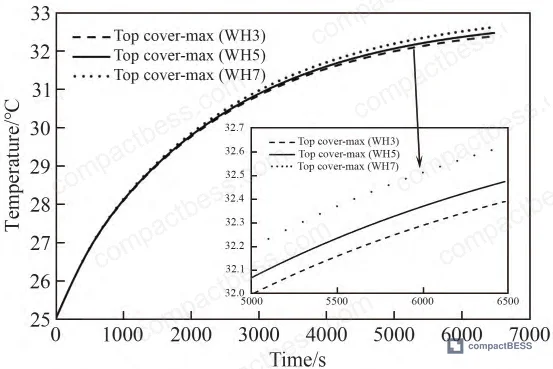
Flow channel aspect ratio (W/H) had minimal effect on cell temperature — the difference between W/H = 5 and W/H = 3 was only 0.20% at 6480 seconds of discharge, and W/H = 7 versus W/H = 5 was 0.46%. The mechanism is a compensating trade-off: narrower channels (lower W/H) reduce heat exchange surface area but increase coolant velocity, raising the convective heat transfer coefficient. These effects nearly cancel each other at the cell temperature level.
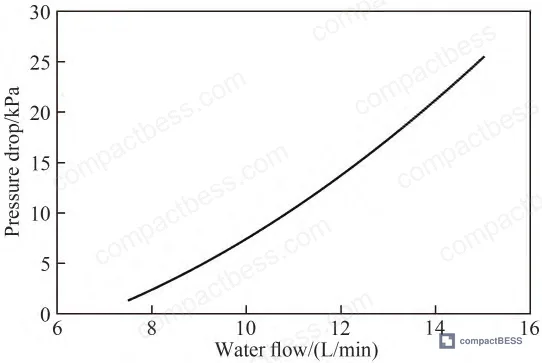
Where aspect ratio matters significantly is pressure drop and system energy consumption:
- W/H = 3 reduces pressure drop by up to 27.2% compared to W/H = 5
- W/H = 5 increases energy consumption by 37.3% compared to W/H = 3
- W/H = 7 increases energy consumption by only 6.7% compared to W/H = 5 — the gains flatten as W/H increases
This tells a clear story: specify W/H = 3 channel geometry not because it cools better (it barely does), but because it runs the pump subsystem significantly more efficiently over the system’s operational life. In a 10-year C&I deployment, that parasitic energy difference compounds.
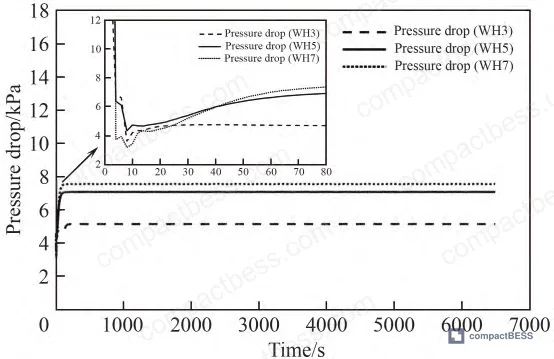
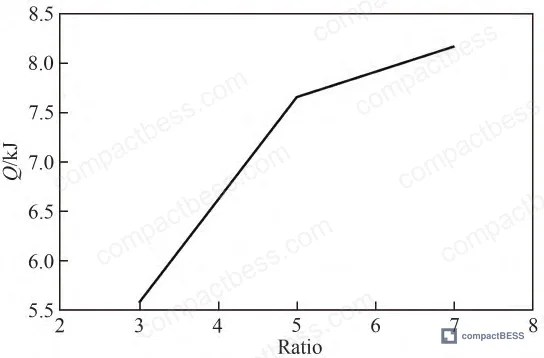
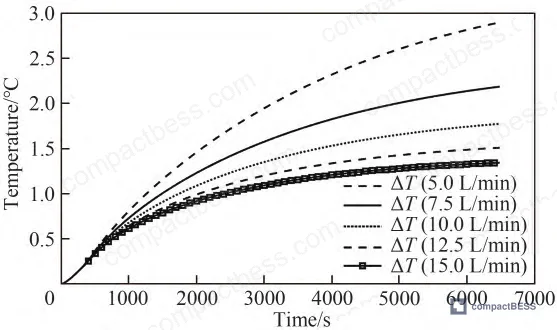
Flow rate optimization follows a diminishing returns curve that has a clear practical plateau. Testing covered five flow rates: 5.0, 7.5, 10.0, 12.5, and 15.0 L/min.
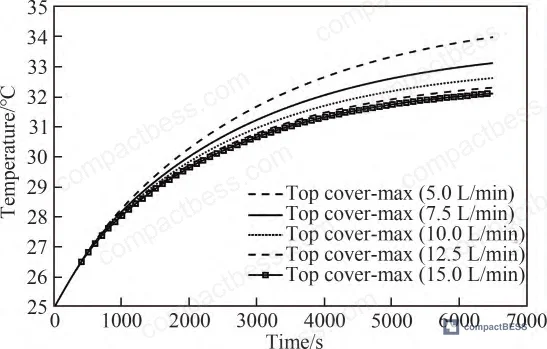
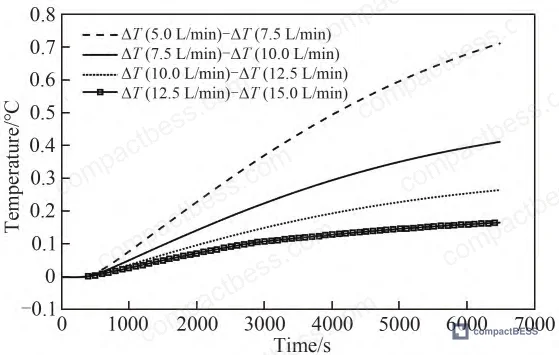
- Increasing from 5.0 to 12.5 L/min produces meaningful reductions in peak cell temperature
- Increasing from 12.5 to 15.0 L/min yields only 0.20 °C additional cooling at end of discharge
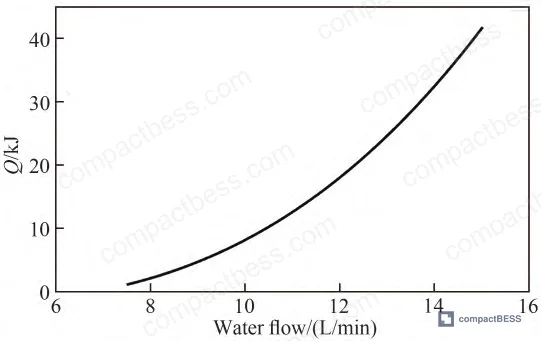
- Above 12.5 L/min, pressure drop and system energy consumption increase substantially with negligible thermal return
The optimal operating window is 10.0 to 12.5 L/min. Below 10 L/min, convective heat transfer is insufficient to maintain the target operating range of 20–35 °C under 0.5C continuous discharge. Above 12.5 L/min, you’re paying more pump energy for essentially the same thermal outcome.
Most procurement teams over-specify flow rate when they under-specify layout. A supplier running 15 L/min through a bottom-only cooling configuration will still deliver a pack with an 8+ °C temperature differential across the cell stack. More coolant doesn’t fix a geometry problem.
Semi-Solid Cell Format and Thermal Interface Specifications #
The cell used as the test reference in this evaluation is a large-format semi-solid lithium cell with specifications that are increasingly common in rack-mount C&I storage:
| Parameter | Value |
|---|---|
| Nominal capacity | 280 Ah |
| Cell dimensions (W × T × H) | 173.8 mm × 71.6 mm × 207.2 mm |
| Energy density | ≥165 Wh/kg |
| Mass per cell | 5.5 kg |
| DC internal resistance | 0.50 mΩ (10 s pulse, 25 °C, 25% SOC) |
| Nominal voltage | 3.65 V |
| Discharge cut-off voltage | 2.5 V |
| Cell-to-cooling-plate thermal interface | 2 mm silica thermal pad |
| End-plate insulation | 1 mm polycarbonate (PC) board |
The 2 mm silica thermal pad at the cell-to-plate interface is not a cosmetic detail. Contact thermal resistance at this joint is a primary variable in whether the modeled cooling performance translates to actual production hardware. Suppliers who substitute thinner or lower-conductivity thermal interface materials to cut BOM cost will degrade heat transfer exactly where it matters most.

Industry observation: most buyers — and even some engineers — treat thermal management spec sheets as secondary documentation, something to review after cell chemistry and BMS selection. In practice, the IEC 62619 safety standard for stationary lithium storage systems explicitly addresses cell temperature limits and temperature uniformity as part of the safety qualification criteria. A pack that routinely operates with a global temperature differential above 5 °C isn’t just aging faster — it may be operating outside the boundary conditions of its safety certification.
Practical Guidance for Buyers #
If you’re sourcing liquid-cooled large-format battery packs for C&I or grid-tied applications, the cooling plate layout question needs to be in your RFQ, not your factory audit checklist. Ask for it upfront. The data is clear that bottom-only cooling configurations — which remain common among cost-optimized Chinese pack manufacturers — cannot hold the global temperature differential below 5 °C at 10 L/min flow during a full 0.5C discharge. That 8.80 °C differential is a cycle-life liability.
For cells meeting the UN 38.3 transport certification and designed to operate within the IEC 62619 temperature envelope, verify that the thermal management system was validated with the actual cell format and pack configuration — not a scaled simulation using generic cell geometry. Thermal interface material specification (type, thickness, conductivity) must be fixed in the BOM and controlled as a critical component.
At compactbess.com, our sourcing team works with verified Chinese manufacturers of liquid-cooled large-format battery packs and associated thermal management components — connecting global procurement engineers with suppliers who can document validated thermal performance data. If you’re building a shortlist for a C&I energy storage project and need suppliers who have actually characterized their pack-level temperature uniformity beyond top-cover hot-spot readings, we can help you identify the right manufacturing partners.
Need help identifying qualified suppliers for liquid-cooled large-format battery packs? Talk to our sourcing team →
Supplier Qualification Questions #
- What is the global maximum temperature differential (not top-cover surface measurement, but full pack worst-case ΔT) under your specified cooling configuration during a 0.5C continuous discharge to 90% depth of discharge? The threshold for acceptable pack-level uniformity is ≤5 °C — can you provide logged test data showing your design meets this?
- Does your liquid cooling plate use bottom-only or bottom-plus-two-side layout? If bottom-only, what is the measured temperature gradient in the cell height direction from base to top cover at end of discharge under your rated flow conditions?
- What is the thermal conductivity and thickness of the thermal interface material between the cell base and the cooling plate? The reference specification for this application is a 2 mm silica thermal pad — what is your TIM’s rated conductivity in W/(m·K) and how is it controlled in your BOM?
- What inlet flow rate range has your thermal system been validated at, and what is the measured pressure drop across the cooling circuit at 10 L/min and 12.5 L/min? We need to confirm that pump parasitic energy consumption has been characterized — specifically, does energy consumption increase significantly between 10 and 15 L/min?
- What DC internal resistance specification do you hold for these cells at 25% SOC, 25 °C, 10-second pulse discharge? The reference value for 280 Ah semi-solid large-format cells is 0.50 mΩ under those conditions — and how does internal resistance variation across the cell batch affect your pack-level heat generation modeling?
Sourcing Checklist #
- [ ] Supplier’s pack thermal specification states global maximum temperature differential ≤5 °C (not just top-cover hot-spot) under rated 0.5C discharge conditions, verified by test data or calibrated simulation with ≤3% relative error
- [ ] Cooling plate layout is confirmed as bottom-plus-two-side configuration, or supplier provides documented justification for bottom-only with global ΔT data showing compliance with the ≤5 °C threshold
- [ ] Inlet flow rate specification is in the 10.0–12.5 L/min range for 280 Ah class cells; supplier can demonstrate that increasing beyond 12.5 L/min yields ≤0.20 °C additional cooling benefit
- [ ] Thermal interface material between cell and cooling plate is specified at ≥2 mm thickness with documented thermal conductivity, controlled as a critical BOM component per IEC 62619 material traceability requirements
- [ ] Flow channel aspect ratio W/H ≤ 3 is specified for the cooling plate internal geometry, with documented pressure drop reduction of ≥25% versus W/H = 5 under equivalent flow conditions
- [ ] Cell format dimensions and energy density are confirmed: 280 Ah capacity, ≥165 Wh/kg energy density, DC internal resistance ≤0.50 mΩ at 10 s pulse / 25 °C / 25% SOC
- [ ] Pack has passed UN 38.3 transport certification and CE / IEC 62619 safety qualification, with certificates traceable to the specific cell lot and pack configuration being quoted
- [ ] Simulation or test validation documentation shows temperature monitoring across the full cell stack (not only surface hot-spots), with coolant inlet temperature set at 22 °C and ambient at 25 °C
Key Specifications Table #
| Parameter | Recommended Value | Verification Method |
|---|---|---|
| Global pack temperature differential (ΔT max) | ≤3.0 °C (target); ≤5.0 °C (maximum allowable) | Full-pack temperature field monitoring during 0.5C discharge to 90% DoD; worst-case global max minus global min |
| Cooling plate layout | Bottom + two-side configuration | Design drawing review; confirm side plate coverage from mid-height to top of cell stack |
| Coolant inlet flow rate | 10.0–12.5 L/min per pack module | Flow meter measurement at inlet; verify pressure drop ≤ value at W/H = 3 geometry baseline |
| Flow channel aspect ratio (W/H) | ≤3 (H = 6 mm fixed) | Cross-sectional measurement of cooling plate flow channels; pressure drop test showing ≥27% reduction vs. W/H = 5 |
| Thermal interface material thickness | 2 mm silica thermal pad (conductivity per supplier datasheet) | BOM inspection; thermal conductivity certificate; installation inspection at cell-to-plate interface |
| Cell DC internal resistance | ≤0.50 mΩ (10 s pulse, 25 °C, 25% SOC) | DCR test per manufacturer’s DCIR map; validate across full SOC range 0–100% |
| Maximum cell temperature rise (end of 6480 s discharge) | ≤0.51 °C above initial with bottom+side cooling; ≤10 °C absolute industry limit | Top-cover temperature monitoring at end of 0.5C discharge; compare against 22 °C inlet baseline |
| Optimal operating temperature range | 20–35 °C | Thermocouple monitoring at cell top cover and base; confirm cooling system maintains range during rated discharge |
Can’t find a supplier meeting these specs? Submit your requirements and we’ll match you within 48 hours.
Frequently Asked Questions #
Why does cooling plate layout matter more than flow rate for battery pack temperature uniformity?
Flow rate controls how much heat is extracted, but layout controls where heat extraction occurs along the cell height. In a bottom-only cooling configuration, cells dissipate heat from the base while the top half of the cell — physically furthest from the cooling surface — can accumulate significantly higher temperatures. At 10 L/min with bottom-only cooling, the global temperature differential reaches 8.80 °C, exceeding the ≤5 °C threshold that industry data associates with accelerated capacity loss. Adding side cooling plates that cover the upper portion of the cell stack cuts this differential to 3.0 °C at the same flow rate — because the geometric problem is solved rather than compensated for with more coolant.
What happens to battery capacity if inter-cell temperature differential exceeds 5 °C?
Current field and laboratory data indicates capacity loss of approximately 1.5% to 2% per cycle accumulation when sustained temperature differentials exceed 5 °C between cells in the same module. The degradation mechanism is electrochemical: cells operating at different temperatures age at different rates, developing divergent internal resistance and SOC characteristics. This accelerates pack-level imbalance and shortens effective service life even if individual cells are within specification.
Is W/H = 3 always the right channel geometry choice?
For large-format C&I applications where pump energy over a 10-year service life is a real cost, yes. The W/H = 3 geometry reduces system pressure drop by up to 27.2% compared to W/H = 5, and cuts energy consumption by 37.3% — with negligible difference in actual cell cooling performance. The only scenario where you’d consider higher W/H ratios is if the pack has tight height constraints that make a taller channel impractical.
Can immersion (direct liquid) cooling solve the uniformity problem more effectively?
Immersion cooling does achieve excellent temperature uniformity, but it remains commercially impractical for large C&I stationary storage. The risks — high cost, maintenance complexity, and significant fluid leakage potential — mean it’s still primarily in the research and pilot phase for this application class. Indirect liquid cooling with an optimized bottom-plus-two-side plate layout achieves a 3.0 °C global temperature differential, which is well within safe operating parameters for most deployments and is manufacturable at scale.
What certifications should I require for a liquid-cooled large-format pack destined for European C&I deployment?
At minimum: UN 38.3 for transport, IEC 62619 for stationary lithium battery safety, and CE marking for the EU market. For grid-connected systems in Europe, also review compliance with the EU Battery Regulation 2023/1542, which introduces requirements on carbon footprint, due diligence, and battery passport documentation that will affect your supplier qualification process. Internal links for more detail: IEC 62619 Industrial Safety and EU Battery Regulation 2023/1542.
Published by compactbess.com Technical Team | Request a sourcing quote
Data source: Thermal Performance Optimization of Liquid-Cooled Plate Configurations in Large-Format Lithium Battery Packs for Commercial Energy Storage Applications, L. Zhang et al., Journal of the Electrochemical Society, 2024
Content reviewed by dr.james.okafor | © compactbess.com — All rights reserved. Unauthorized reproduction prohibited.


