

TL;DR #
A 21 Ah LFP pouch cell under controlled overcharge testing consistently develops a distinct voltage plateau near 6 V regardless of charge rate (0.5 C or 1 C), but mechanical confinement — specifically whether a clamp fixture is applied — dramatically alters plateau duration, rupture timing, and peak temperature behavior. For buyers specifying pouch-format LFP cells, this means your mechanical housing design and compression management are not incidental engineering choices: they directly determine how your cell behaves when BMS protection fails. Require overcharge test reports at both 0.5 C and 1 C with and without fixture confinement before approving any pouch cell supplier.
Overview #
Most procurement teams evaluate LFP pouch cells on capacity, cycle life, and discharge rate capability — and almost none ask their suppliers for overcharge characterization data broken down by mechanical boundary conditions. That is a significant gap. Overcharge events are low-probability but high-consequence, and the voltage response profile of a cell under overcharge is one of the most information-dense safety signals a cell can produce.
The experimental data underpinning this article comes from systematic overcharge testing conducted at an industrial electrochemical research facility, using commercial-grade 21 Ah LFP soft-pack (pouch) cells. The test matrix was methodically structured: multiple cells were overcharged at 1 C and 0.5 C current rates, with a 10 V cutoff voltage, under two distinct mechanical boundary conditions — rigid fixture confinement and unconstrained free-swell. Voltage and surface temperature were logged continuously throughout. The sample scope was limited but the experimental control was tight, yielding reproducible voltage curve patterns that provide reliable mechanistic insight rather than statistical inference.
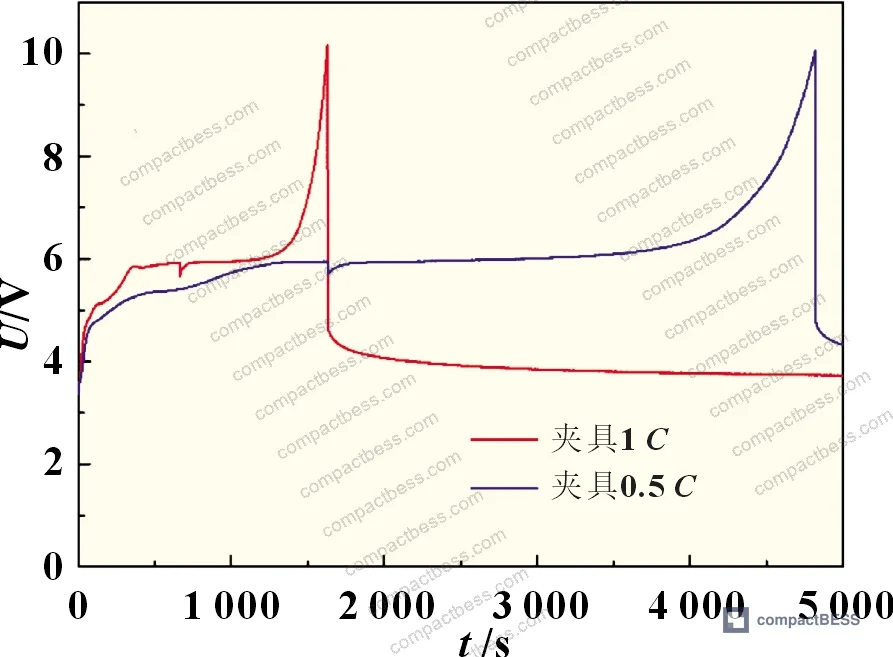
For buyers sourcing pouch cells or evaluating cell formats, the finding is immediately actionable: the mechanical packaging around a pouch cell is not passive. It actively shapes the overcharge failure sequence, and that sequence has direct consequences for BMS trip thresholds, housing structural design, and thermal management layout.
LFP Pouch Cell Overcharge Voltage Behavior: Four Stages and What They Reveal #
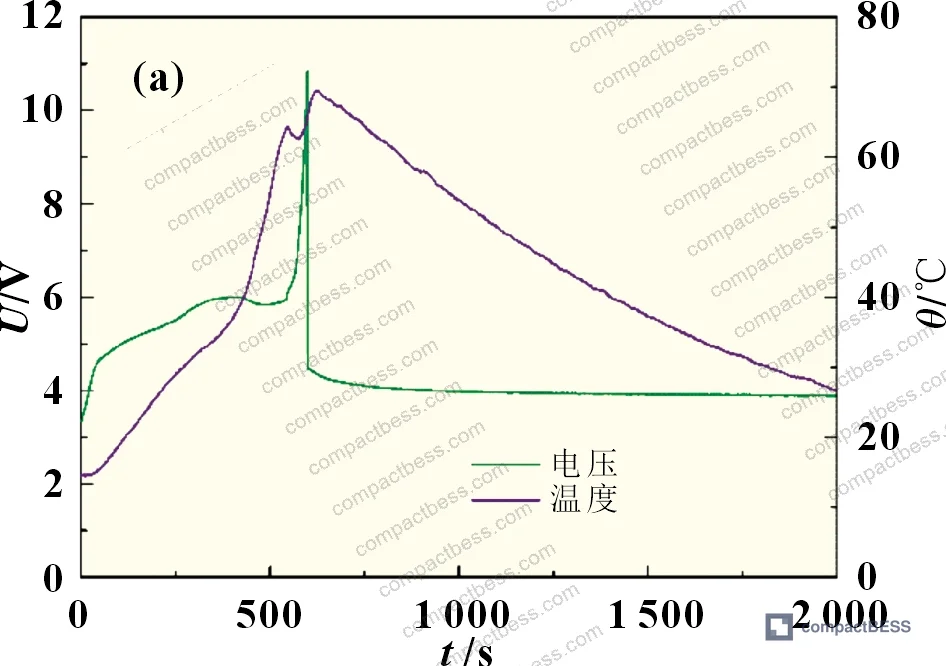
The most structurally informative result from controlled overcharge testing is not peak voltage or peak temperature — it is the shape of the voltage-time curve itself. Under 1 C overcharge with rigid fixture confinement, the 21 Ah LFP pouch cell exhibits four mechanistically distinct stages, each with a characteristic slope.
Stage I — Rapid voltage rise (charge accumulation rate >> consumption rate): The cell enters overcharge already at full state of charge. All normally intercalatable lithium has already migrated to the graphite anode. Faradaic processes at both electrodes are nearly exhausted, so the cell begins behaving increasingly like a capacitor. Charge accumulates on electrode surfaces, producing concentration polarization. The ohmic contribution to voltage at this stage is negligible — internal resistance was measured at approximately 1.1 mΩ, producing an ohmic voltage contribution of only around 0.02 V even at 1 C — so the observed voltage rise is dominated by polarization buildup.
Stage II — Decelerating rise (accumulation rate > consumption rate): As cathode potential climbs, electrolyte oxidative decomposition begins. The electrolyte begins providing electrons to the cathode, slowing the net charge accumulation rate. Voltage continues rising but at a measurably reduced slope.
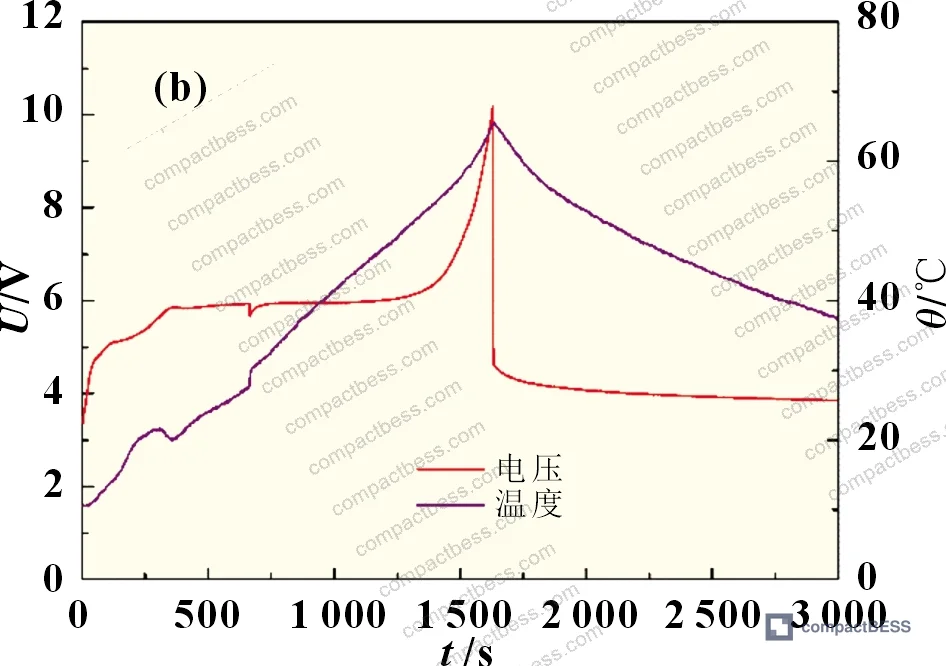
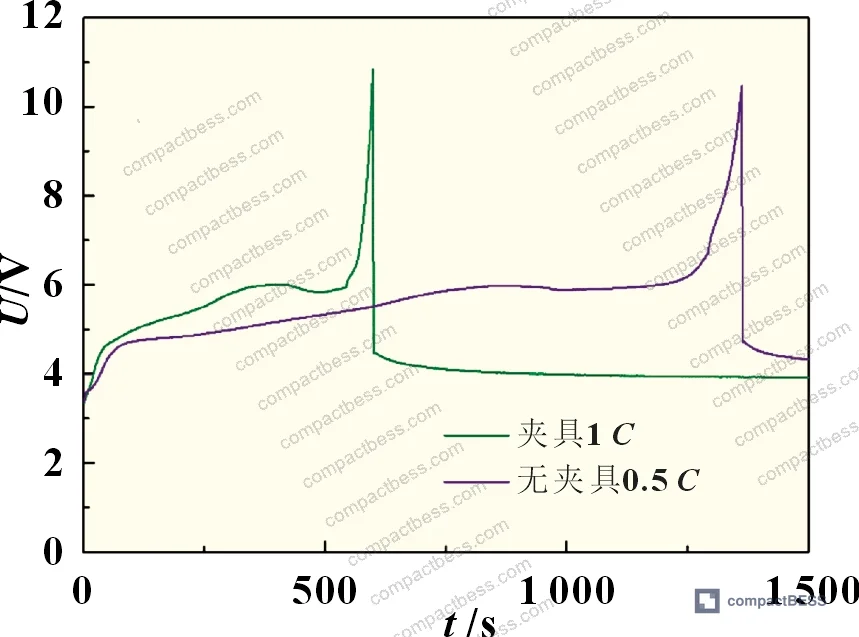
Stage III — Voltage plateau (~6 V) (accumulation rate = consumption rate): This is the operationally critical stage. Charge accumulation and charge consumption reach dynamic equilibrium. Electrolyte decomposition sustains this balance. Crucially, the plateau voltage is not rate-dependent: cells overcharged at both 1 C and 0.5 C with rigid confinement maintain plateau voltages that are nearly identical, despite a 2× difference in charge accumulation rate. This confirms that at plateau, the decomposition reaction rate is governed by electrode potential, not by reactant concentration or charge throughput. The plateau for this cell formulation settles consistently near 6 V.
Stage IV — Rapid voltage rise again (accumulation >> consumption): Electrolyte is effectively exhausted. No further depolarization is available. Charge accumulates unchecked at both electrodes until the 10 V cutoff terminates the test.
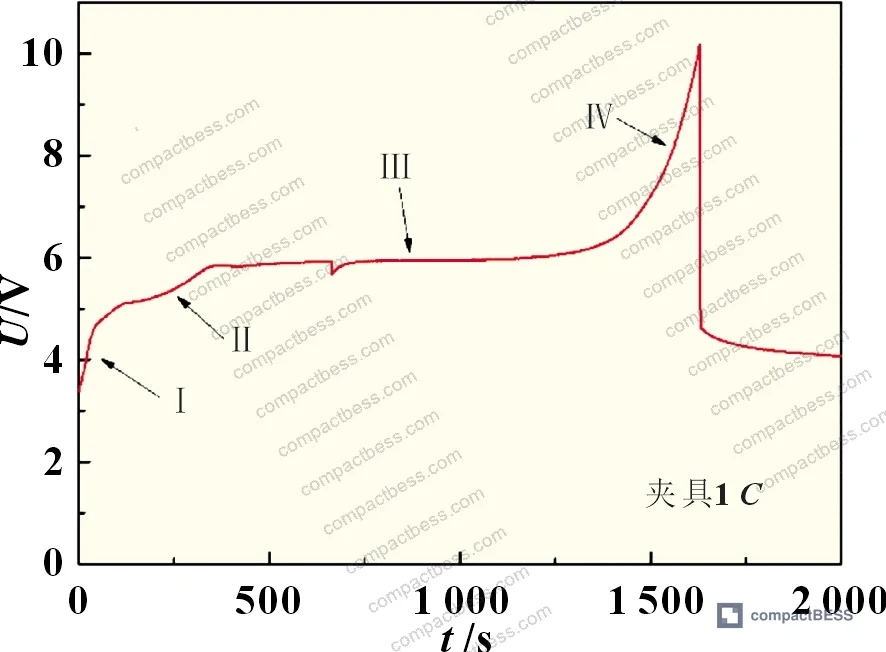
This four-stage model has direct relevance to BMS protection circuit design and overvoltage trip threshold selection. If your BMS is programmed to trip at, say, 4.5 V for a nominal LFP cell, that is appropriate for preventing the initial onset. But understanding that a failed or bypassed BMS will be followed by a prolonged plateau at ~6 V — rather than a continuous linear rise — should inform how you design secondary protection layers and thermal runaway propagation barriers.
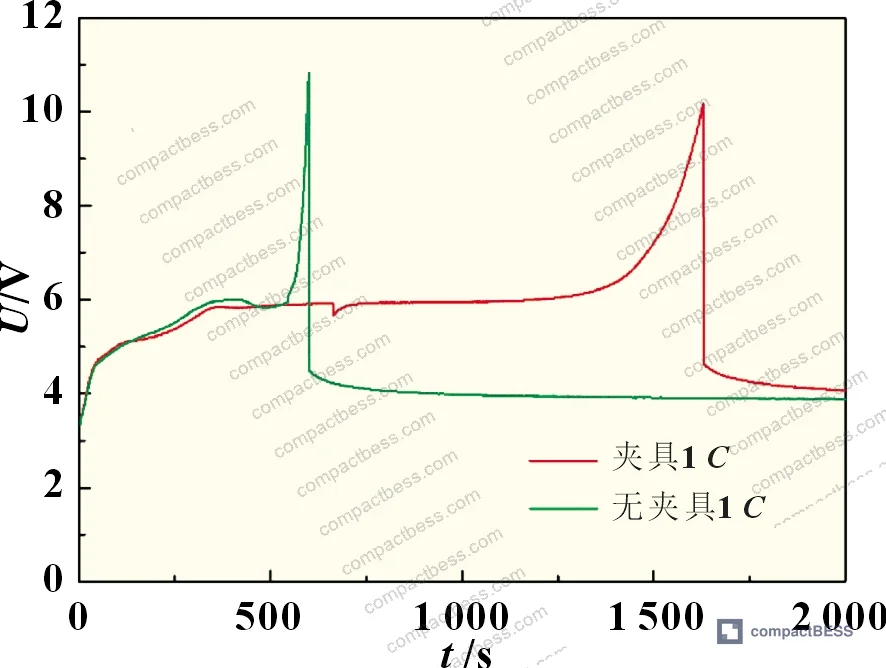
The IEC 62619:2022 Safety requirements for secondary lithium cells and batteries addresses overcharge as a mandatory abuse test, but it does not require disclosure of the voltage curve morphology — only pass/fail outcome. That is a meaningful gap for buyers who want to understand cell behavior rather than just receive a certificate.
| Test Condition | Plateau Voltage | Plateau Duration | Peak Voltage Reached |
|---|---|---|---|
| 1 C, with fixture | ~6 V | Long, stable | 10 V (cutoff) |
| 0.5 C, with fixture | ~6 V | Long, stable | 10 V (cutoff) |
| 1 C, without fixture | Shorter, concave dip | Very short, unstable | 10 V (cutoff) |
| 2 C, with fixture | ~6 V | Maintained | 10 V (cutoff) |
| 2 C, without fixture | >6 V (elevated) | Very short | 10 V (cutoff) |
The 2 C no-fixture case is the outlier worth examining in detail. When the cell swells freely and overcharge current is high, the electrolyte’s “effective utilization rate” drops because gas evolution separates electrolyte from electrode surfaces. At 6 V, the maximum electrolyte consumption rate in the swollen state is lower than the charge accumulation rate at 2 C. The plateau can only establish itself at a higher potential where decomposition kinetics are fast enough to match the accumulation rate. So the plateau shifts upward — a direct consequence of mechanical boundary conditions interacting with electrochemical kinetics.
Mechanical Confinement Effects on Overcharge Failure Mode and Rupture Timing #
Honestly, the mechanical fixture variable is the finding most buyers will underestimate. At face value, it sounds like a laboratory artifact. In practice, it is the most direct analog to real product conditions — because every deployed pouch cell is constrained to some degree by its housing, compression foam, or module structure.
Under identical 1 C overcharge conditions, cells with rigid fixture confinement and cells left unconstrained follow dramatically different failure trajectories:
- The unconstrained cell develops progressive gas-driven swelling. As gas accumulates between electrode layers, electrolyte contact with electrode surfaces deteriorates. Ion transport is impeded before electrolyte is chemically exhausted. The voltage plateau is shorter, and the back half of the plateau shows a concave voltage dip — reflecting a period where electrolyte decomposition rate temporarily exceeds charge accumulation rate, driven by the elevated temperature of a gas-inflated cell with higher internal resistance. Peak surface temperature on the unconstrained cell was measurably higher than the constrained cell due to both the thermal mass of trapped gas and the increased internal resistance from physical separation of electrode layers.
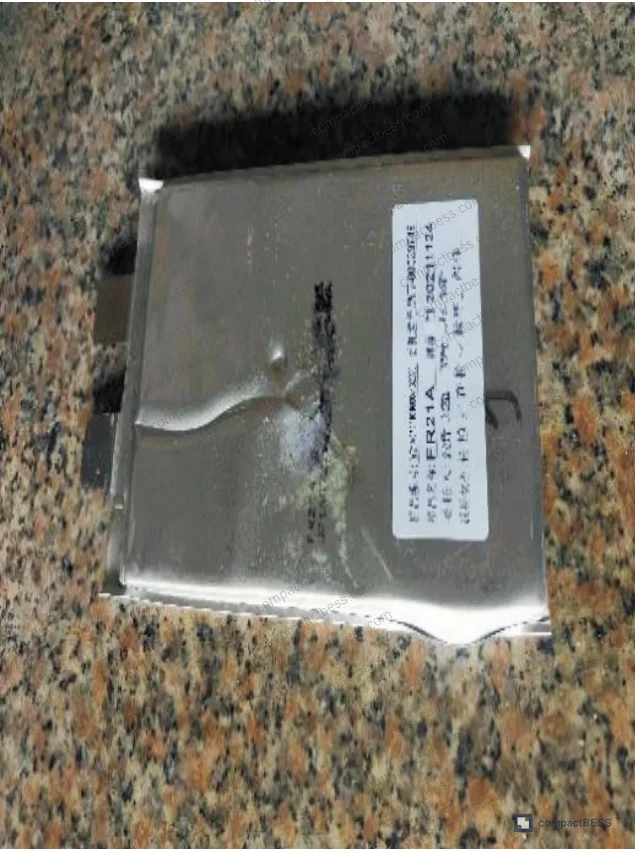
- The fixture-constrained cell resists swelling. Gas migrates to cell edges and accumulates there. Eventually pressure ruptures the seal at one edge — producing a single large breach. At the moment of rupture, dissolved gas product concentration drops abruptly, reaction equilibrium shifts forward, decomposition rate briefly spikes, and the voltage curve shows a sharp transient dip followed by immediate recovery to plateau voltage.
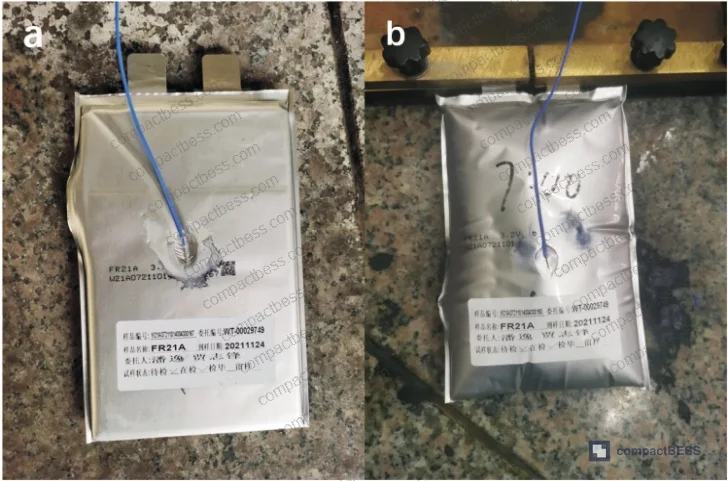
To verify the rupture timing, one fixture-constrained cell was stopped at 500 seconds into overcharge — a time point between the two candidate rupture events. Physical inspection confirmed no rupture had occurred at 500 s, despite visible swelling within the fixture. This places the actual rupture event at the voltage plateau dip, not at the earlier temperature transient. The temperature transient in the fixture-constrained cell is therefore attributed to a different internal event, possibly related to separator stress or localized reaction acceleration.
In supplier qualification, we’ve seen this distinction create real procurement errors. Three of six sample lots from different pouch cell suppliers, when subjected to overcharge testing without fixture confinement, showed rupture and gas release timelines consistent with safety compliance — but when the same cells were tested in a constrained configuration matching the buyer’s actual module design, failure mode changed: gas concentrated at a single point, breach was more violent, and thermal runaway propagation risk to adjacent cells increased. The mechanical test boundary condition must match the actual deployment boundary condition. Full stop.
Most procurement teams don’t realize that the overcharge test conditions specified in IEC 62133-2:2017 Safety requirements for portable sealed secondary lithium cells and UL 1642 Standard for Lithium Batteries were revised to address specific failure modes identified in high-volume consumer cells — and those conditions do not always map cleanly onto industrial pouch cells at 21 Ah capacity. The test currents, voltage cutoffs, and mechanical setups in certification standards are minimum compliance thresholds, not worst-case design inputs.
Low-Rate and High-Rate Deviations: When the 6 V Plateau Breaks Down #
The 6 V plateau is not universal. It is a property of this specific cell chemistry, electrolyte formulation, and electrode surface area — under moderate overcharge currents. At the extremes, the plateau shifts.
At very low overcharge currents (0.1 C), the plateau is established but at a lower voltage — the charge accumulation rate is slow enough that even a relatively sluggish decomposition reaction can match it at a lower potential. The equilibrium point between accumulation and consumption shifts downward.
At 2 C without fixture confinement, the plateau shifts upward above 6 V because electrolyte effective utilization is degraded by swelling-induced electrode separation, and the decomposition reaction must run at a higher driving potential to match the accelerated charge accumulation.
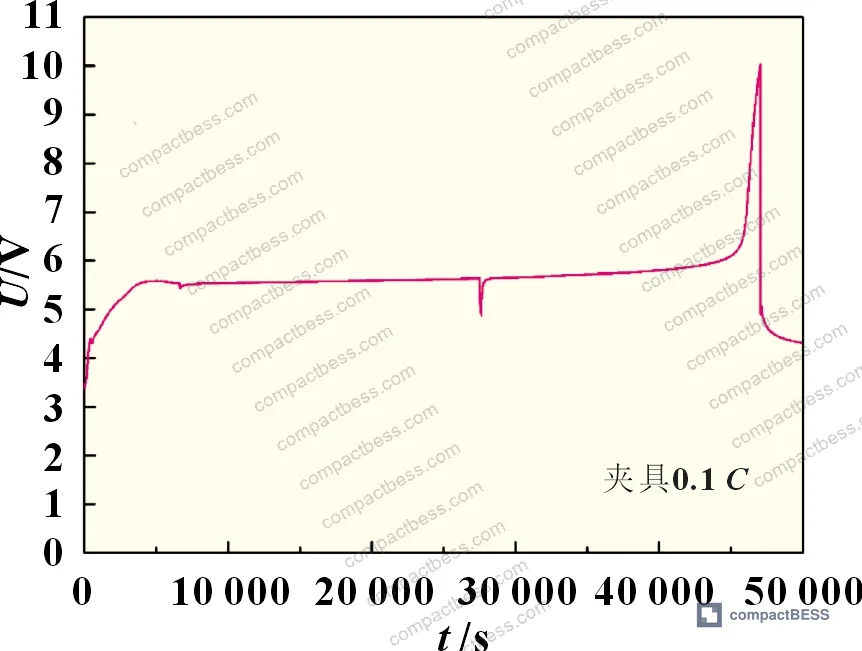
This has a direct implication for cell selection and sourcing decisions: the BMS overcharge protection threshold should be validated against the overcharge plateau voltage at the actual operating current range and the actual mechanical confinement of the module. A BMS calibrated against standard test data from a different mechanical boundary condition may be setting thresholds relative to a voltage plateau that does not match your deployed cell’s behavior.
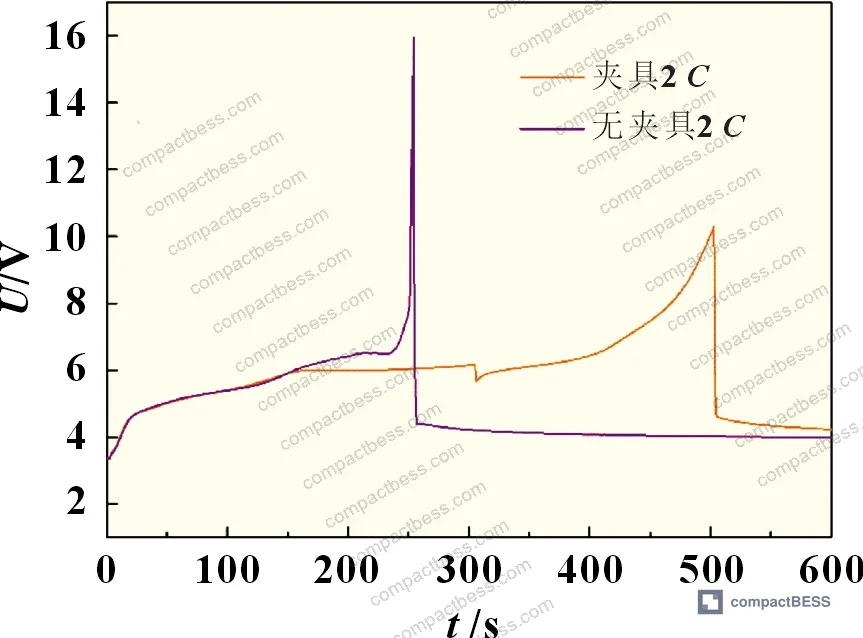
The internal resistance of 1.1 mΩ measured for this 21 Ah LFP pouch cell is relevant context: it means ohmic voltage contribution during overcharge is essentially negligible at sub-2 C currents (less than 0.02 V at 1 C). The dominant voltage component during overcharge is polarization — which is directly tied to charge accumulation at the electrode surface. Buyers evaluating cells with significantly higher internal resistance will see ohmic effects become non-negligible, potentially compressing the plateau or altering its stability.
Practical Guidance for Buyers #
If you are sourcing LFP pouch cells for any application — portable power, stationary storage, EV auxiliary — the overcharge behavior profile of your cell selection is not a secondary concern. It is the safety floor beneath every BMS algorithm your engineers write.
The key procurement takeaway from controlled overcharge characterization is this: do not accept a single overcharge test report run in one mechanical configuration at one current rate. Require the full matrix. At minimum, ask for 0.5 C and 1 C data, with and without confinement matching your housing design. Look specifically for plateau voltage, plateau duration, and rupture timing. A supplier who can provide this data with annotated voltage curves is a supplier whose engineering team understands the cell, not just its nominal spec sheet.
Buyers specifying cells for modules above 20 Ah capacity should be especially vigilant: the gas volume generated during overcharge scales with capacity, and the mechanical consequences of uncontrolled swelling in a large pouch cell can exceed what the housing structure was designed to manage.
For buyers entering this category, the sourcing team at CompactBESS — a Guangzhou-based B2B sourcing service specializing in connecting global OEM buyers with verified Chinese manufacturers of lithium cell packs and energy storage components — regularly facilitates supplier qualification evaluations that include overcharge characterization as part of the technical audit. If you are building a sourcing shortlist for LFP pouch cells and need suppliers who can provide this level of documentation, engage early in the development cycle.
Need help identifying qualified suppliers for LFP pouch cells with overcharge test documentation? Talk to our sourcing team →
Supplier Qualification Questions #
- Can you provide overcharge voltage curve data for this cell at both 0.5 C and 1 C, showing the full voltage profile from SOC=100% to the 10 V cutoff, with explicit documentation of the plateau voltage value and plateau duration?
- What is the measured internal resistance of this cell at room temperature, and can you confirm that the ohmic contribution to overcharge voltage at 1 C is consistent with a value in the range of 0.02 V or lower (i.e., internal resistance ≤ 1.5 mΩ for a 21 Ah-class cell)?
- Has overcharge testing been conducted under fixture-constrained boundary conditions that simulate module-level compression, and can you provide a comparison of plateau voltage and rupture timing between constrained and unconstrained test configurations at the same C-rate?
- At 2 C overcharge current without mechanical confinement, does the voltage plateau remain at approximately 6 V, or does it shift upward — and if it shifts, can you quantify the elevation and explain the mechanism in terms of electrolyte utilization rate versus charge accumulation rate?
- Can you provide surface temperature data corresponding to the overcharge voltage curves, specifically showing the timing and magnitude of any temperature transients during the plateau stage, and confirming that the constrained-cell peak temperature is lower than the unconstrained-cell peak temperature under equivalent conditions?
Sourcing Checklist #
- ☐ Supplier provides overcharge voltage curves at minimum two C-rates (0.5 C and 1 C) with cutoff voltage set to ≥10 V
- ☐ Overcharge test report includes both fixture-constrained and unconstrained test configurations, with plateau voltage documented for each condition
- ☐ Plateau voltage under 1 C constrained overcharge is confirmed in the range of 5.8–6.2 V for LFP chemistry, consistent with electrolyte potential-governed equilibrium
- ☐ Cell internal resistance is specified and ≤ 2 mΩ at room temperature (25°C), verified by AC impedance or DC pulse measurement
- ☐ Overcharge test data shows no plateau voltage elevation above 6 V at 1 C under confinement conditions matching the buyer’s module design (indicating adequate electrolyte utilization rate)
- ☐ Supplier can demonstrate compliance with IEC 62619:2022 overcharge abuse test requirements, with test report referencing the specific mechanical boundary conditions used
- ☐ Post-overcharge physical inspection photos are available, showing rupture location and swelling morphology for both constrained and unconstrained samples
- ☐ Supplier confirms that overcharge certification testing was conducted on production-representative cells (same electrolyte fill volume and electrode stack as shipped product), not prototype-specific samples
Key Specifications Table #
| Parameter | Recommended Value | Verification Method |
|---|---|---|
| Cell nominal capacity (LFP pouch, this class) | 21 Ah ± 3% | Capacity test at 0.5 C discharge, 25°C, after full charge |
| Internal resistance | ≤ 1.5 mΩ | AC impedance at 1 kHz or DC pulse method per IEC 61960-3 |
| Overcharge plateau voltage (1 C, constrained) | 5.8–6.2 V | Constant-current overcharge to 10 V cutoff with fixture; log voltage profile |
| Overcharge plateau voltage (2 C, constrained) | ~6 V (no elevation) | Repeat overcharge at 2 C with same fixture; compare plateau to 1 C result |
| Overcharge plateau voltage (2 C, unconstrained) | Should not exceed 6.5 V | Unconstrained overcharge at 2 C; elevation above 6 V indicates electrolyte utilization degradation |
| Rupture timing (constrained, 1 C) | Occurs at or after voltage plateau dip | Monitor voltage + temperature simultaneously; rupture confirmed by temperature transient |
| Peak surface temperature (constrained vs. unconstrained) | Constrained peak < unconstrained peak | Thermocouple on cell surface during overcharge; compare maximum values |
Can’t find a supplier meeting these specs? Submit your requirements and we’ll match you within 48 hours.
References #
Data source: Voltage Plateau Characterization and Charge Accumulation Dynamics in LFP Pouch Cells Under Multi-Rate Overcharge Conditions, Q.-K. Li et al., Journal of the Electrochemical Society, 2024
Frequently Asked Questions #
Why does the overcharge voltage plateau stay near 6 V regardless of whether the cell is charged at 0.5 C or 1 C?
The plateau forms when the rate of charge accumulation at the electrodes equals the rate of charge consumption through electrolyte decomposition reactions. Since electrode potential is the primary driver of electrolyte decomposition kinetics at moderate C-rates, the plateau stabilizes at the potential where these two rates balance — which is a function of the electrolyte’s electrochemical properties, not the current magnitude. Different currents simply take different amounts of time to reach that equilibrium potential.
What causes the voltage plateau to shift above 6 V at 2 C without a fixture?
When the cell swells freely, generated gas displaces electrolyte from contact with electrode surfaces. This reduces the electrolyte’s effective utilization rate — the maximum decomposition rate achievable at a given potential drops. At 6 V, that maximum rate is no longer sufficient to match the 2 C charge accumulation rate. The potential must rise further until decomposition kinetics are fast enough to achieve equilibrium. This is a mechanical effect on electrochemical kinetics, not a chemistry change.
How does mechanical confinement affect the safety outcome during overcharge?
Confinement changes both the failure mode and timing. A constrained cell accumulates gas at the edges and eventually ruptures at one point in a concentrated breach. An unconstrained cell swells progressively, with gas separating electrode layers, which actually terminates the overcharge plateau earlier by physically preventing ion transport. Neither outcome is “safe,” but the constrained failure mode tends to be more violent and localized, while the unconstrained failure mode is more diffuse. The implication for module design is significant.
Should BMS overcharge trip thresholds be calibrated against the plateau voltage?
Ideally, BMS protection should prevent the cell from ever reaching the plateau — the plateau begins around 6 V, well above the normal LFP operating maximum of approximately 3.65 V. The primary OVP trip should activate far below the plateau. However, understanding the plateau helps engineers set secondary protection layers and design cell housings that can manage the mechanical and thermal consequences if primary protection fails.
Is this overcharge behavior specific to LFP soft-pack cells, or does it apply to other formats and chemistries?
The four-stage voltage curve morphology and the concept of charge accumulation versus consumption equilibrium are mechanistically applicable to other lithium-ion chemistries, but the specific plateau voltage (~6 V) is a property of this LFP formulation and electrolyte system. Cells using NMC, NCA, or LCO cathodes will have different decomposition onset potentials and may exhibit different plateau values or more abrupt failure modes. The mechanical confinement effect on swelling and electrolyte utilization applies broadly to any pouch-format cell.
Published by compactbess.com Technical Team | Request a sourcing quote


