

TL;DR #
LFP cells stored at 30% SOC show a volume change rate of only 1.0% and internal resistance increase of just 0.06 mΩ after 7 days at 60°C — compared to catastrophic 34.2% volume expansion and 0.45 mΩ resistance shift at 5% SOC. For buyers sourcing LFP cells or packs that will transit ocean freight in summer conditions, the storage SOC specified in your supplier’s outgoing process directly determines whether cells arrive healthy or pre-degraded. Require your supplier to document their storage SOC protocol and K-value screening process before placing any volume order.
Overview #
If you’re evaluating LFP cell suppliers for stationary storage or portable power applications, the storage and aging protocol used between cell formation and module assembly is one of the most consequential — and least-audited — steps in the entire manufacturing chain. Most procurement teams focus on cycle life and capacity ratings. Almost nobody asks about the outgoing SOC or screening aging duration. That’s a mistake that shows up months later as field returns.
The data reviewed here comes from a controlled study conducted at a major Chinese LFP cell manufacturer, using 20 Ah prismatic pouch cells with LFP/artificial graphite chemistry. The experimental design was rigorous: 500-cell sample groups per aging condition, gas evolution measured by water displacement before and after 60°C storage, and module-level consistency evaluated across 10 modules per group. This isn’t a bench-top academic exercise — it was designed to answer a direct production question: what SOC and aging protocol should cells leave the factory under?
The findings are directly applicable to procurement decisions involving any LFP cell sourced from China for overseas deployment, particularly where maritime shipping introduces multi-week exposure to elevated temperature and humidity.
SOC-Dependent Gas Evolution in LFP Cells: Why Storage State of Charge Determines Shipping Health #
This is the section most buyers skip entirely, and it’s the one that costs them the most.
At 60°C over 7 days — conditions that approximate a container ship’s cargo hold transiting the Middle East in summer — LFP cells behave very differently depending on their SOC at departure. The data is unambiguous:
| SOC at Storage | Volume Change Rate | Voltage Drop | Internal Resistance Increase |
|---|---|---|---|
| 5% | 34.2% | 348.3 mV | 0.45 mΩ |
| 15% | Significant swelling | Elevated | Elevated |
| 30% | 1.0% | 37.1 mV | 0.06 mΩ |
At 5% SOC, the cells are effectively destroyed after a single high-temperature transit. At 30% SOC, the same exposure leaves cells functionally intact.
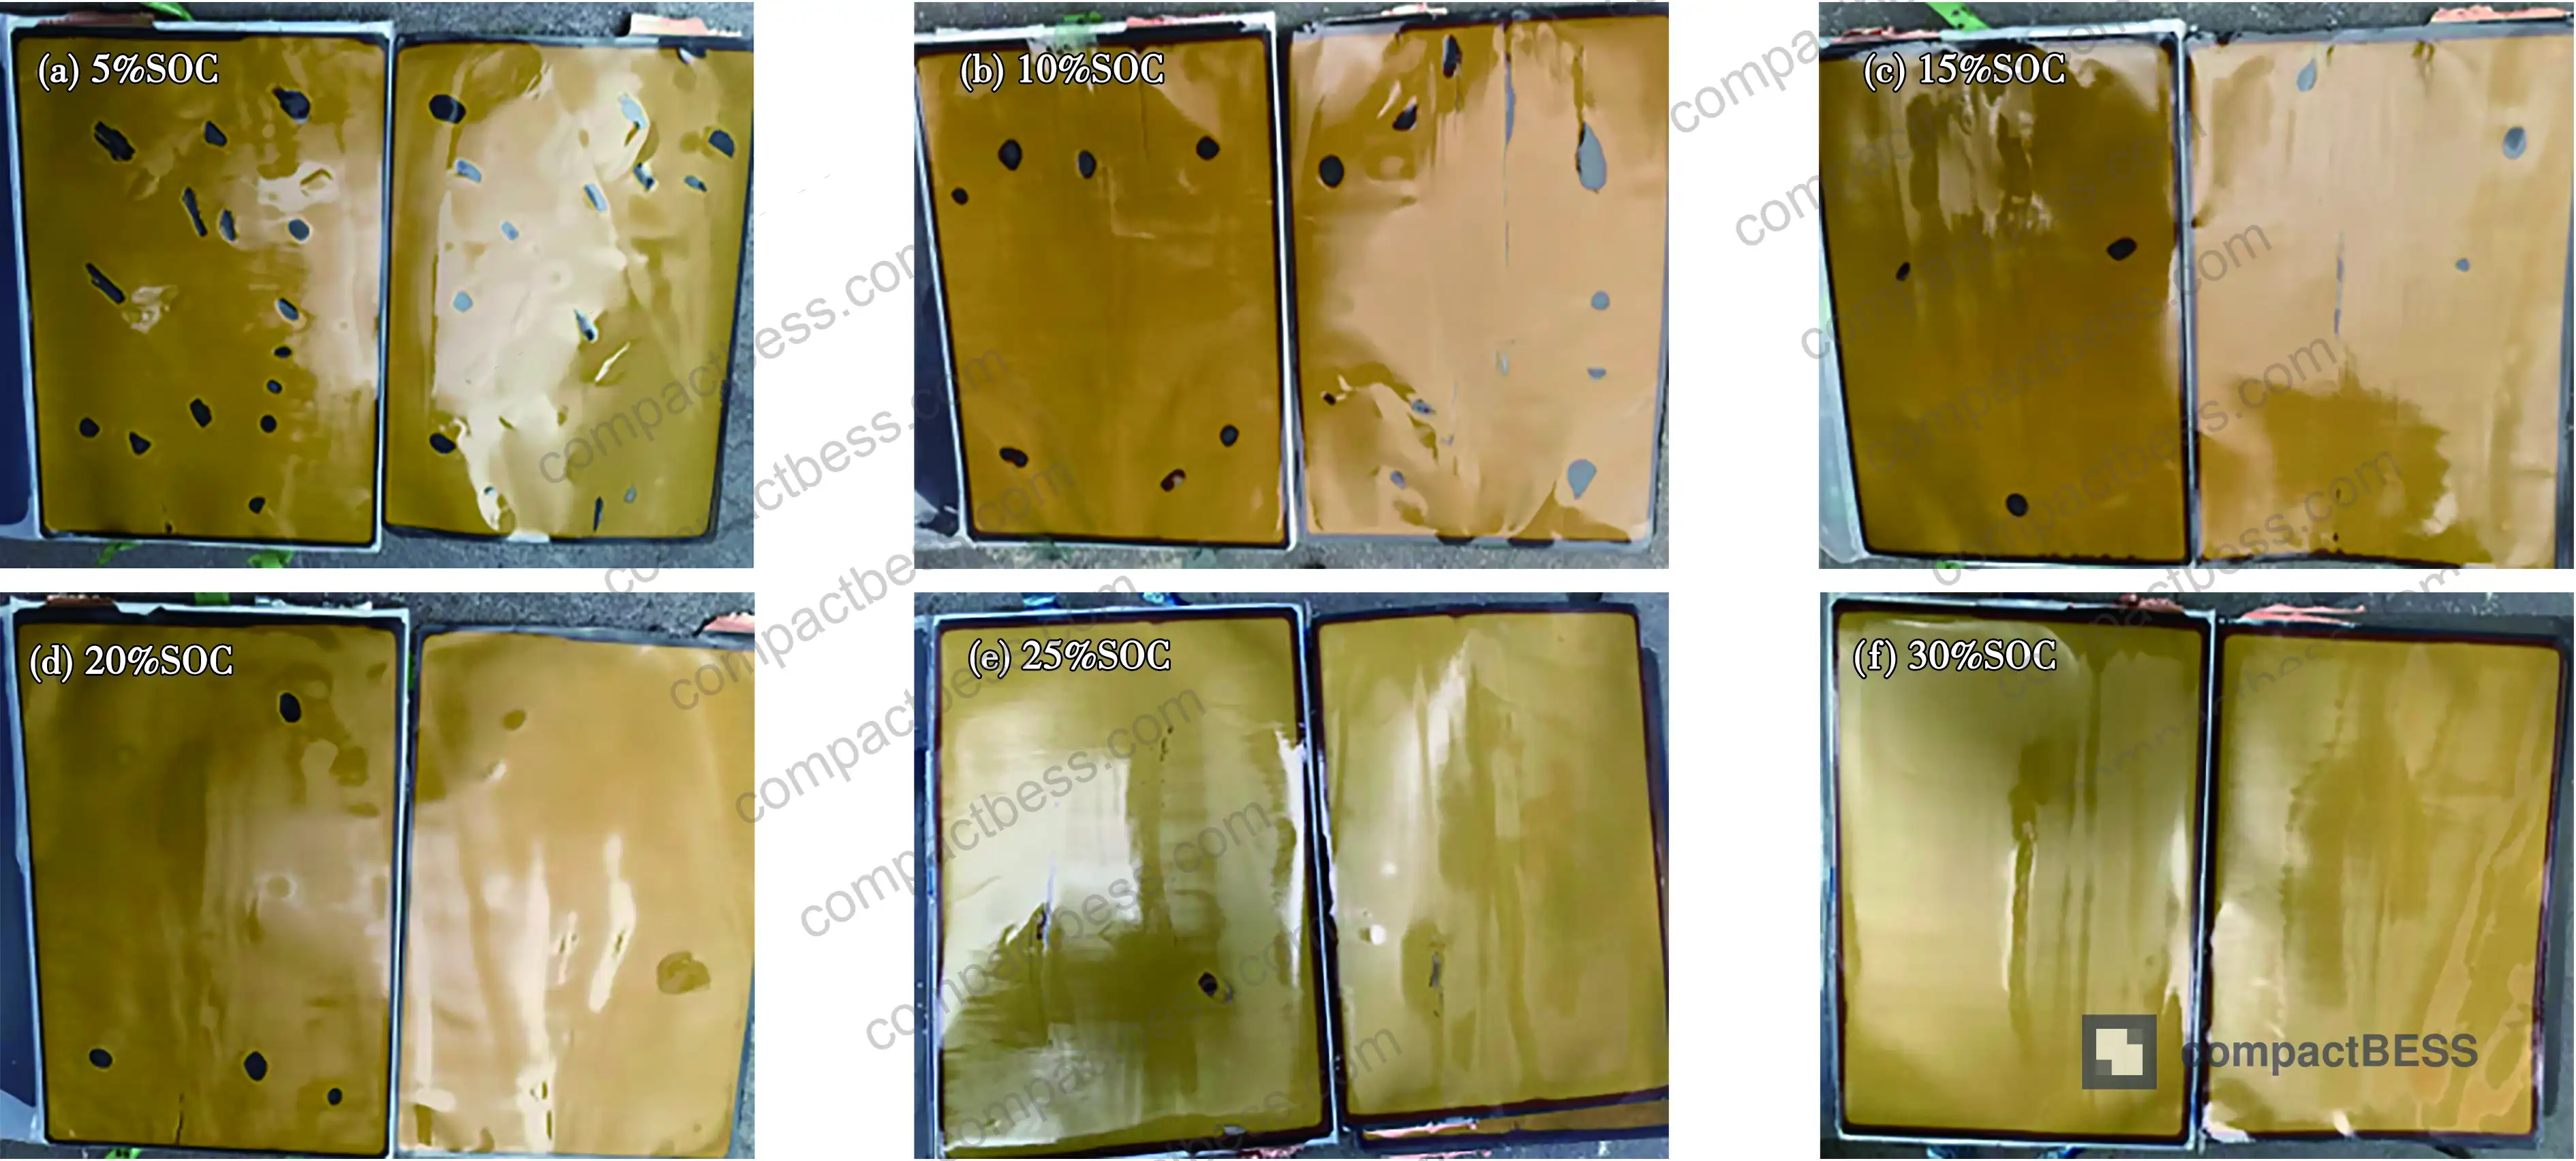
The mechanism is straightforward once you understand the electrochemistry. At low SOC, the graphite anode potential sits close to the SEI film formation potential. For fresh cells — which is exactly what you’re shipping — the SEI layer hasn’t fully stabilized. The anode reacts with electrolyte components including EC, EMC, and VC, generating gas that accumulates between the separator and electrode. Post-storage disassembly confirmed this directly: negative electrodes from cells stored at 30% SOC showed uniform yellow coloration, while cells stored at 5% SOC showed extensive black spotting across the anode surface.
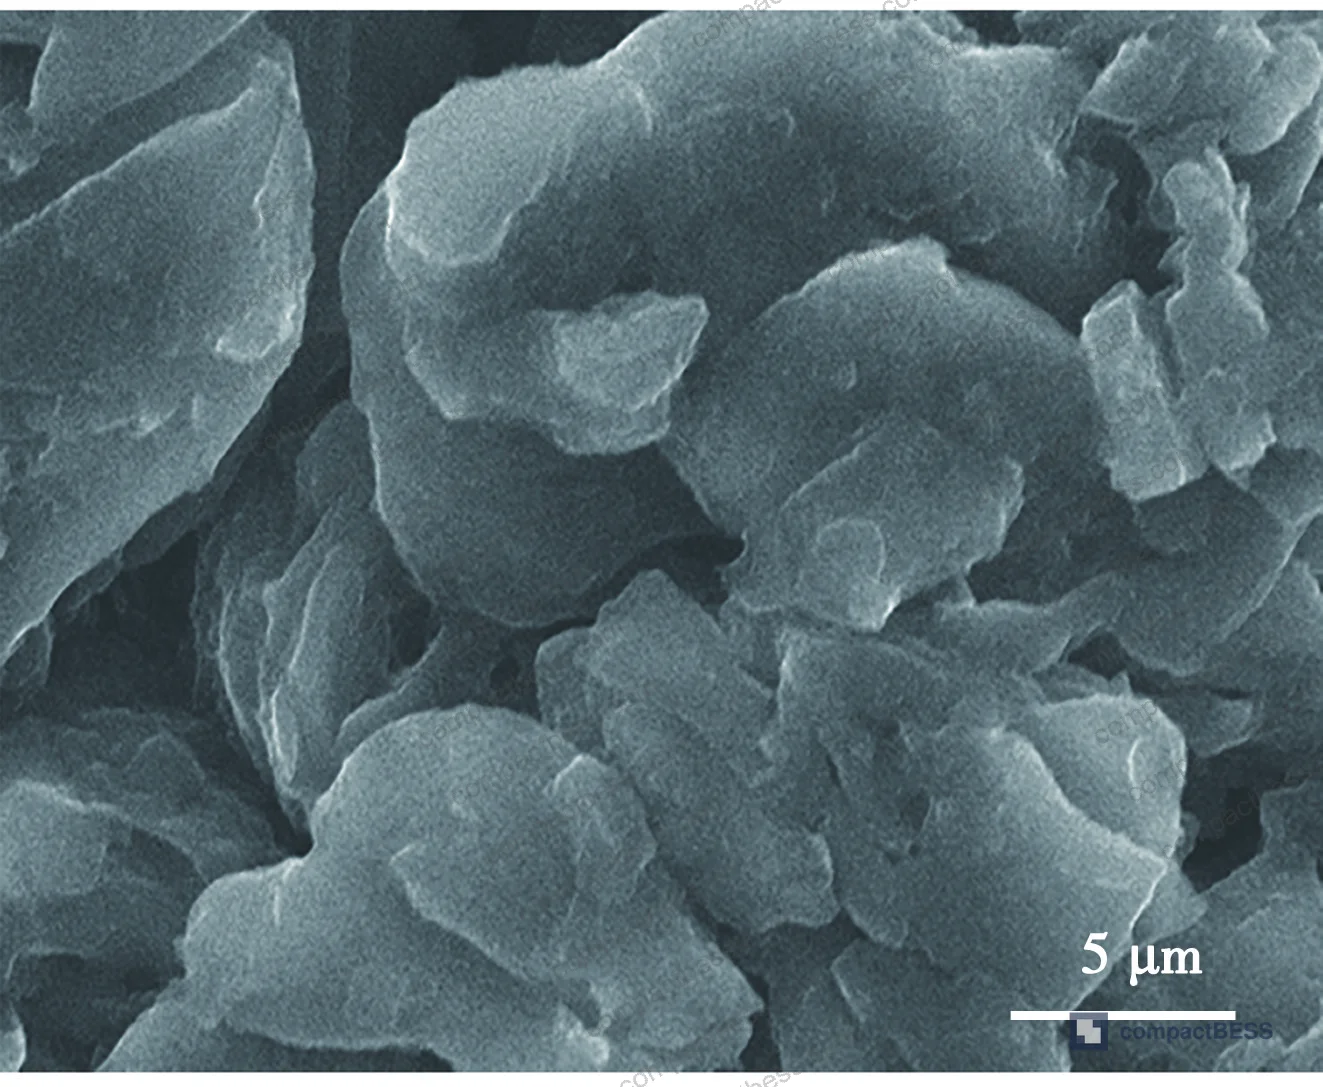
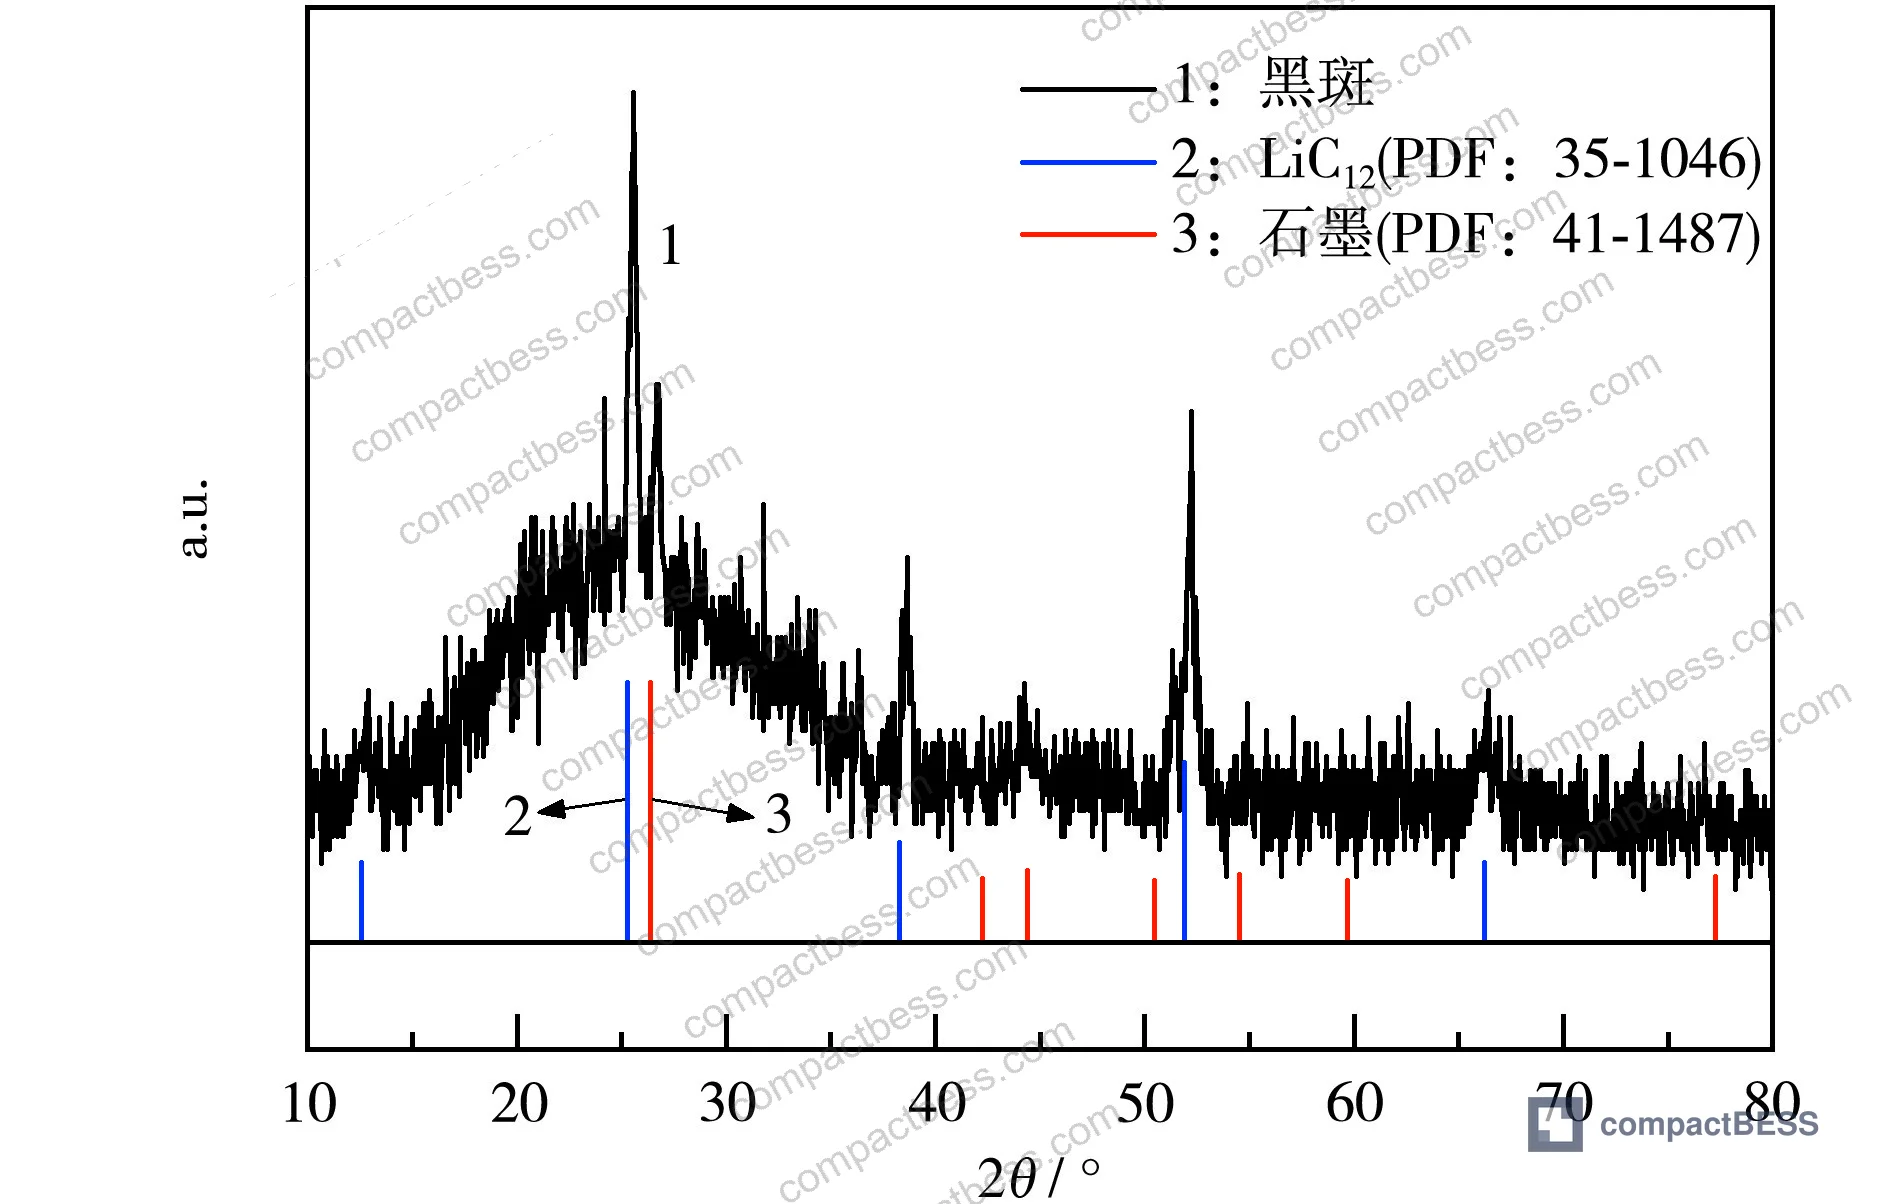
XRD analysis of those black spots identified two primary phases: LiC₁₂ (PDF: 35-1046) and graphite (PDF: 41-1487). The interpretation is clear — gas pockets accumulated at the anode-separator interface, blocking lithium transport pathways and preventing full lithiation in those regions. The result is permanent capacity loss baked in before the battery ever reaches your customer.
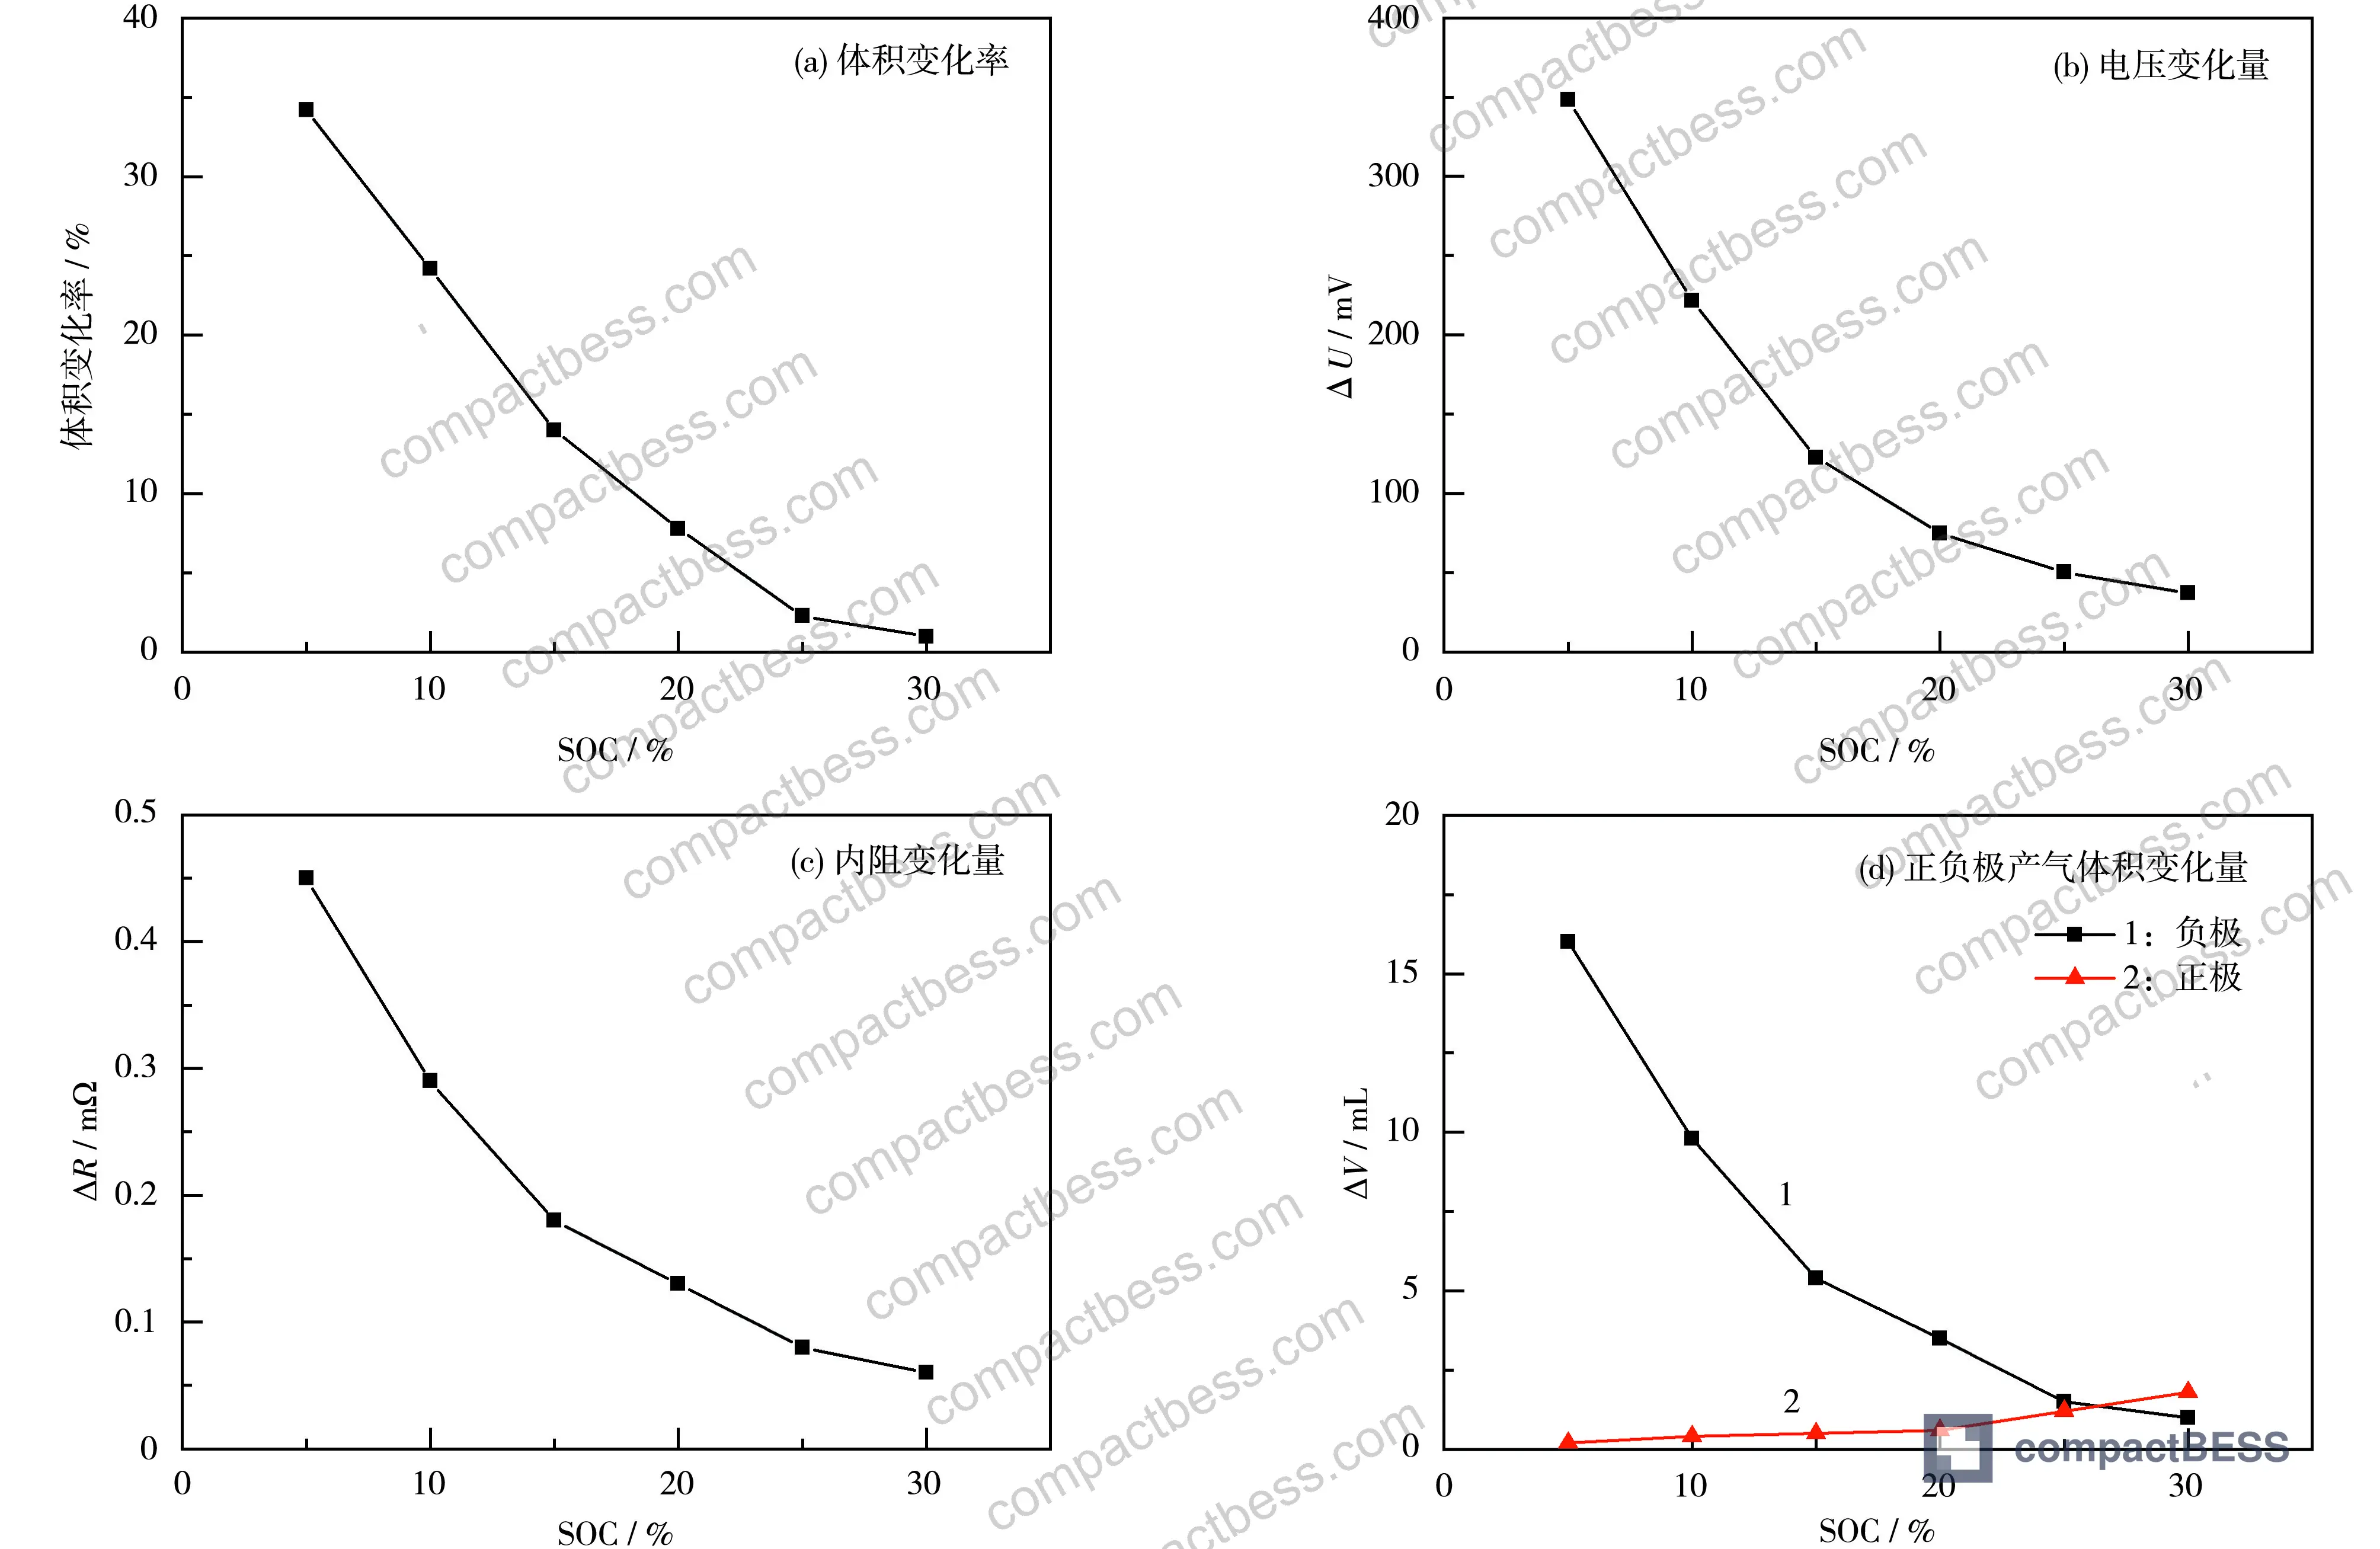
The gas evolution data separates anode and cathode contributions cleanly. As SOC drops from 30% to 5%, cathode gas volume actually decreases from 1.8 mL to 0.2 mL — the cathode becomes less oxidizing at lower charge states. But anode gas goes in the opposite direction: 1.0 mL at 30% SOC, rising to 1.5 mL at 25%, 3.5 mL at 20%, 5.4 mL at 15%, 9.8 mL at 10%, and 16.0 mL at 5% SOC. The anode is the dominant source of storage failure in low-SOC LFP cells.
This has direct implications for compliance with IEC 62619:2022 Safety requirements for secondary lithium cells and batteries, which addresses storage and transport safety requirements. A cell that arrives at your facility pre-swollen from poor SOC management during shipping is already a safety and warranty liability before a single charge cycle.
K-Value Screening and High-Temperature Aging: The Protocol That Separates Consistent Modules from Problematic Ones #
Once 30% SOC is established as the correct storage state, the next question is how to run the aging and self-discharge screening process efficiently. This is where most Chinese suppliers have meaningful variation — and where asking the right questions separates competent manufacturers from those just going through the motions.
The K-value is the rate of open-circuit voltage decay: K = (UOCV1 − UOCV2) / T₁₂, where T₁₂ is the elapsed time between the two measurements. In this work, T₁₂ was fixed at 96 hours total. Five aging protocols were tested across groups of 500 cells each:
| Group | High-Temp Aging (45°C) | Room-Temp Aging (25°C) | Avg U_OCV2 | Avg K-Value | K-Value Range |
|---|---|---|---|---|---|
| A | 0 h | 96 h | 3295.3 mV | 0.039 mV/h | 0.028 mV/h |
| B | 24 h | 72 h | — | — | — |
| C | 48 h | 48 h | — | — | — |
| D | 72 h | 24 h | 3284.3 mV | 0.136 mV/h | 0.199 mV/h |
| E | 96 h | 0 h | Notable drop | Elevated | Degraded |
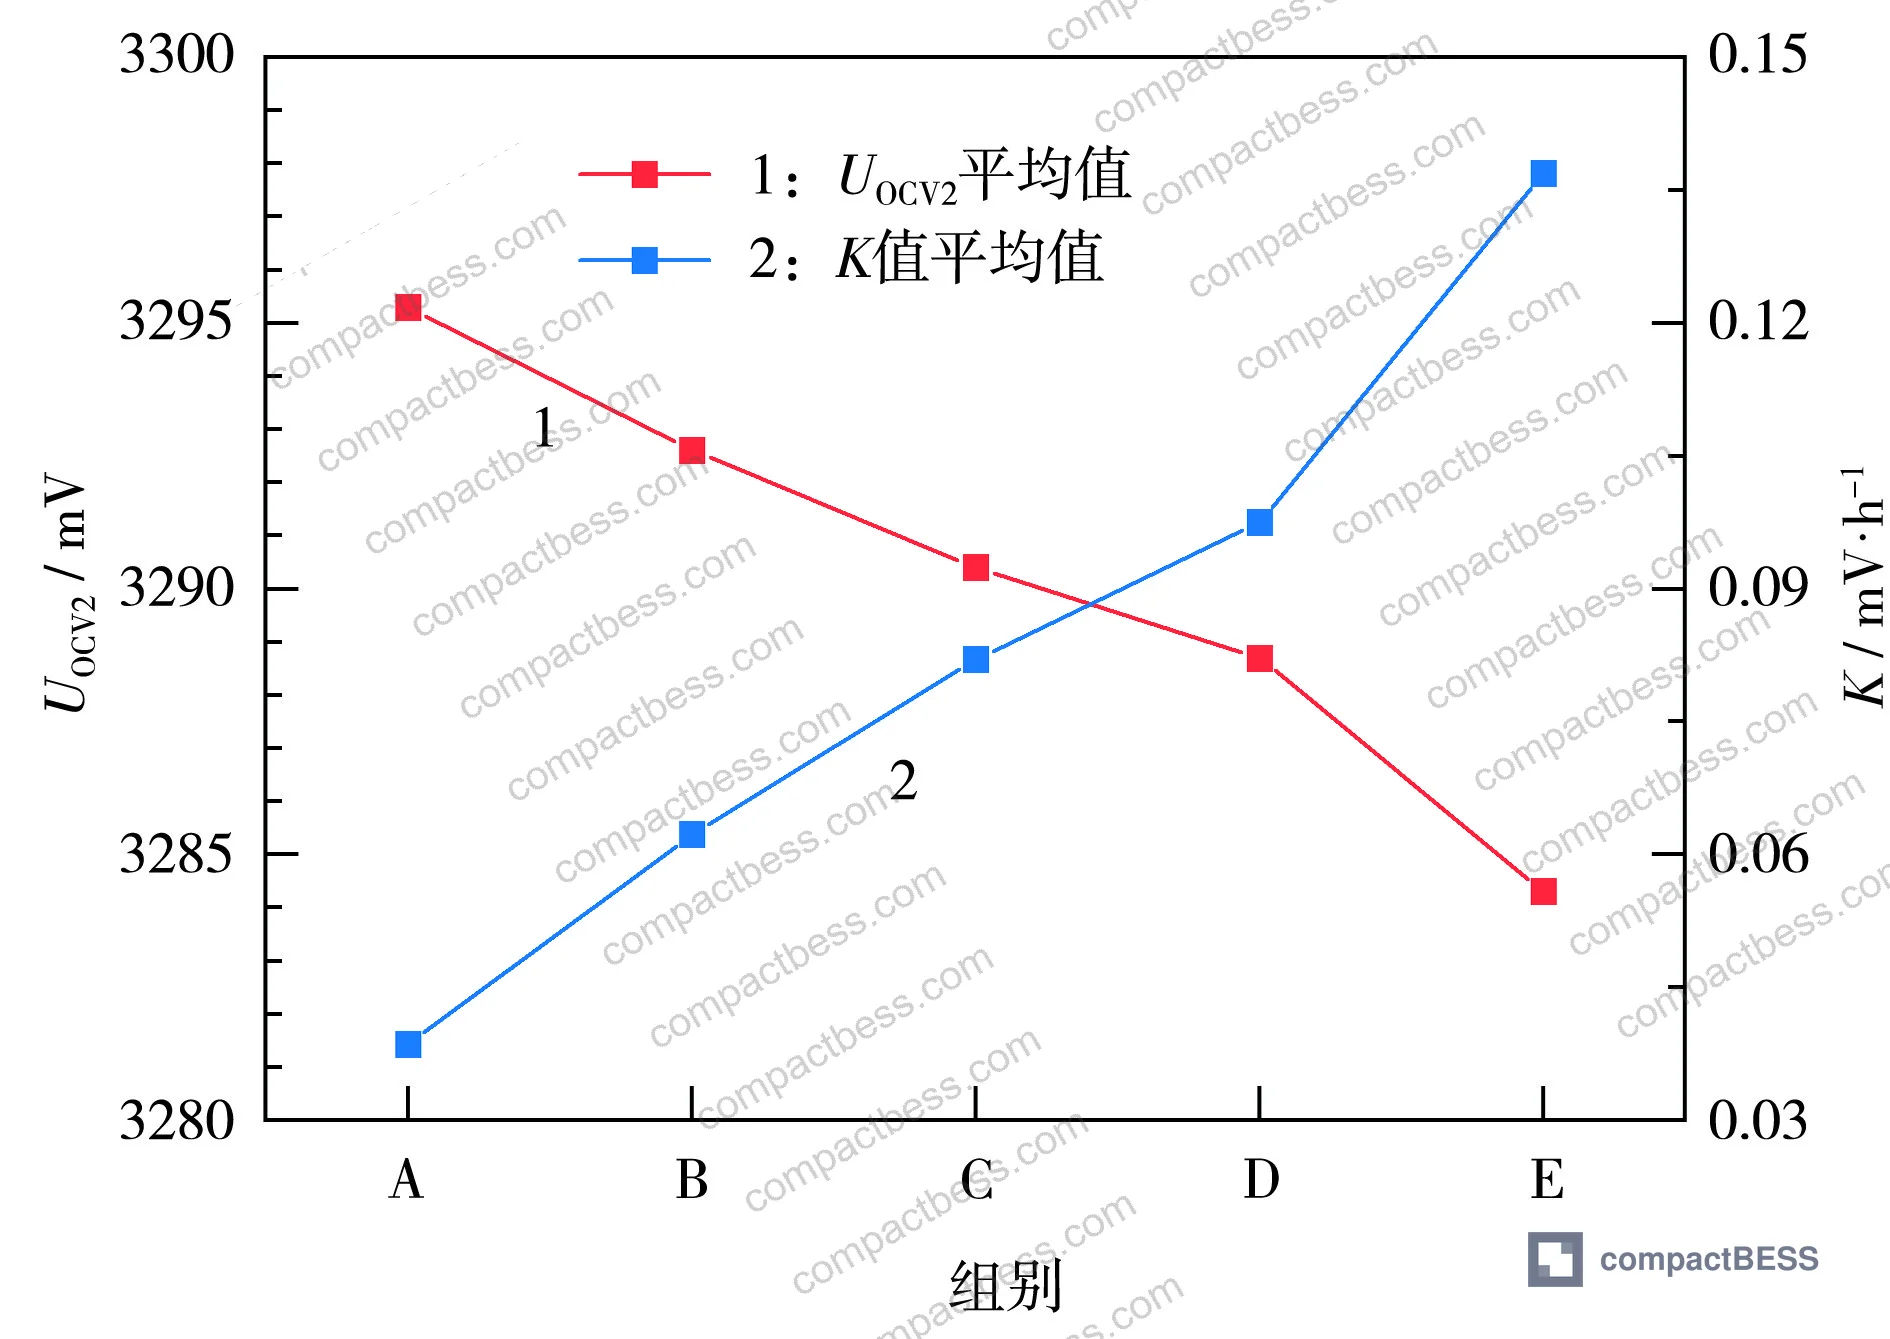
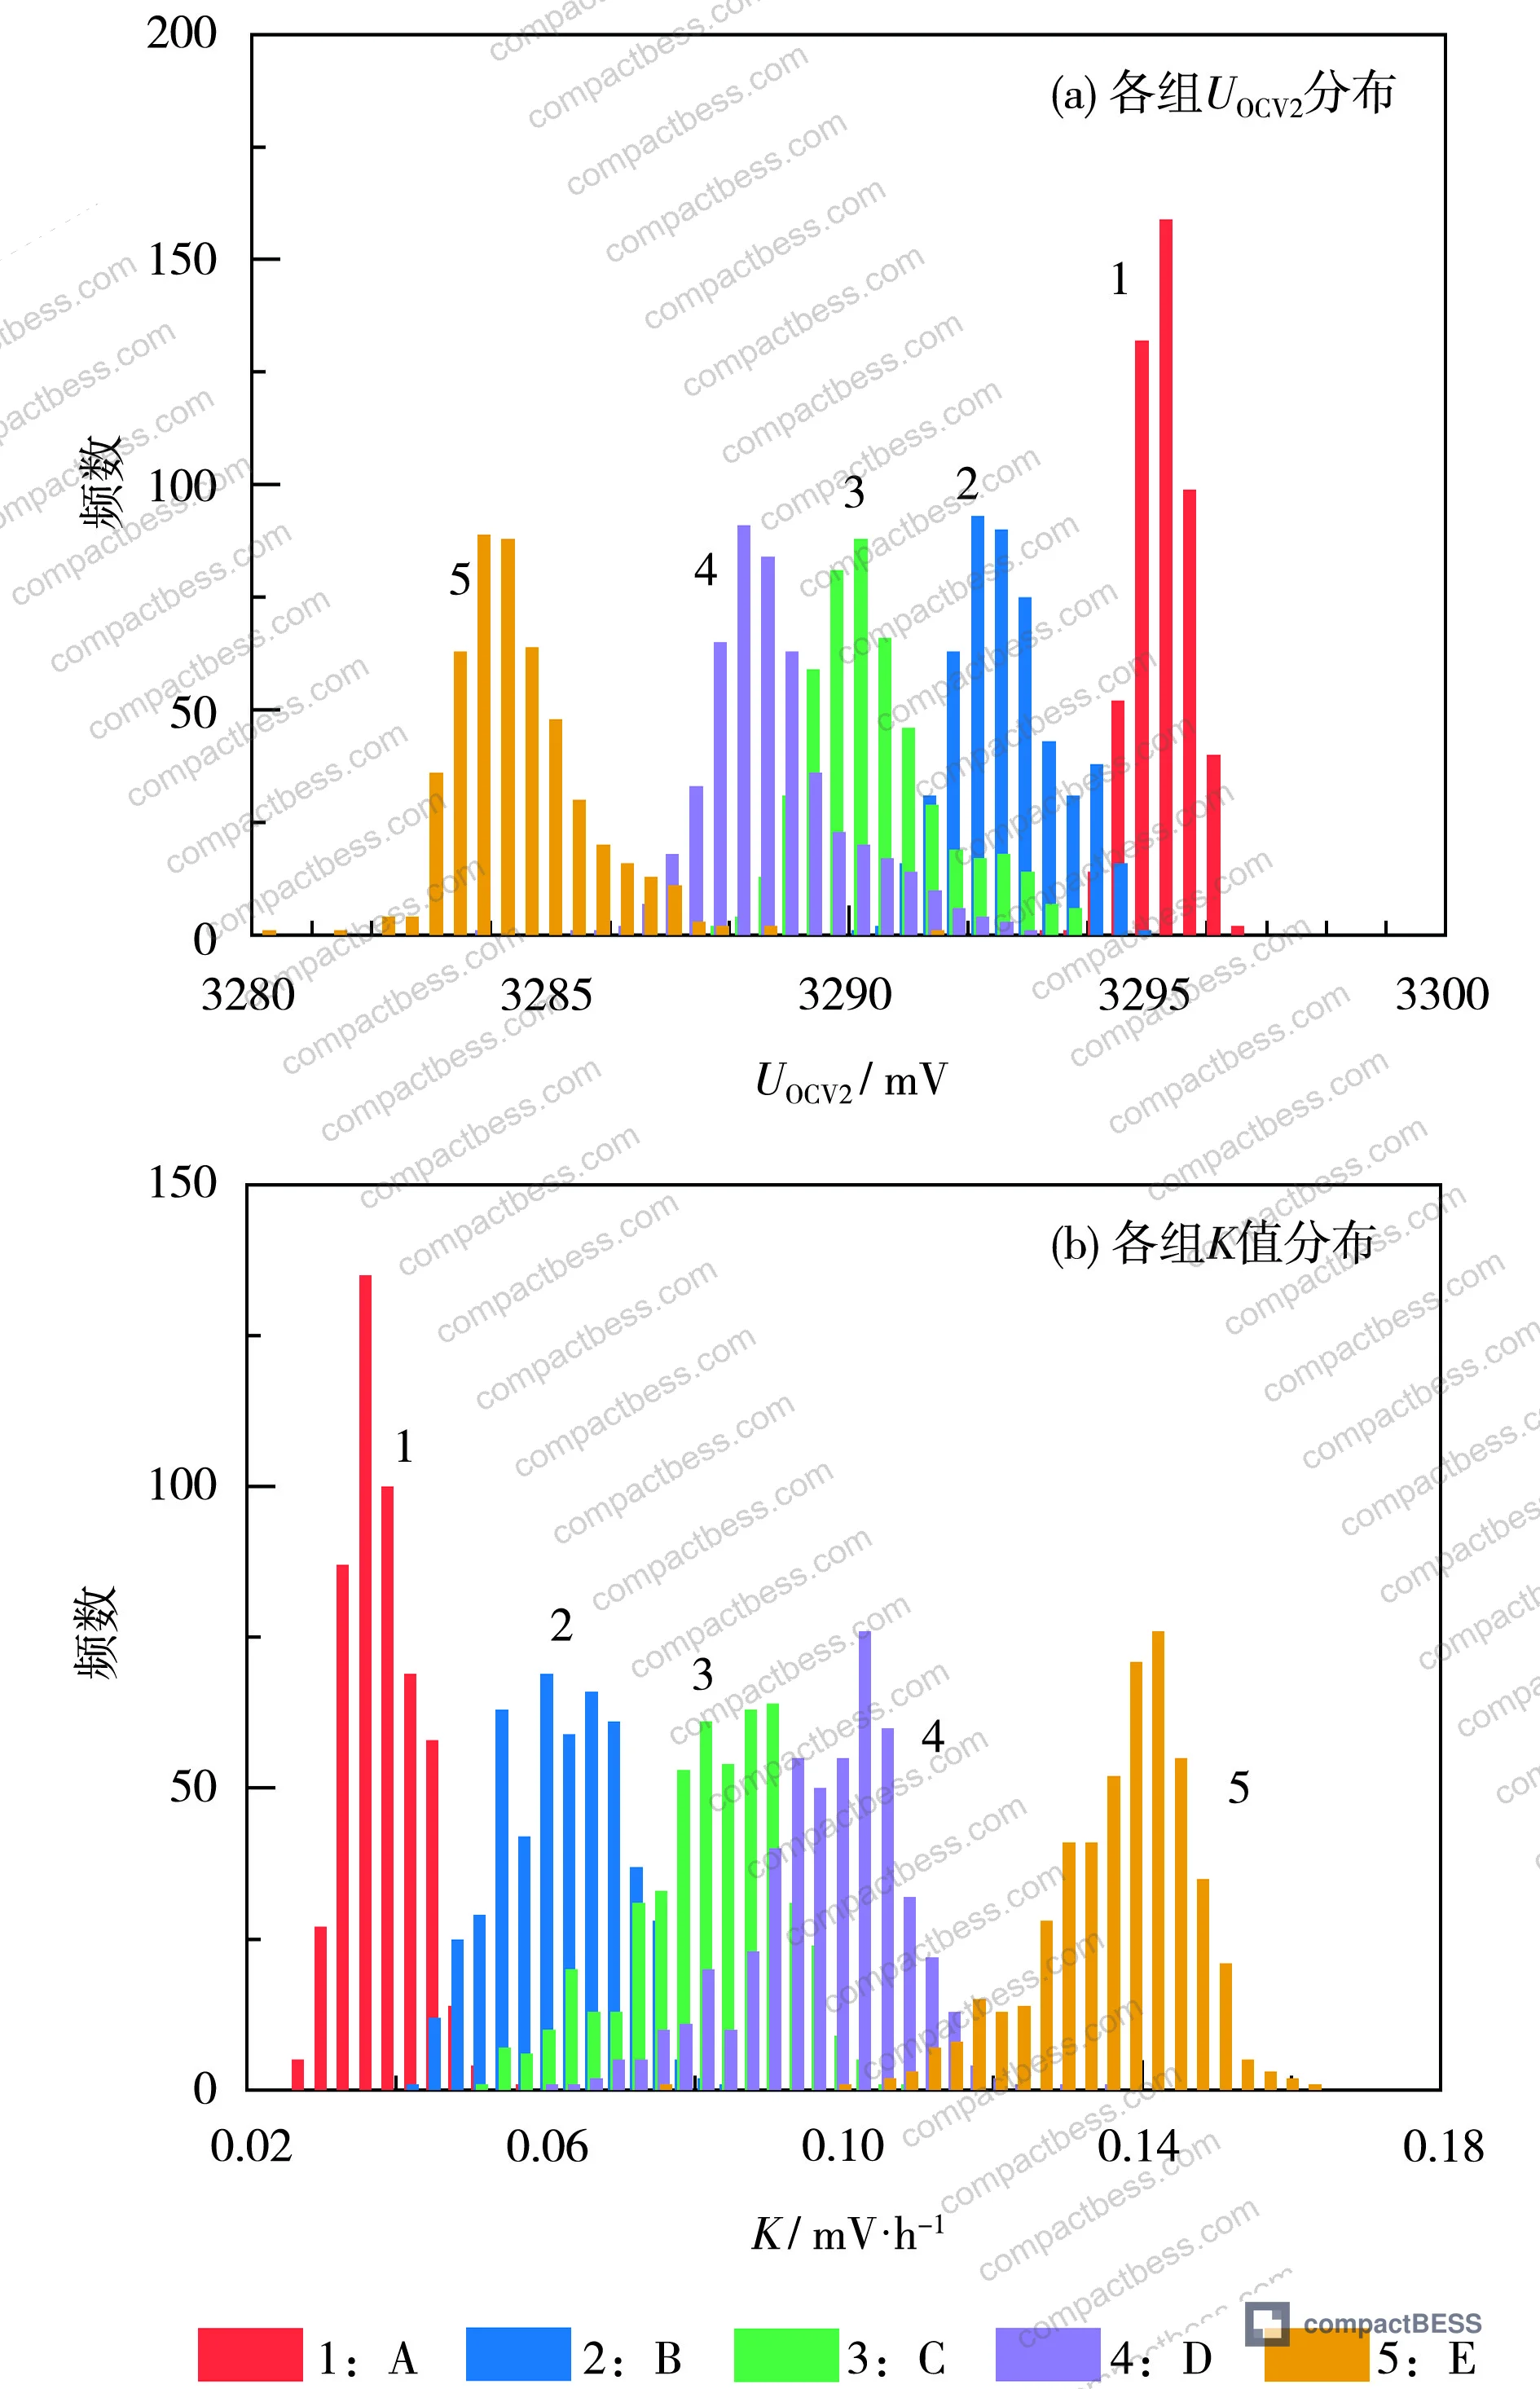
The trend from Groups A through D is clean: as 45°C aging time extends from 0 to 72 hours, U_OCV2 average decreases from 3295.3 mV to 3284.3 mV, K-value average increases from 0.039 to 0.136 mV/h, and — critically — the K-value range expands from 0.028 to 0.199 mV/h. That wider distribution makes it far easier to sort out high-self-discharge outliers before module assembly.
Group E (96 hours at 45°C) is where things go wrong. The average U_OCV2 drops more steeply and the K-value average jumps beyond the linear trend established by A–D. Over-aging accelerates internal side reactions to the point where the aging process itself introduces inconsistency rather than revealing it.
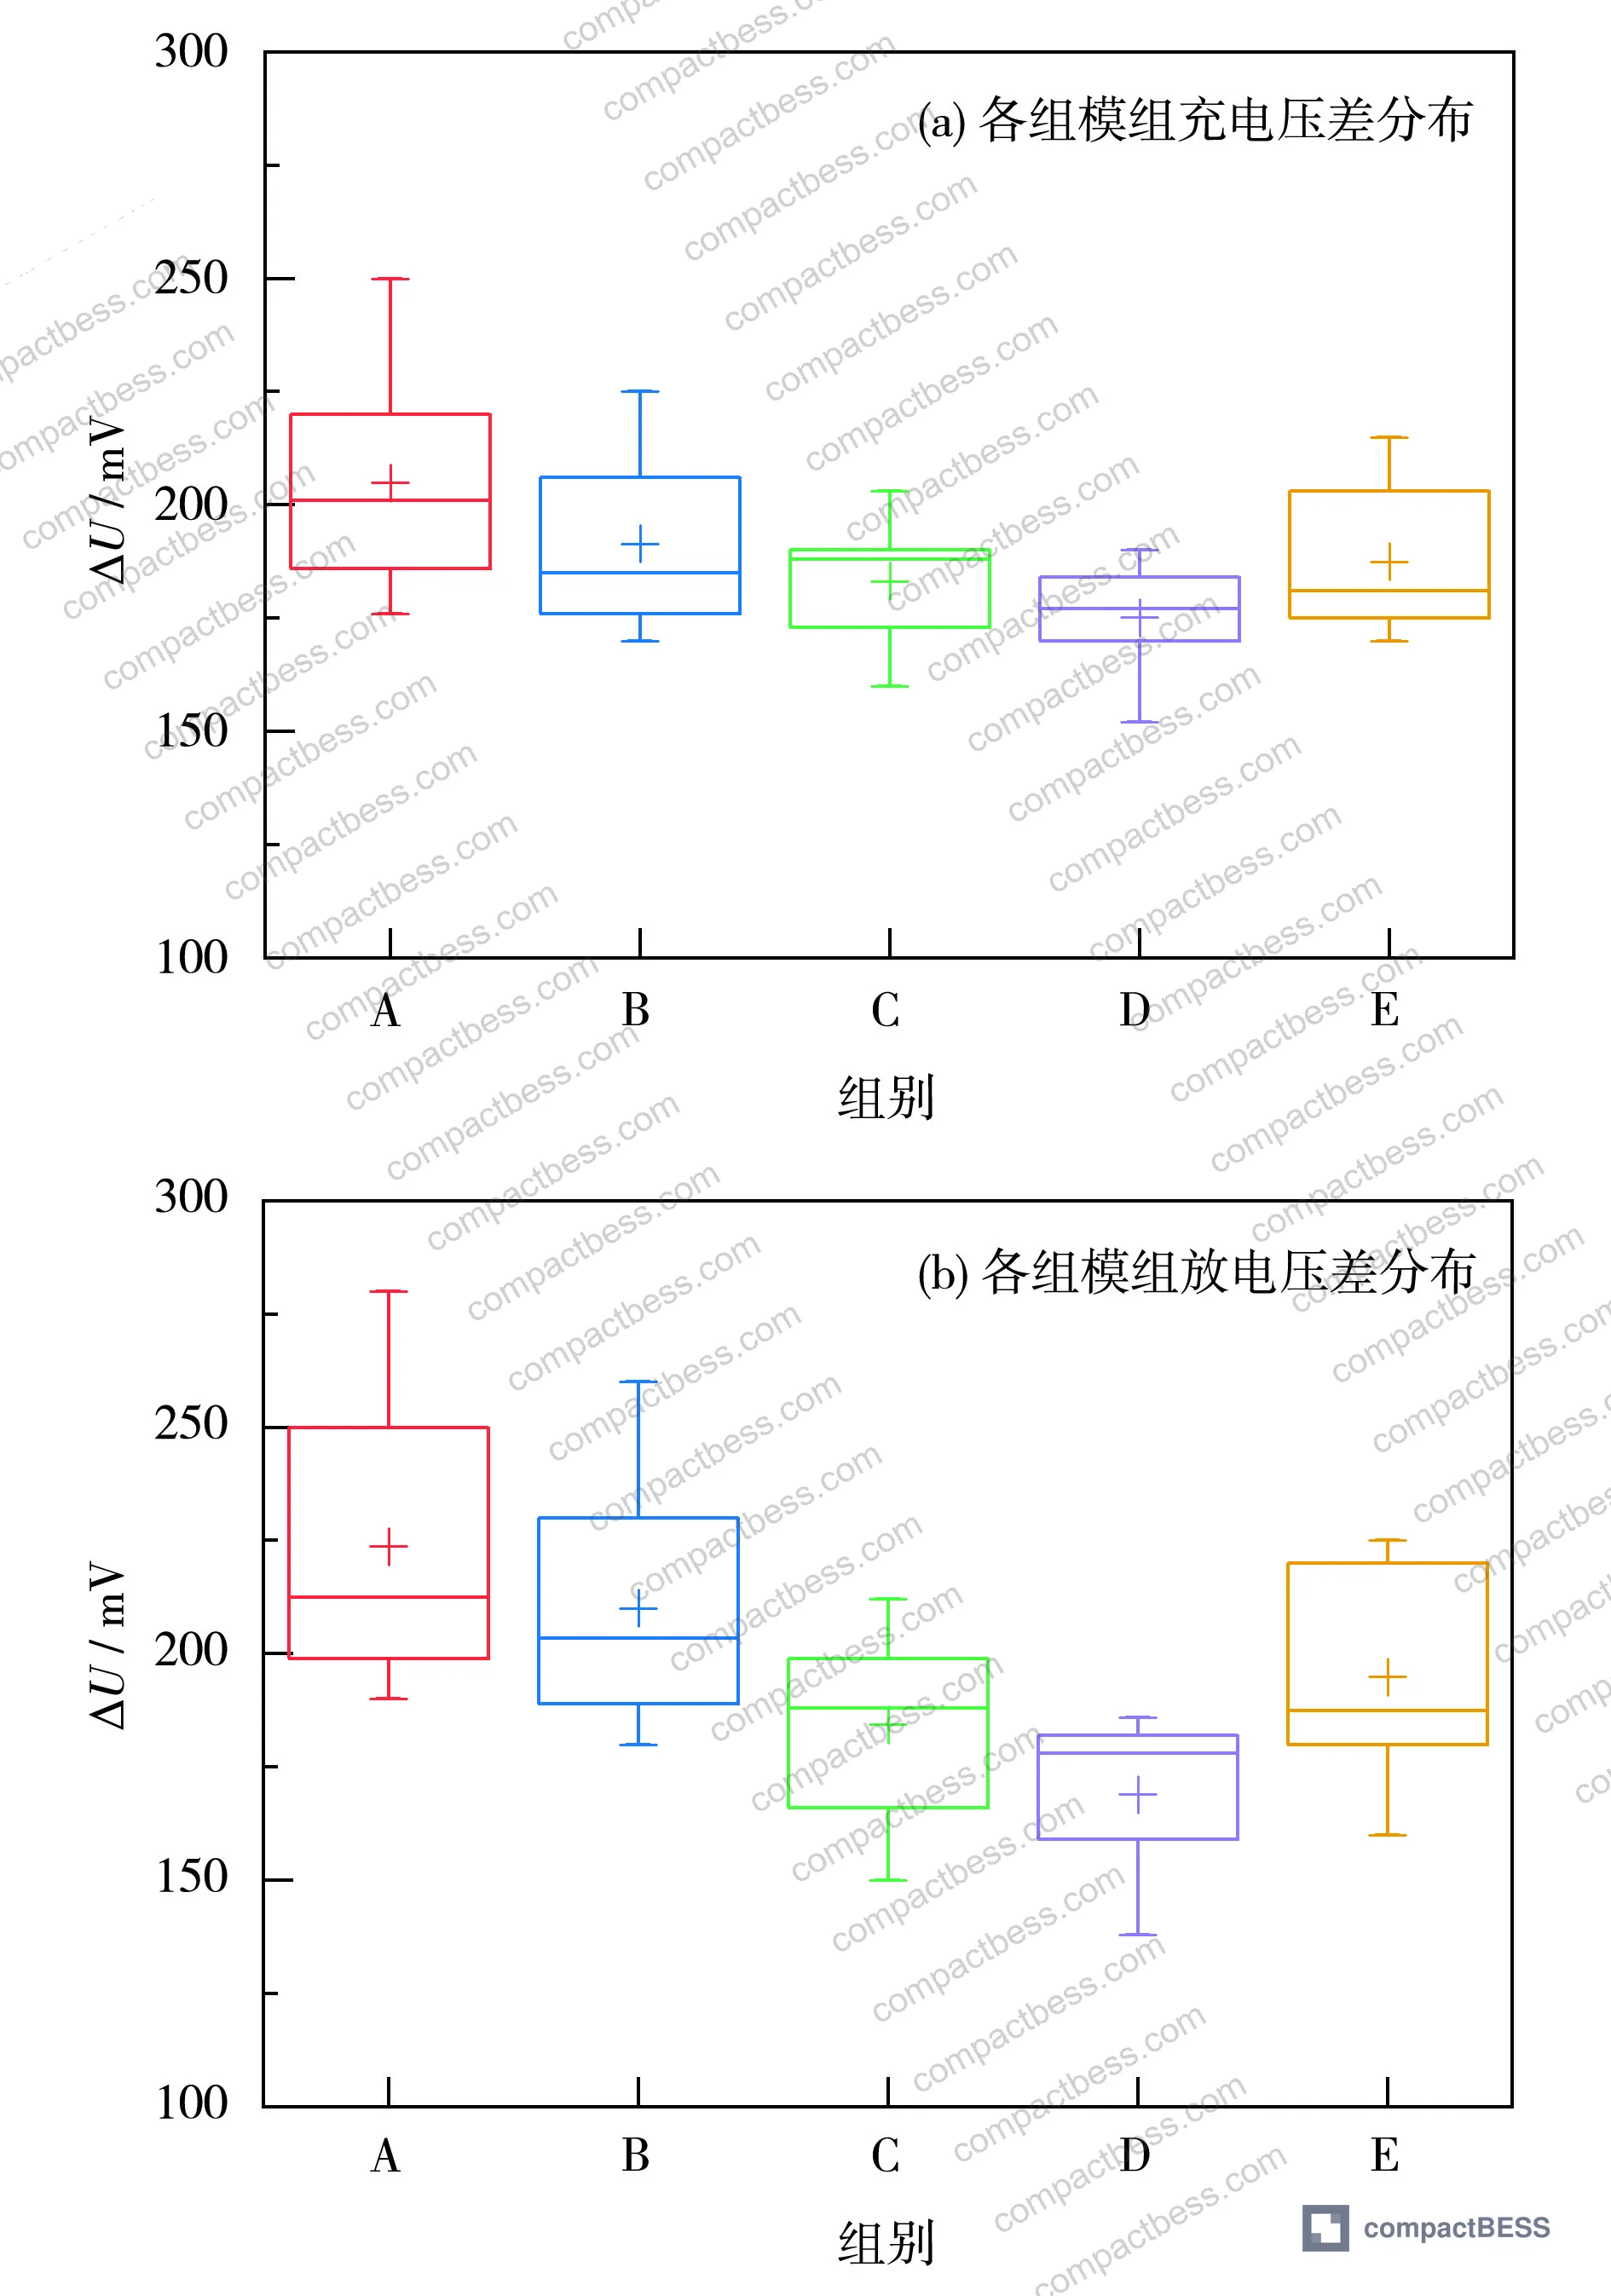
The module consistency data confirms this. Ten 16-cell modules were assembled from each aging group and tested at 0.5C charge/discharge with cell voltage limits of 3.6 V and 2.6 V. Results:
- Group A (no high-temp aging): max charge voltage spread 250 mV, max discharge spread 280 mV, spread range 74 mV / 90 mV
- Group D (72h at 45°C + 24h at 25°C): max charge spread 190 mV, max discharge spread 186 mV, spread range 38 mV / 48 mV
- Group E (96h at 45°C): charge spread increased to 215 mV, discharge to 225 mV — worse than Group D
Group D is the optimal protocol: 24-hour room-temperature rest to measure UOCV1, then 72 hours at 45°C plus 24 hours at room temperature to measure UOCV2 and compute K.
Honestly, most procurement teams don’t ask about this at all. They assume “the factory handles it.” But a supplier running only 24-hour room-temperature aging (Group A equivalent) is shipping you modules with nearly 2.5× the voltage spread of a supplier running the optimized Group D protocol. That voltage spread shows up immediately in your BMS logs and, over time, as accelerated degradation of weaker cells in the string.
This is also where IEC 61960-3 Secondary lithium cells and batteries for portable applications self-discharge test methodology provides a useful external benchmark — though the K-value method used here is more discriminating for module matching purposes because it operates in the voltage transition zone where differences between cells are amplified.
For buyers putting cells into transport certification processes, the UN 38.3 Recommendations on the Transport of Dangerous Goods — Lithium Battery Testing framework requires that cells meet safety criteria after thermal exposure — which is exactly the scenario this storage SOC research addresses. A cell pre-degraded by low-SOC storage may technically clear UN 38.3 at the time of testing but arrive at destination compromised.
For deeper context on how self-discharge screening feeds into Cell Consistency & Matching for module assembly, and how this affects pack-level performance under your specific Cycle Life & Degradation requirements, those topics are covered in detail in our technical library.
Practical Guidance for Buyers #
If you’re sourcing LFP cells or assembled packs from Chinese manufacturers for export to North America, Europe, or the Middle East, here’s what to act on immediately.
First, specify 30% SOC as the outgoing state of charge in your purchase specification. This should be a written requirement, not a verbal agreement. Ask your supplier to confirm this in their SOP documentation and request the storage voltage window that corresponds to 30% SOC on their specific cell model.
Second, ask for their K-value screening protocol in writing. The minimum acceptable process for high-quality module matching is 72 hours at 45°C followed by 24 hours at 25°C, with K-value calculated over a 96-hour window. Any supplier who can’t tell you their aging temperature, duration, and K-value threshold doesn’t have a mature process.
Third, request module consistency data. The charge and discharge voltage spread at 0.5C should be documented. A maximum charge voltage spread below 200 mV and discharge spread below 200 mV after aging are reasonable quality gates based on this data. Group D results showed 190 mV and 186 mV respectively — use those as benchmarks.
At compactbess.com, our team works with verified Chinese LFP manufacturers across Guangdong and neighboring provinces, connecting global OEM buyers and energy storage integrators with suppliers who can demonstrate documented aging protocols and traceability on these parameters. If you’re evaluating LFP cell suppliers for a volume order and want to compare process specs across qualified sources, need help identifying qualified suppliers for LFP cells or pack assembly? Talk to our sourcing team →
Supplier Qualification Questions #
- What is the outgoing SOC specification for your LFP cells, and can you provide documentation showing the voltage window corresponding to 30% SOC on your 20 Ah or equivalent cell model?
- What is your K-value screening protocol — specifically the high-temperature aging duration at 45°C, room-temperature aging duration at 25°C, and the total measurement window (T₁₂) used to calculate K = (UOCV1 − UOCV2) / T₁₂?
- What is your K-value rejection threshold in mV/h, and can you share a statistical distribution of K-values from a recent 500-cell production batch showing the proportion of cells rejected?
- After your standard aging protocol, what is the maximum charge voltage spread and discharge voltage spread measured at 0.5C across a 16-cell module, and what is the acceptable spread range (extremes-to-extremes)?
- Do you test anode gas evolution under 60°C storage conditions, and can you provide volume change data (measured by water displacement before/after) showing that your cells at 30% SOC produce less than 1.5 mL of anode gas after 7 days at 60°C?
Sourcing Checklist #
- ☐ Supplier documents outgoing SOC as 30% (±2%) in their production SOP, with a corresponding voltage value confirmed for their specific cell model
- ☐ K-value aging protocol includes at least 48 hours at 45°C (preferably 72 hours) within a 96-hour total measurement window per the K = (UOCV1 − UOCV2) / T₁₂ formula
- ☐ Batch K-value distribution data shows a range (max − min) of at least 0.1 mV/h, confirming adequate resolution for outlier rejection
- ☐ Module consistency test at 0.5C shows maximum charge voltage spread ≤200 mV and discharge voltage spread ≤200 mV across a ≥16-cell string
- ☐ Cell volume change rate after 60°C / 7-day storage at 30% SOC is confirmed ≤1.5% by water displacement measurement
- ☐ Supplier can demonstrate IEC 62619:2022 compliance documentation covering storage and transport safety requirements
- ☐ Internal resistance change after 60°C / 7-day storage at 30% SOC is ≤0.10 mΩ on fresh cells
- ☐ Supplier provides SEM or visual inspection records confirming no black-spot anode anomalies in outgoing production lots
Key Specifications Table #
| Parameter | Recommended Value | Verification Method |
|---|---|---|
| Outgoing storage SOC | 30% (±2%) | Voltage check against cell’s SOC-OCV curve; confirm voltage falls in 10.3%–30.5% transition zone |
| Cell volume change after 60°C / 7-day storage | ≤1.0% | Water displacement (Archimedes method) before and after thermal storage; compare V1 vs V2 |
| Internal resistance increase after 60°C / 7-day storage | ≤0.06 mΩ | AC impedance or DC pulse method per IEC 61960-3 before and after 60°C/7-day storage |
| K-value (self-discharge rate) aging protocol | 72 h at 45°C + 24 h at 25°C, T₁₂ = 96 h | OCV measurement at T=0 and T=96h; K = (UOCV1 − UOCV2) / 96 in mV/h |
| Module charge voltage spread (0.5C) | ≤190 mV maximum | 16-cell module charge to 58.4 V CV to 0.02C cutoff; record individual cell voltages |
| Module discharge voltage spread (0.5C) | ≤186 mV maximum | 16-cell module discharge to 40.0 V cutoff at 0.5C; record individual cell voltages at end of discharge |
| Anode gas evolution at 5% SOC / 60°C / 7 days | Reject if >16 mL | Water displacement on electrode coupons (5×5 cm, 5 pieces/bag, 5 mL electrolyte) before/after 60°C/7 days |
Can’t find a supplier meeting these specs? Submit your requirements and we’ll match you within 48 hours.
References #
Data source: Storage State of Charge Effects on Gas Evolution and Self-Discharge Screening in Lithium Iron Phosphate Cells for Module Assembly, Q.-A. Cao et al., Journal of the Electrochemical Society, 2025
Frequently Asked Questions #
Why does storing LFP cells at low SOC cause more gas than storing at higher SOC?
At low SOC, the graphite anode potential sits close to the electrochemical window where the SEI film forms — typically below 30% SOC for LFP/graphite chemistry. Fresh cells have an incompletely stabilized SEI layer, so the anode reacts with electrolyte components (EC, DMC, EMC, VC) generating gas. At 5% SOC, anode gas volume reached 16.0 mL after 7 days at 60°C versus only 1.0 mL at 30% SOC. The cathode behaves in the opposite direction — it actually produces less gas at lower SOC — but the anode effect dominates overwhelmingly.
What is the K-value and why does it matter for module assembly?
K-value is the open-circuit voltage decay rate, expressed in mV/h, calculated as K = (UOCV1 − UOCV2) / T₁₂ where T₁₂ is the elapsed measurement time. It quantifies self-discharge rate. Cells with high K-values drain faster in storage and, more importantly, become the weak link in a module string — they arrive at lower SOC than their neighbors during use, getting over-discharged on every cycle while the stronger cells get over-charged. Sorting cells by K-value before module assembly is the primary mechanism for achieving voltage consistency in production modules.
How much does high-temperature aging actually improve module consistency?
The improvement is substantial. Modules assembled from cells with no high-temperature aging (Group A, 96h at 25°C only) showed maximum charge voltage spreads of 250 mV and discharge spreads of 280 mV. Modules assembled after 72h at 45°C plus 24h at 25°C (Group D) showed 190 mV charge spread and 186 mV discharge spread — a 24–34% reduction. The spread range (max minus min across modules) dropped from 74 mV to 38 mV for charge and from 90 mV to 48 mV for discharge.
Is 45°C aging temperature safe for cells, or does it cause its own degradation?
Up to 72 hours at 45°C, the aging process follows a linear trend and the increase in K-value reflects accelerated self-discharge measurement rather than degradation. At 96 hours (Group E), the U_OCV2 average drops more steeply and K-value departs from the linear trend — indicating that extended high-temperature aging begins inducing additional side reactions beyond what’s useful for screening. So the process window is real: 45°C for 72 hours is productive aging, 96 hours starts to cause harm.
Can these SOC and aging protocols be verified during supplier qualification, or do buyers have to trust the supplier’s documentation?
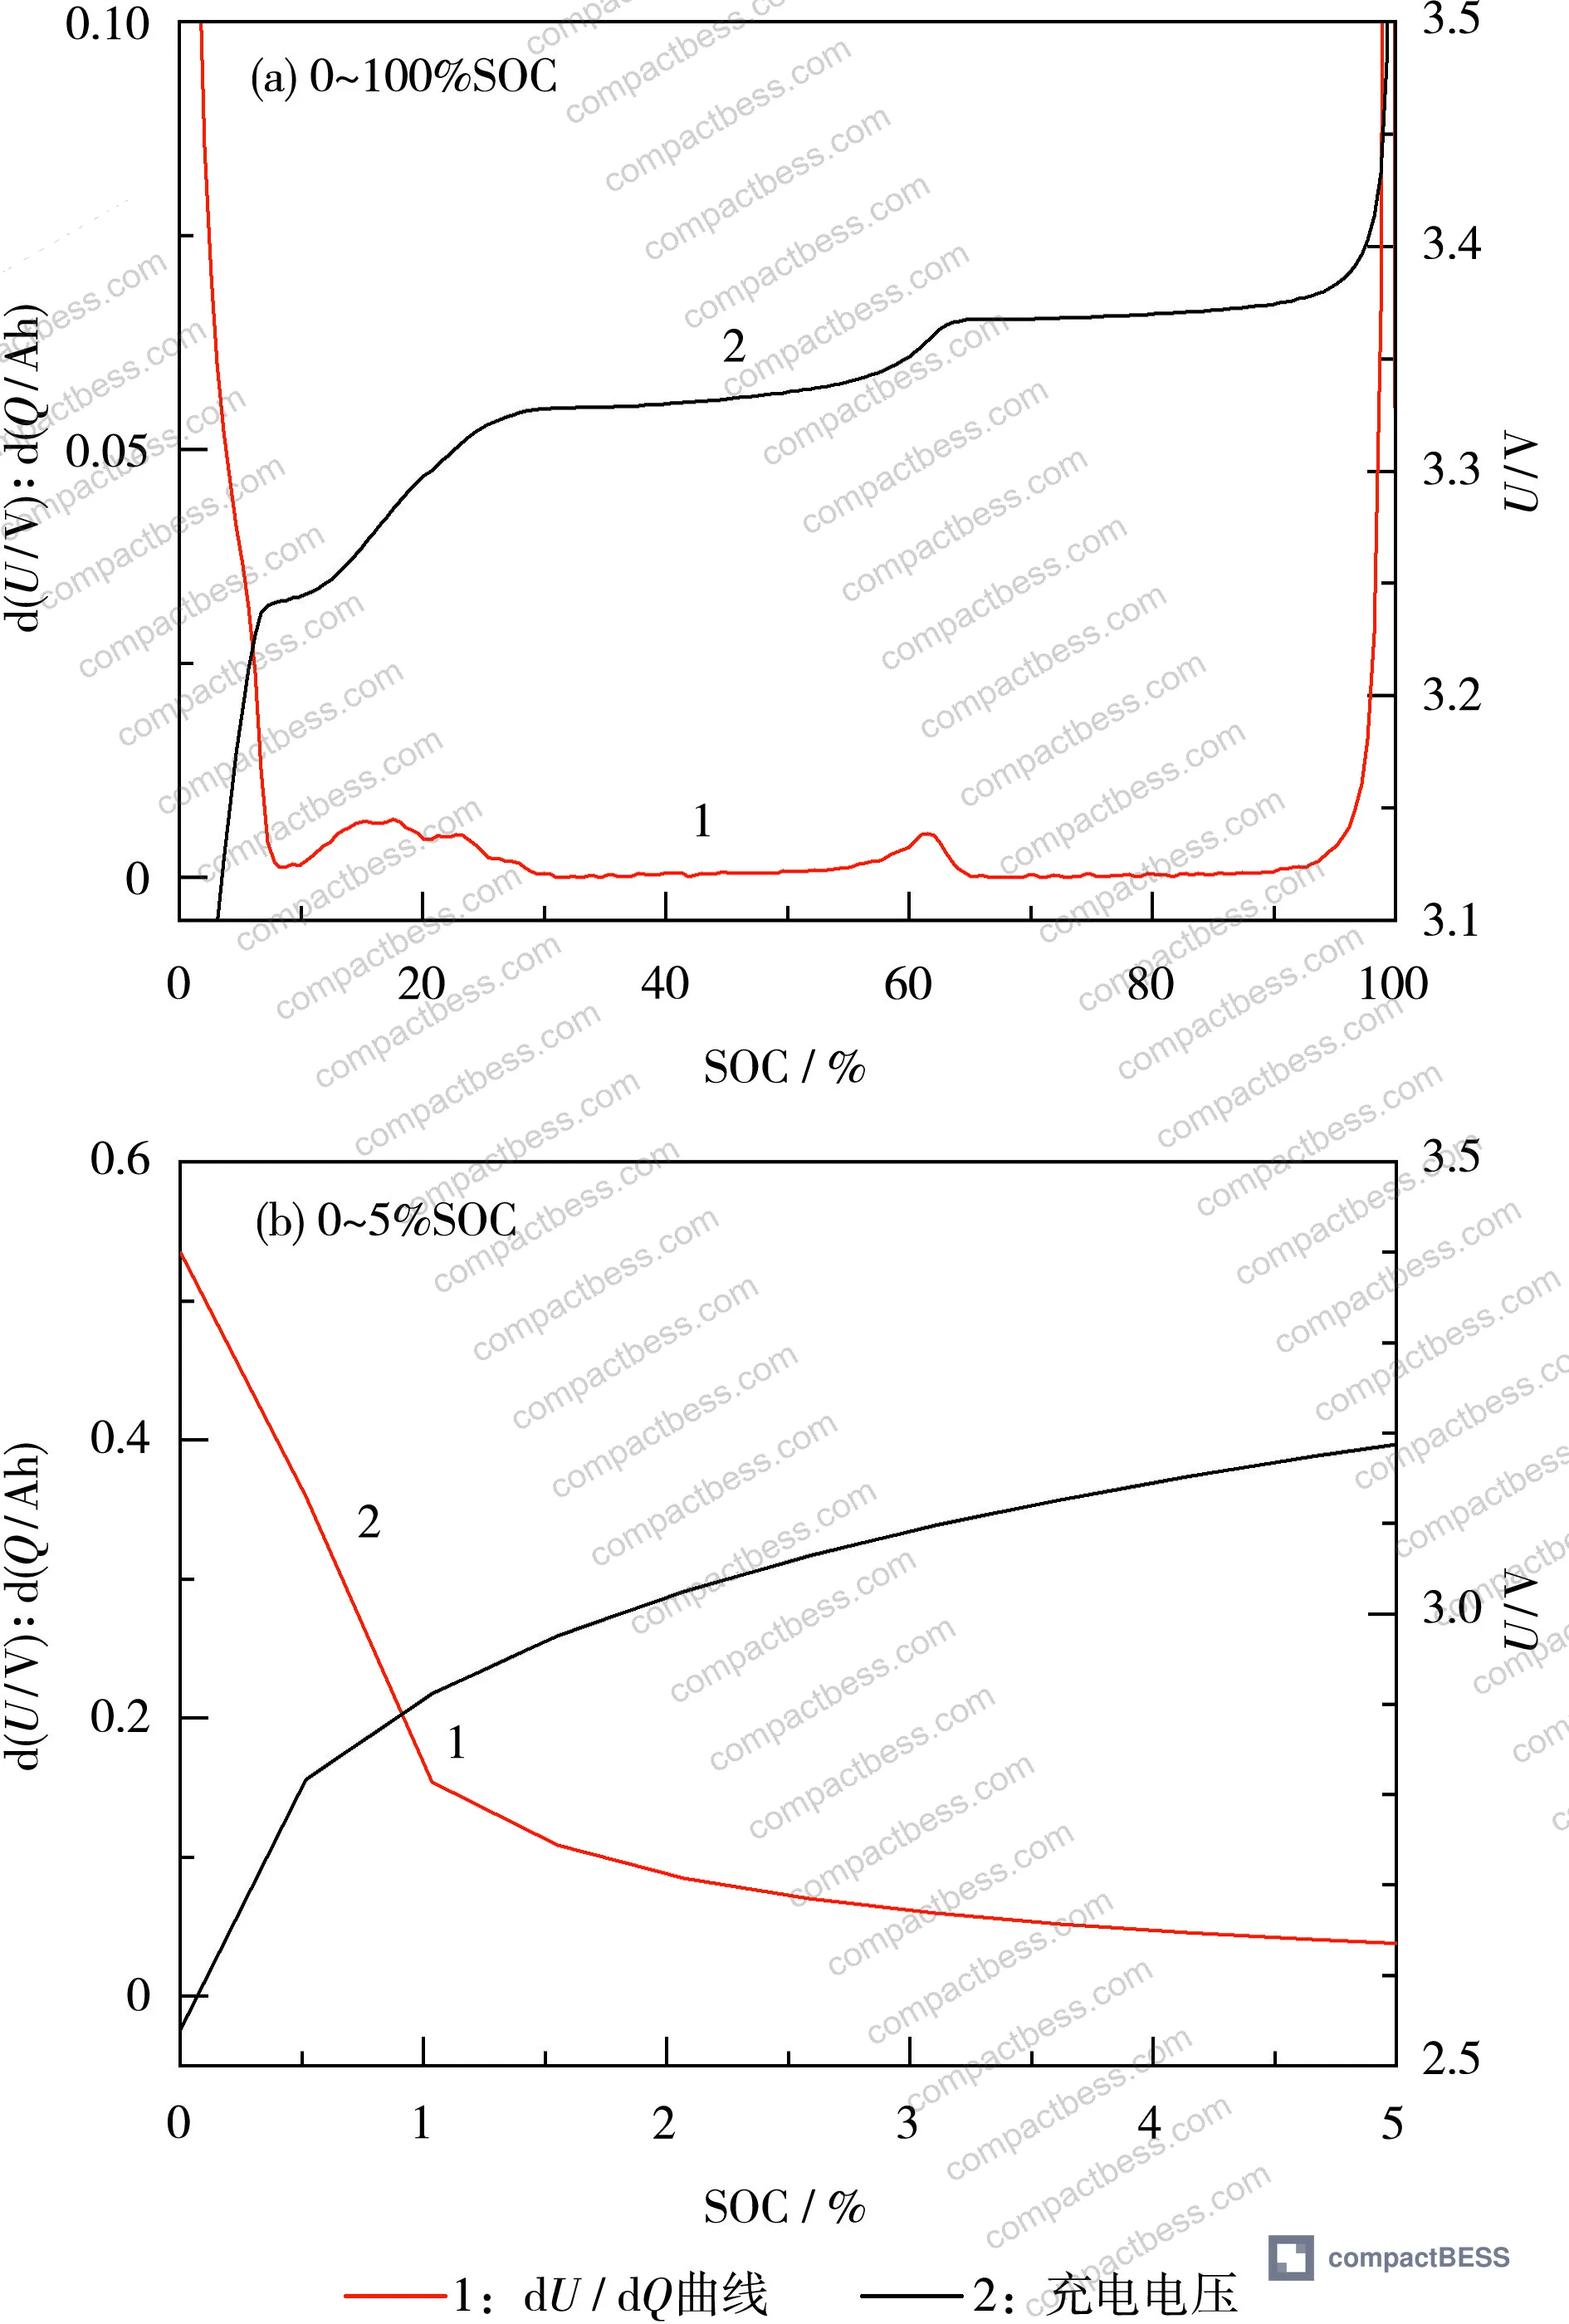
You can verify both. Request aged cell samples and measure K-value yourself using a precision voltmeter with a 96-hour open-circuit measurement window. For SOC verification, the cell’s OCV at 30% SOC for LFP/graphite chemistry falls in a characteristic plateau region — roughly corresponding to the transition between the second and third intercalation stages in the dU/dQ curve. Gas evolution testing requires water displacement equipment but is not complex. Any serious quality manager can build a receiving inspection protocol around these checks without specialized electrochemical instrumentation.
Published by compactbess.com Technical Team | Request a sourcing quote


